


Self-referenced spectral interferometry for ultra-short laser pulse characterization
-
摘要:
对于超短激光脉冲,精确表征其时域特性(脉宽和相位)对其产生和应用都至关重要。自参考光谱干涉法,于2010年首次提出,该方法利用待测光自身通过三阶非线性光学过程产生测量所需的合适参考光,并借助傅里叶变换光谱干涉算法解析重建光谱相位,具有单发、准确、灵敏度高等优势。本文对该方法的实现光路和重建算法两条主线进行了综述。在光路层面,从最早提出的基于交叉偏振波产生的自参考光谱干涉法(XPW-SRSI),到基于瞬态光栅效应的自参考光谱干涉法(TG-SRSI)全反射紧凑构型,对实现光路的灵敏度、波段覆盖与紧凑性三个维度进行了不断迭代升级。在算法层面,从针对于近傅里叶转换极限的脉冲重建方法,到针对时域展宽超过傅里叶变换极限两倍的大啁啾脉冲重建算法,进行了三条演进路线论述:光谱拼接方案,引入监督深度学习的重建方案,以及嵌入物理正向模型的无需训练神经网络;后者在无需任何预训练数据集的条件下,实现了大啁啾与高噪声场景下的单次准确重建。面对不断涌现的新型光束表征需求,超短激光脉冲的时域测量在未来仍需要备受重视。
Abstract:For ultrashort laser pulses, accurately characterizing their temporal characteristics (temporal width and phase) is crucial for their generation and application. Self-referenced spectral interferometry (SRSI), first proposed in 2010, utilizes the measured light itself to generate suitable reference light through third-order nonlinear optical processes, and employs Fourier transform spectral interferometry algorithms to reconstruct the input pulse. It has the advantages of single-shot, accuracy, and high sensitivity. This article provides an overview of the implementation of SRSI from two main aspects: the optical path and the reconstruction algorithm. On the optical path level, from the earliest proposed self-referenced spectral interferometry based on cross-polarization wave generation (XPW-SRSI) to the self-referenced spectral interferometry based on transient grating effect (TG-SRSI) with a compact total reflection configuration, the sensitivity, wavelength coverage, and compactness of the implementation path have been continuously iteratively upgraded. On the algorithm level, from pulse reconstruction methods targeting near Fourier transform limits to reconstruction algorithms for large chirp pulses with temporal broadening exceeding twice the Fourier transform limit, three evolutionary paths are discussed: spectral stitching schemes, reconstruction schemes incorporating supervised deep learning, and neural networks without training embedded in physical forward models. The latter achieves single-shot accurate reconstruction in large chirp and high noise scenarios without any pre-training dataset. In the face of emerging new beam characterization demands, the temporal measurement of ultrashort laser pulses still require significant attention in the future.
-
Key words:
- ultrashort laser /
- pulse measurement /
- deep learning
-
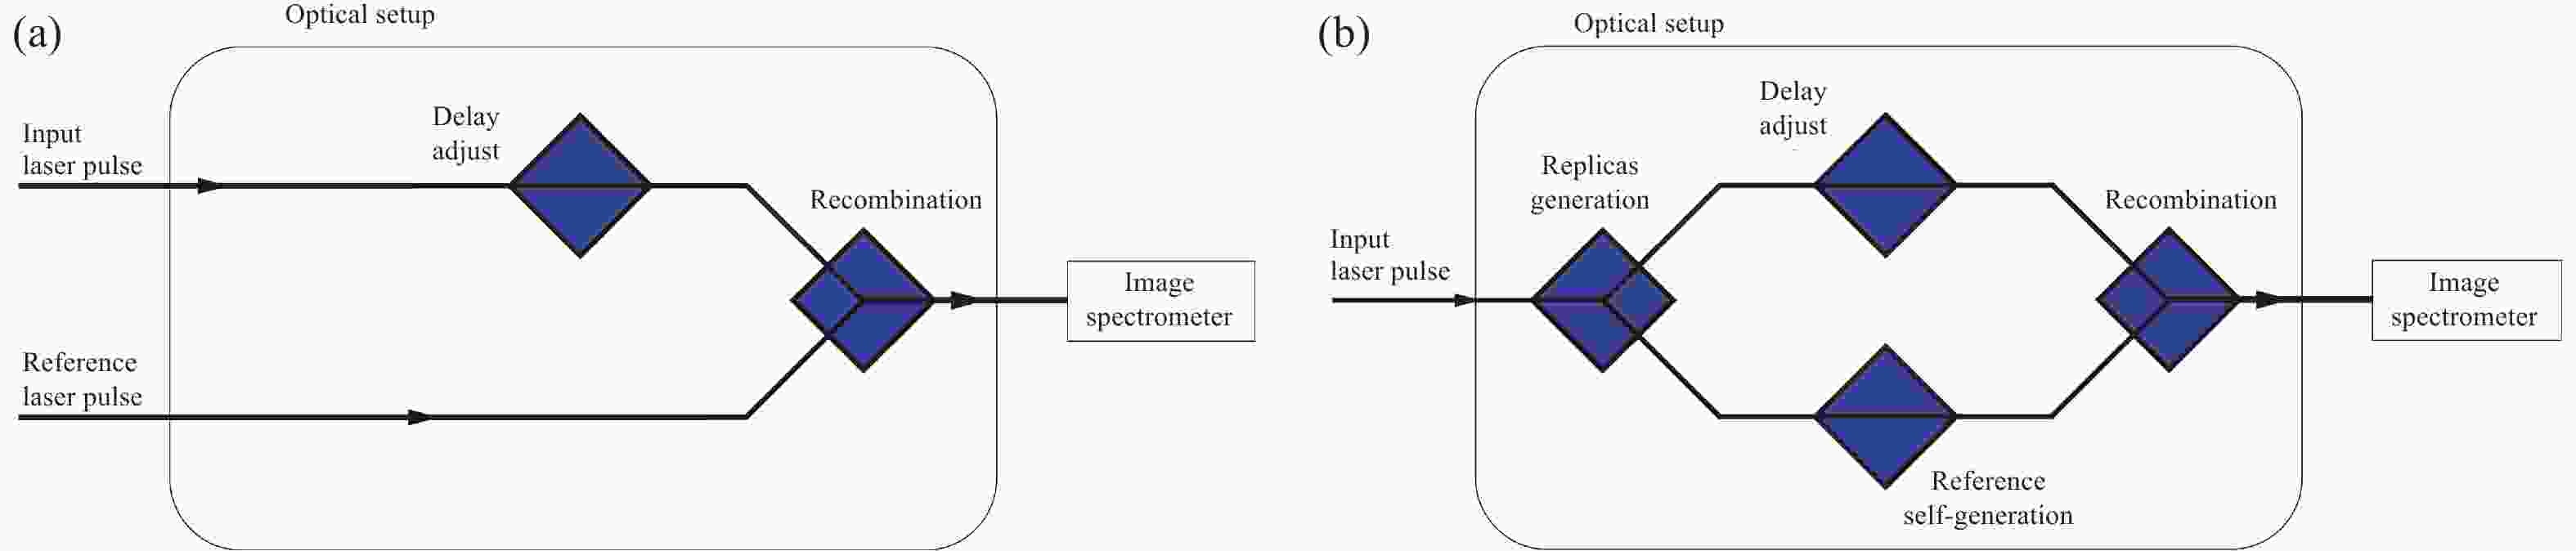
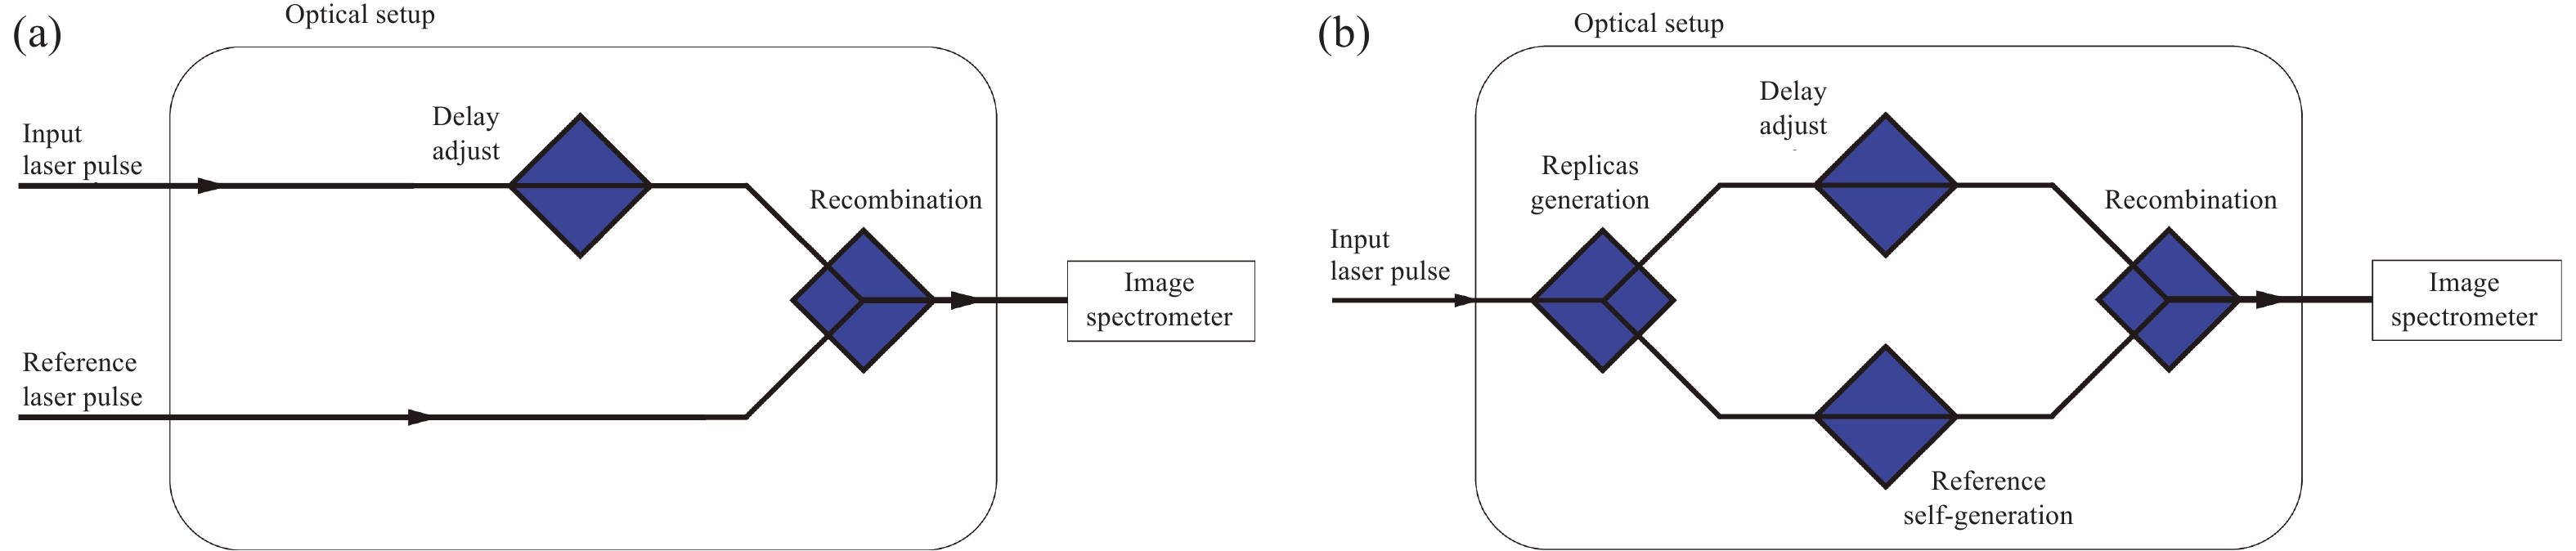
图 1 传统光谱干涉法(SI)与自参考光谱干涉法(SRSI)的光路对比示意图。(a)传统SI的光路设置。一束作为参考脉冲(需由外部独立光源提供),另一束为待测脉冲,经可调延迟线后与参考脉冲合束,进入光谱仪产生干涉条纹。(b)SRSI的光路设置。待测脉冲的一小部分通过三阶非线性过程产生自参考脉冲作为参考脉冲;其余部分经延迟后与参考脉冲合束进入光谱仪,形成携带相位信息的频谱干涉条纹。
Figure 1. Schematic comparison of traditional spectral interferometry (SI) and self-referenced spectral interferometry (SRSI). (a) Optical setup of conventional SI. One beam serves as the reference pulse (provided by an external independent source), and the other is the unknown pulse. After passing through an adjustable delay line, it is combined with the reference pulse and directed into a spectrometer to generate interference fringes. (b) Optical setup of SRSI. A small portion of the unknown pulse generates a self-referenced pulse via a third-order nonlinear process, which acts as the reference pulse. The remaining part is delayed, combined with the reference pulse, and sent into the spectrometer, forming spectral interference fringes that carry phase information.

图 2 (a)交叉偏振波产生原理,其中使用一个偏振片来分离产生的交叉偏振波。(b)自衍射过程,图中
$ {k}_{sd1} $ 和$ {k}_{sd2} $ 分别表示一阶和二阶自衍射信号。(c)瞬态光栅过程,图中$ {K}_{TG} $ 为产生的瞬态光栅信号。Figure 2. Principles of (a) cross-polarized wave generation (XPW), where a polarizer is used to separate the generated XPW. (b) Self-diffraction (SD) process, where
$ {k}_{sd1} $ and$ {k}_{sd2} $ are the first- and second-order SD signals, respectively. (c) Transient-grating (TG) process, where$ {K}_{TG} $ is the generated TG signal.
图 3 XPW-SRSI原理图。CP为方解石平板,用于产生一个偏振方向与入射脉冲垂直的延迟待测脉冲;P为偏振片。
Figure 3. Principle of XPW-SRSI. CP is a calcite plate used to generate a delayed test pulse with polarization perpendicular to that of the incident pulse, and P is a polarizer.
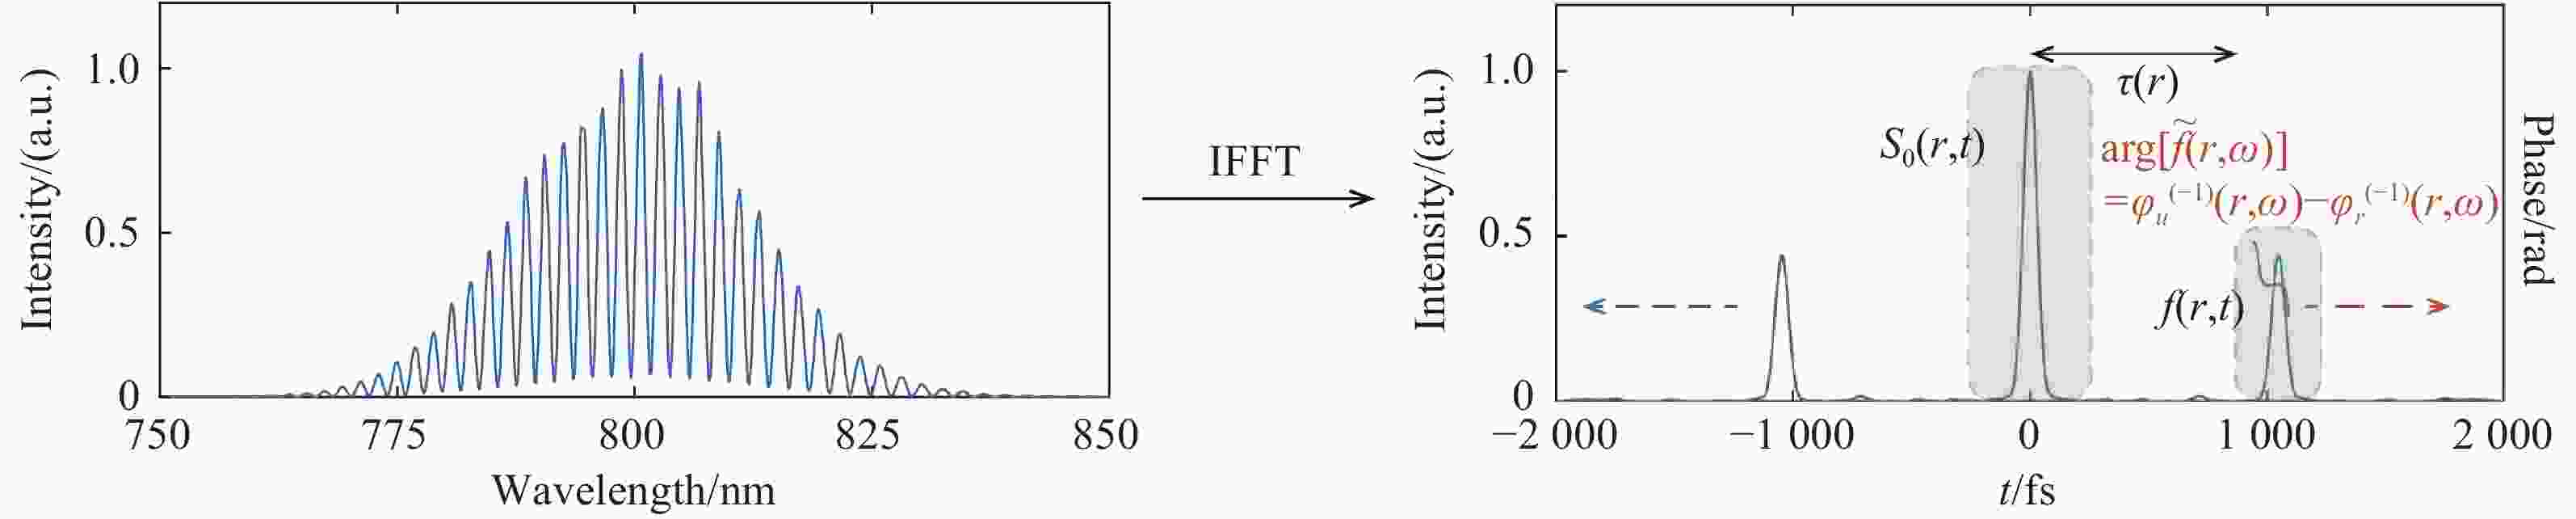
图 4 傅里叶变换光谱干涉法从条纹中提取幅度与相位的流程。
Figure 4. Procedure for extracting amplitude and phase in fourier transform spectral interferometry.
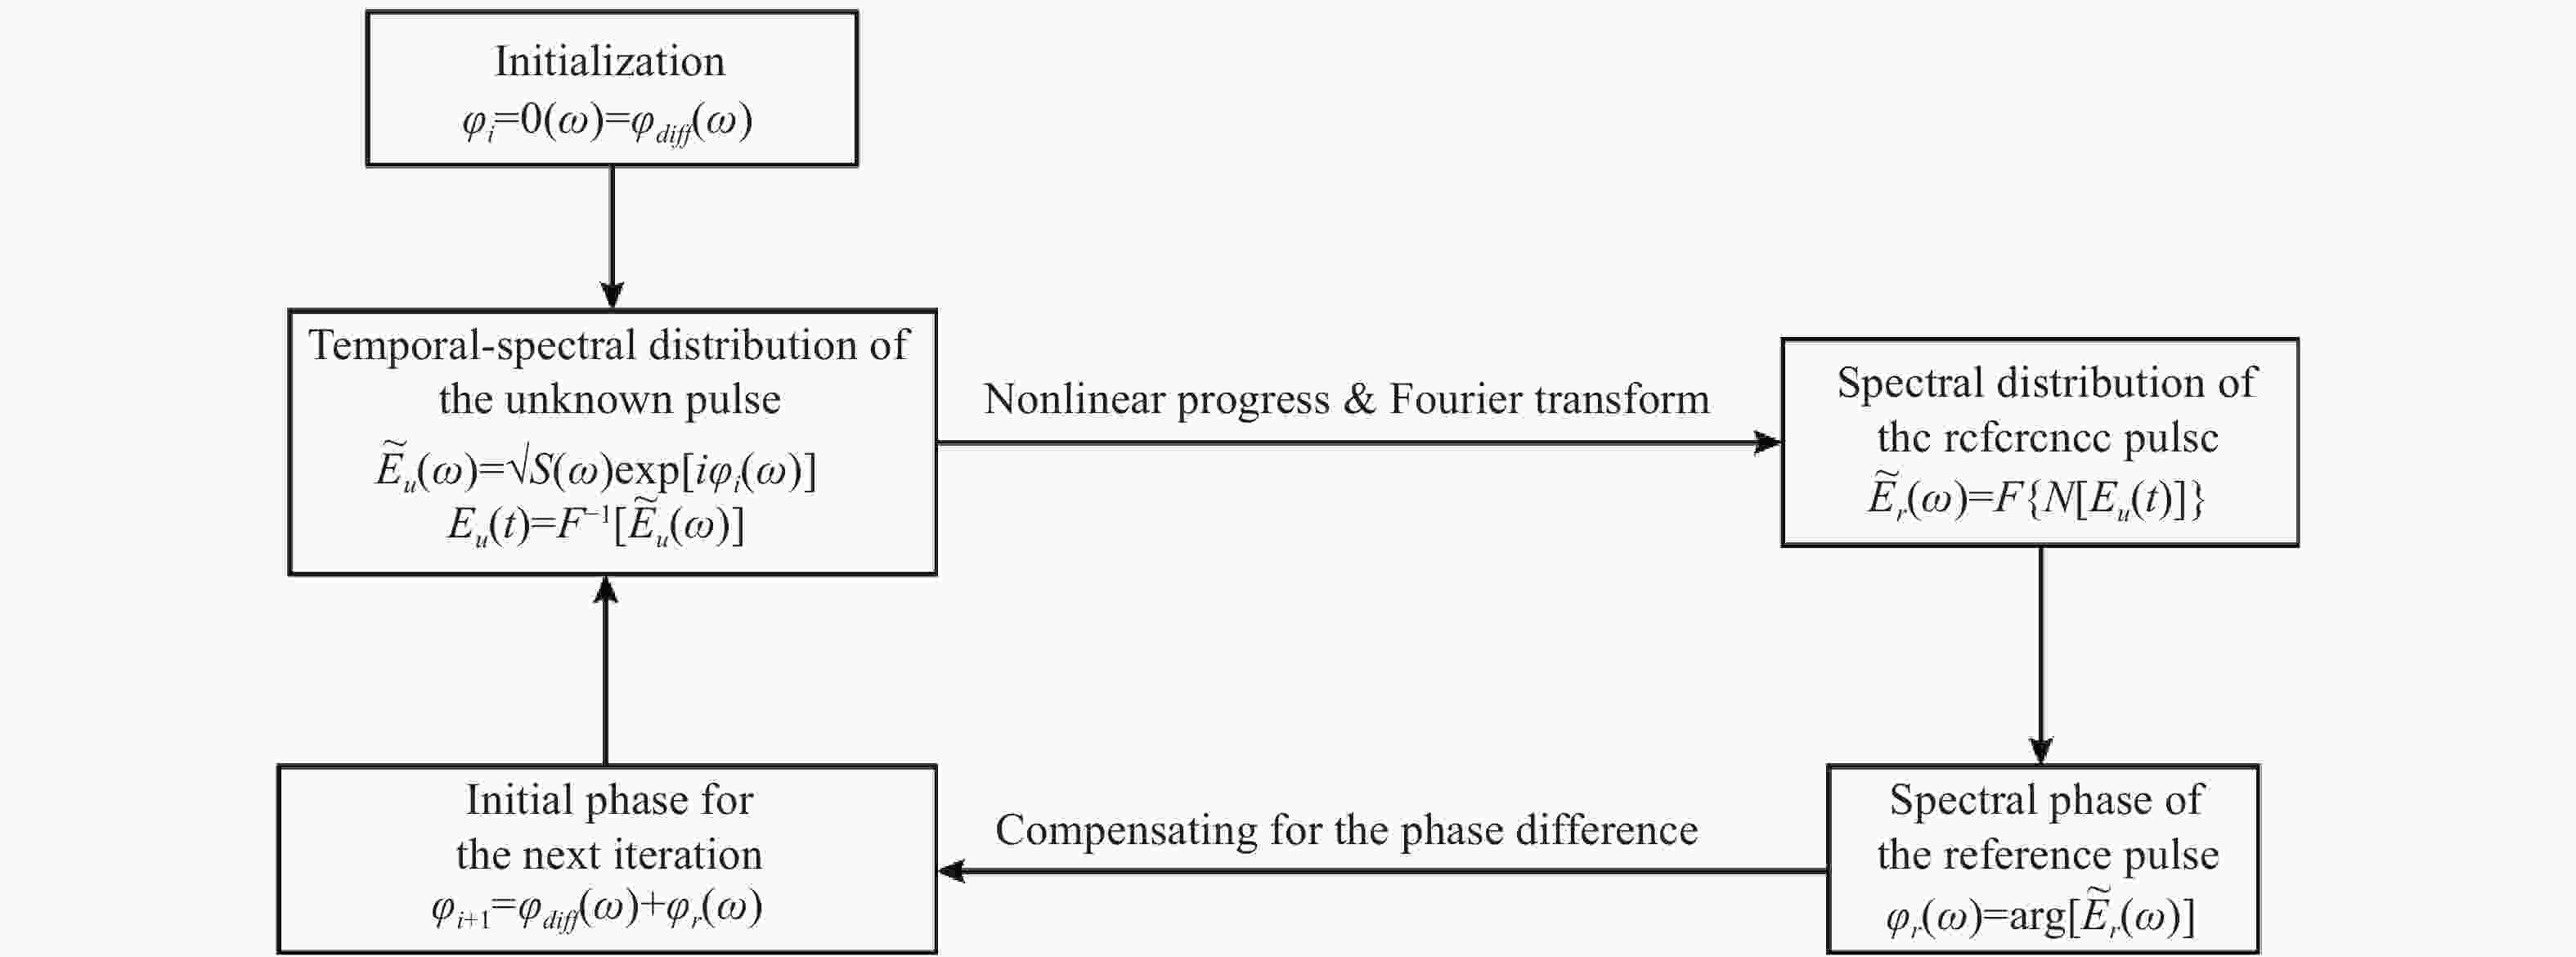
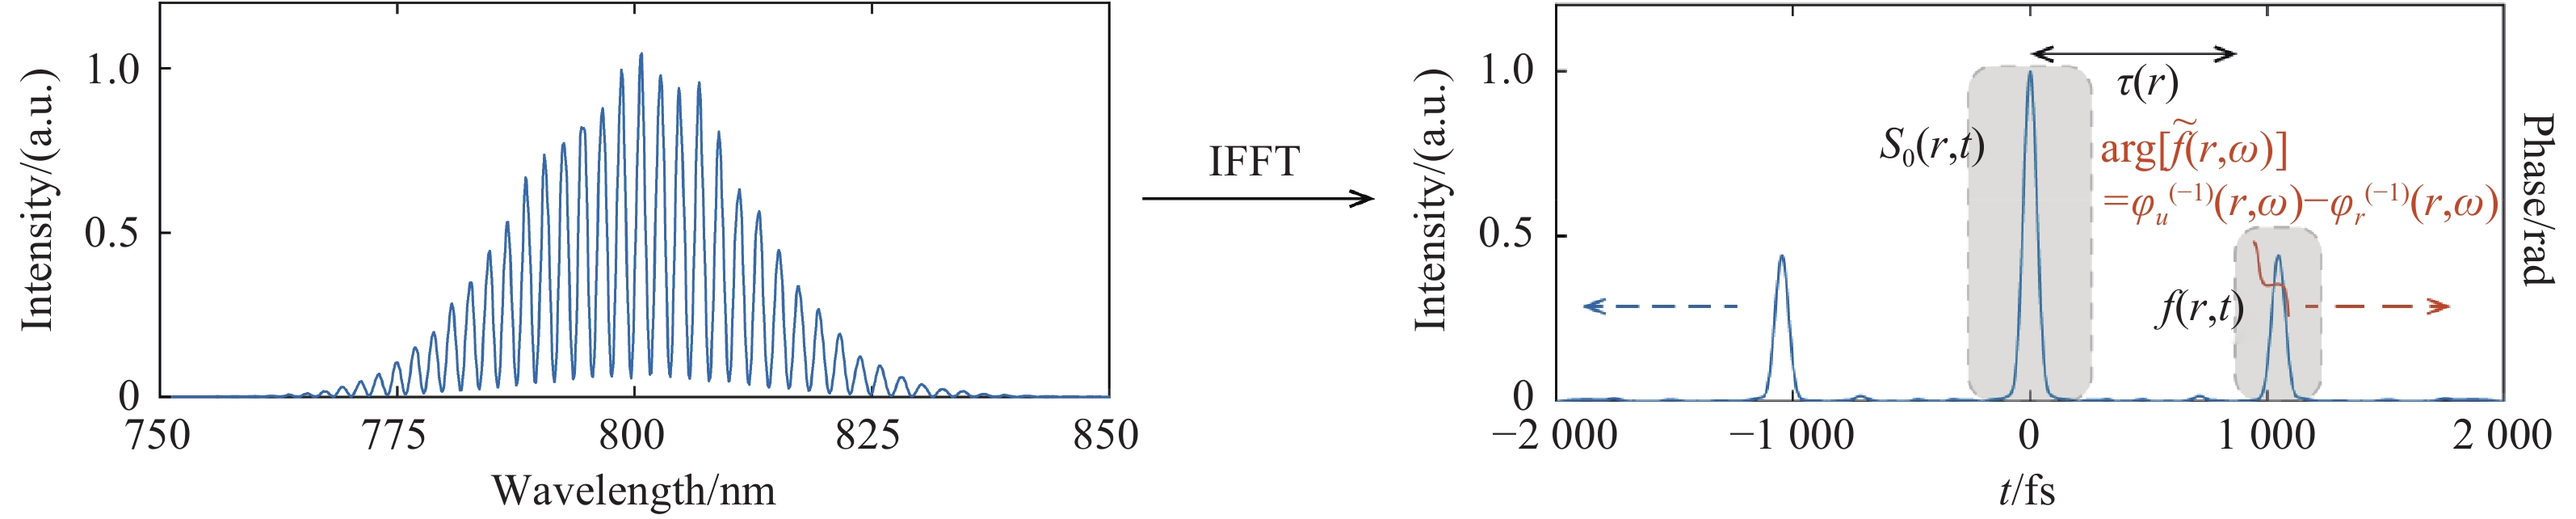
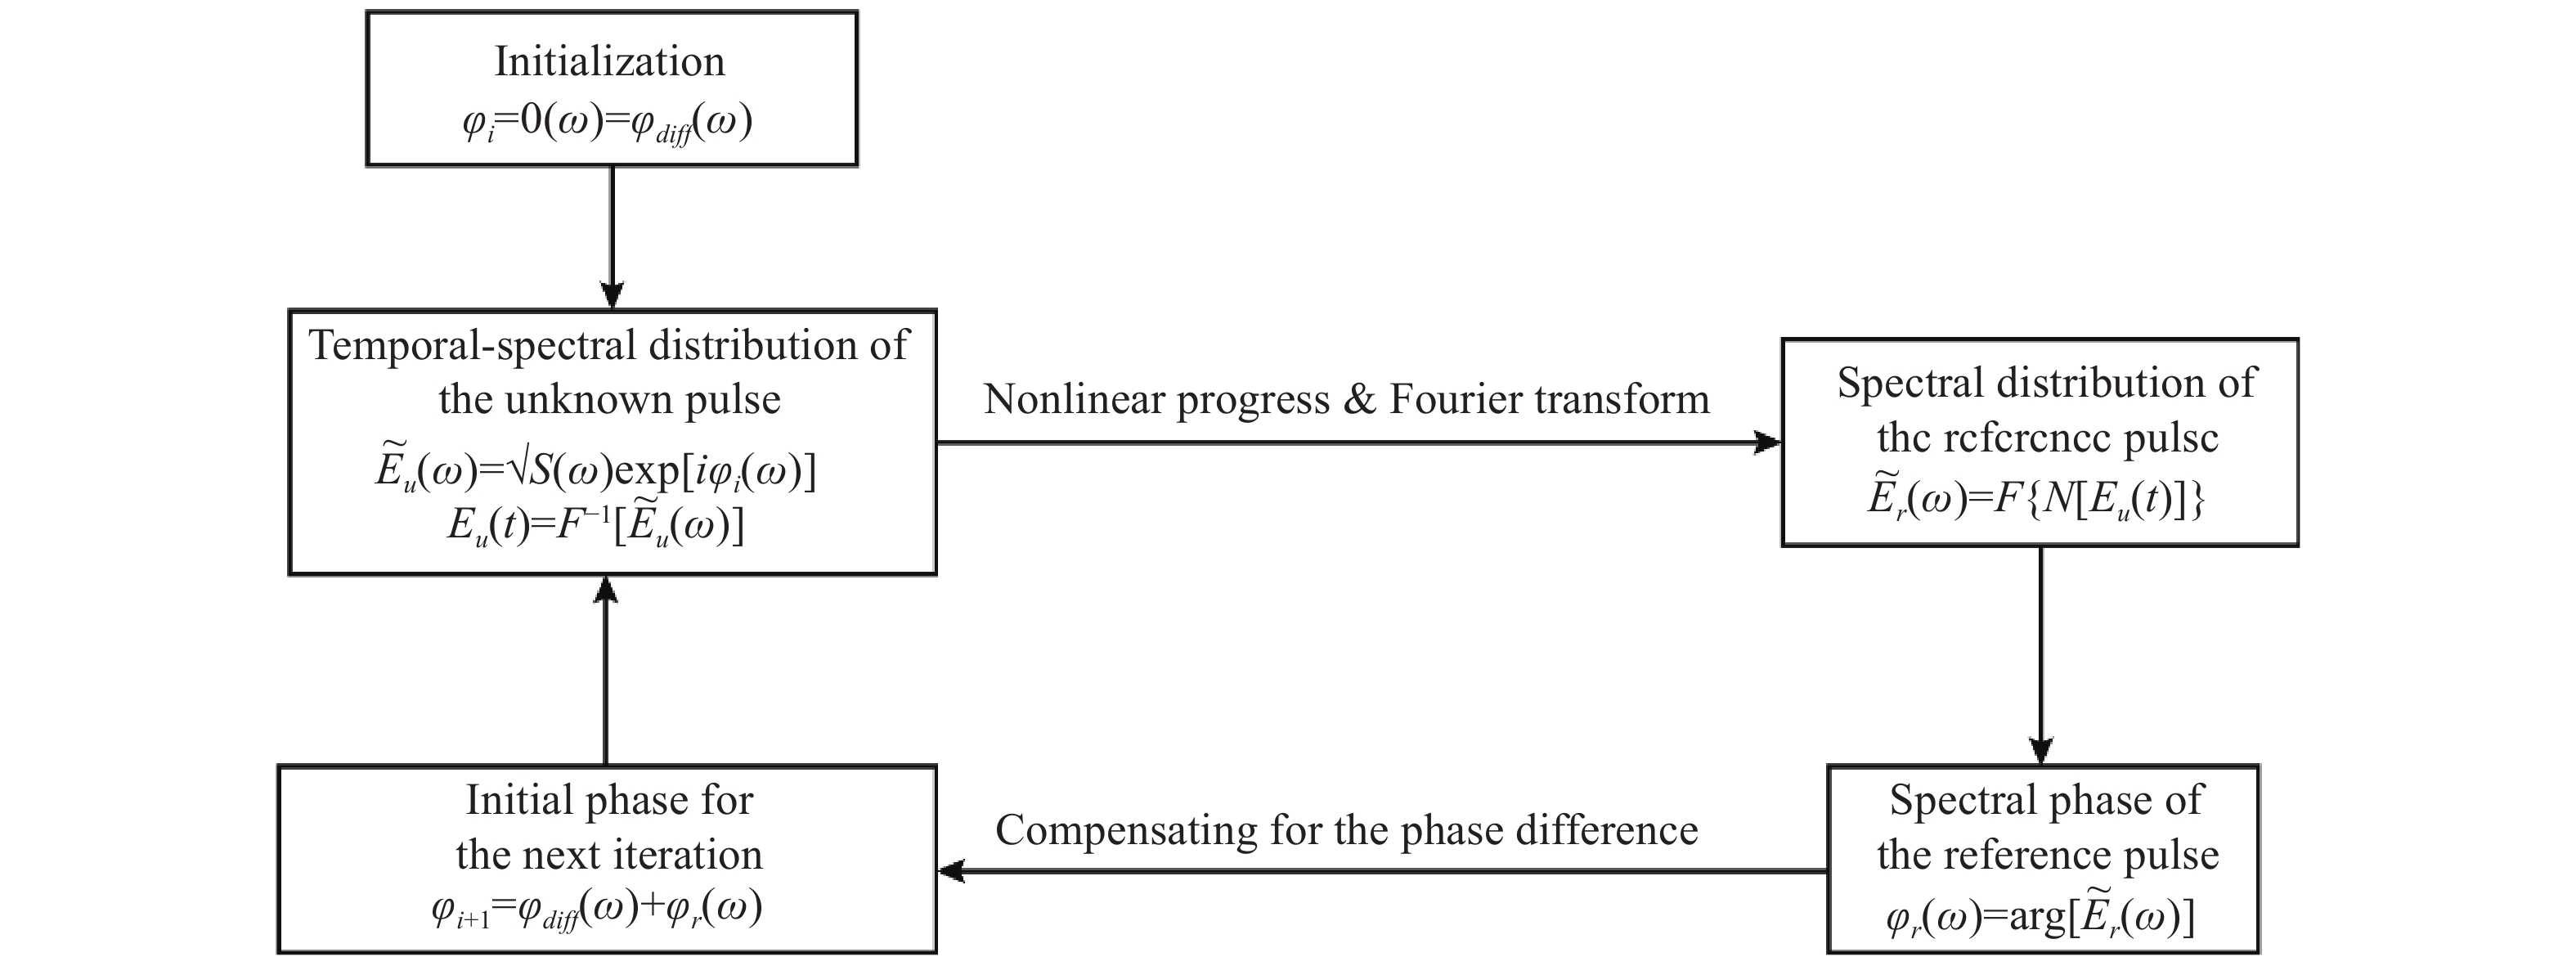
图 5 SRSI中的迭代相位检索算法流程图。该算法通过反复迭代更新待测脉冲的频谱相位,直至收敛至稳定解。初始化相位设为通过傅里叶变换光谱干涉法测得的相位差
$ {\varphi }_{\text{diff}}\left(\omega \right) $ ,随后在每次迭代中利用非线性过程(如交叉偏振波产生)从当前待测脉冲$ {E}_{u}\left(t\right) $ 构造参考脉冲$ {E}_{r}\left(t\right) $ ,并提取其频谱相位$ {\varphi }_{r}\left(\omega \right) $ 。更新后的相位$ {\varphi }_{i+1}\left(\omega \right) $ 为$ {\varphi }_{\text{diff}}\left(\omega \right)+{\varphi }_{r}\left(\omega \right) $ ,用于下一轮迭代。Figure 5. Flowchart of the iterative phase retrieval algorithm in SRSI. The algorithm iteratively updates the spectral phase of the unknown pulse until convergence. The initial phase is set to the phase difference
$ {\varphi }_{\text{diff}}\left(\omega \right) $ obtained from Fourier transform spectral interferometry. In each iteration, a reference pulse$ {E}_{r}\left(t\right) $ is generated from the current unknown pulse$ {E}_{u}\left(t\right) $ via a nonlinear process (e.g., cross-polarized wave generation), and its spectral phase$ {\varphi }_{r}\left(\omega \right) $ is extracted. The updated phase$ {\varphi }_{i+1}\left(\omega \right) $ is$ {\varphi }_{\text{diff}}\left(\omega \right)+{\varphi }_{r}\left(\omega \right) $ for the next iteration.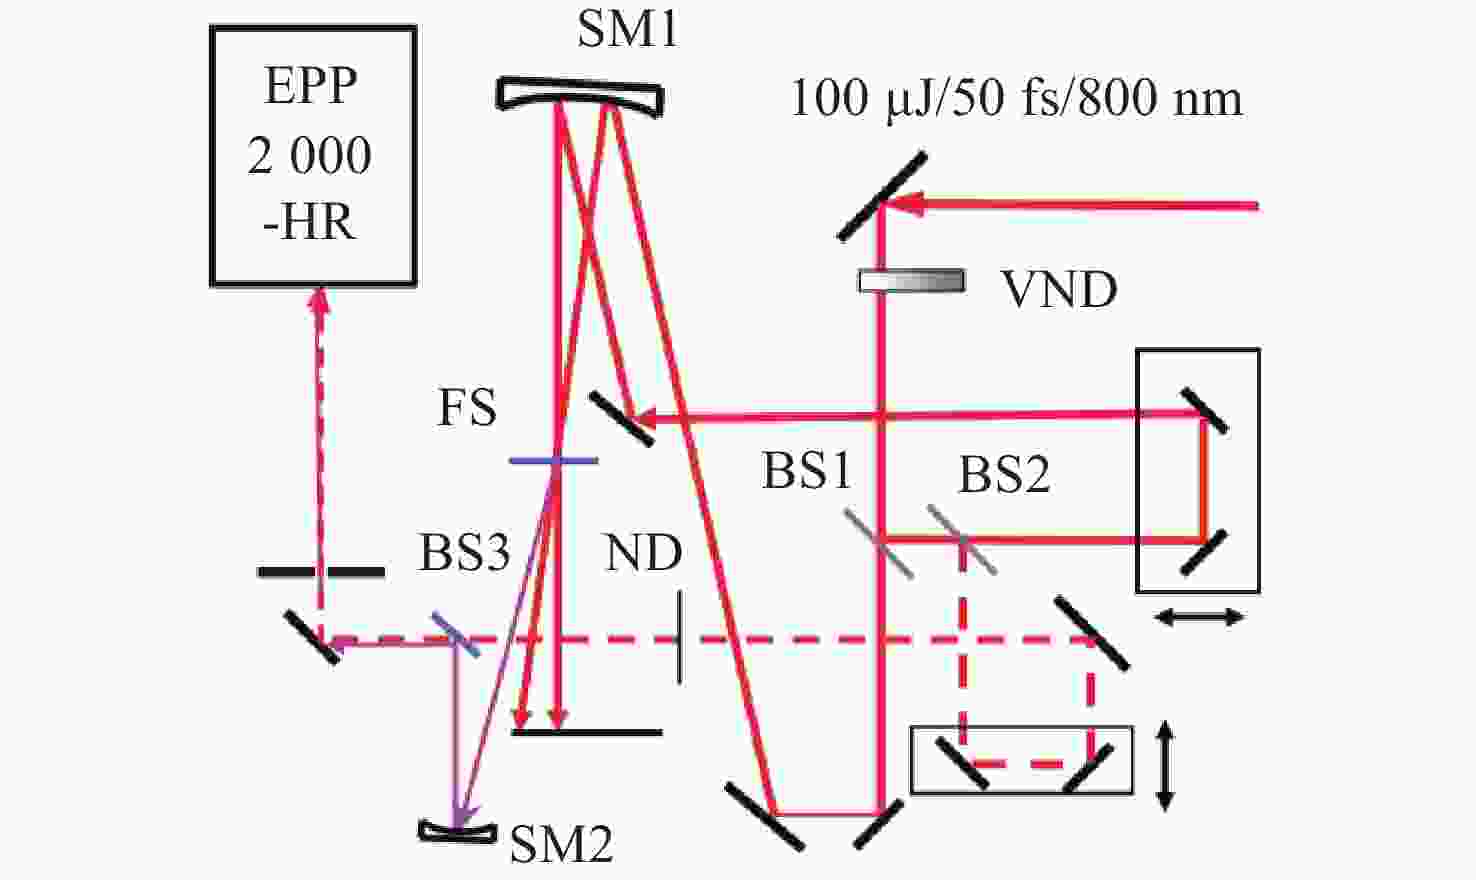
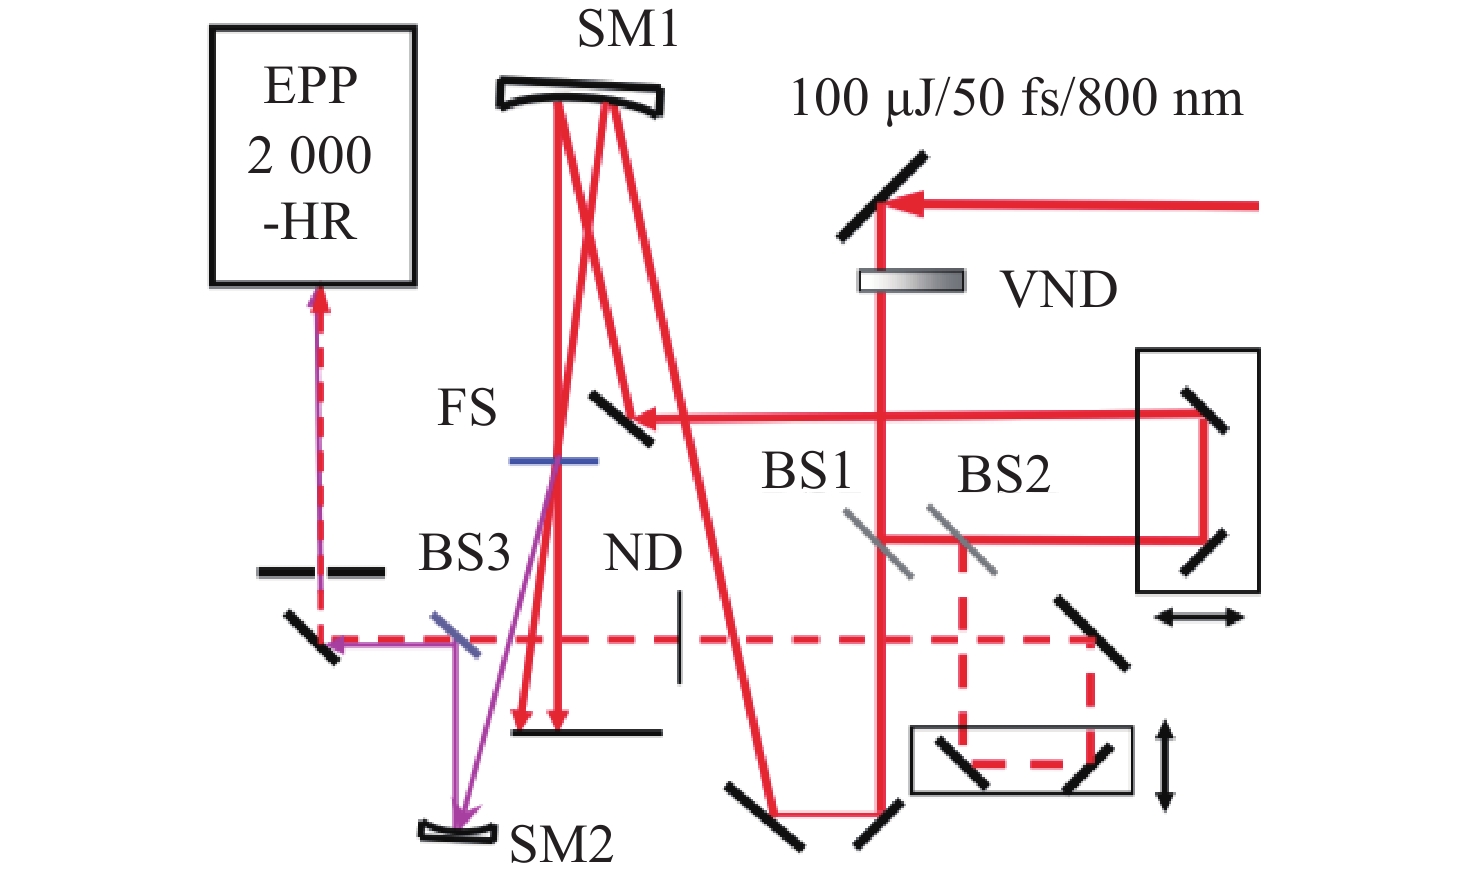
图 6 用于 800 nm 脉冲测量的SD-SRSI实验装置图。VND,可变中性密度滤光片;BS1、BS2、BS3,厚度为 1 mm 的50/50分束镜;SM1,曲率半径R=−700 mm的球面反射镜;FS,厚度为0.1 mm的熔融石英玻璃片;ND,中性密度滤光片;SM2,曲率半R=−
1000 mm的球面反射镜;EPP-2000-HR,高分辨率光谱仪(分辨率0.15 nm)[14]。Figure 6. Experimental setup of SD-SRSI for pulse at 800 nm. VND, variable-neutral density filter; BS1, BS2, BS3, 50/50 1 mm thick beam splitters; SM1, spherical mirror with a radius of curvature R = −700 mm; FS, 0.1 mm thick fused silica glass plate; ND, neutral density filter; SM2, spherical mirror with a radius of curvature R = −
1000 mm; EPP-2000-HR, high-resolution spectrometer (0.15 nm resolution)[14].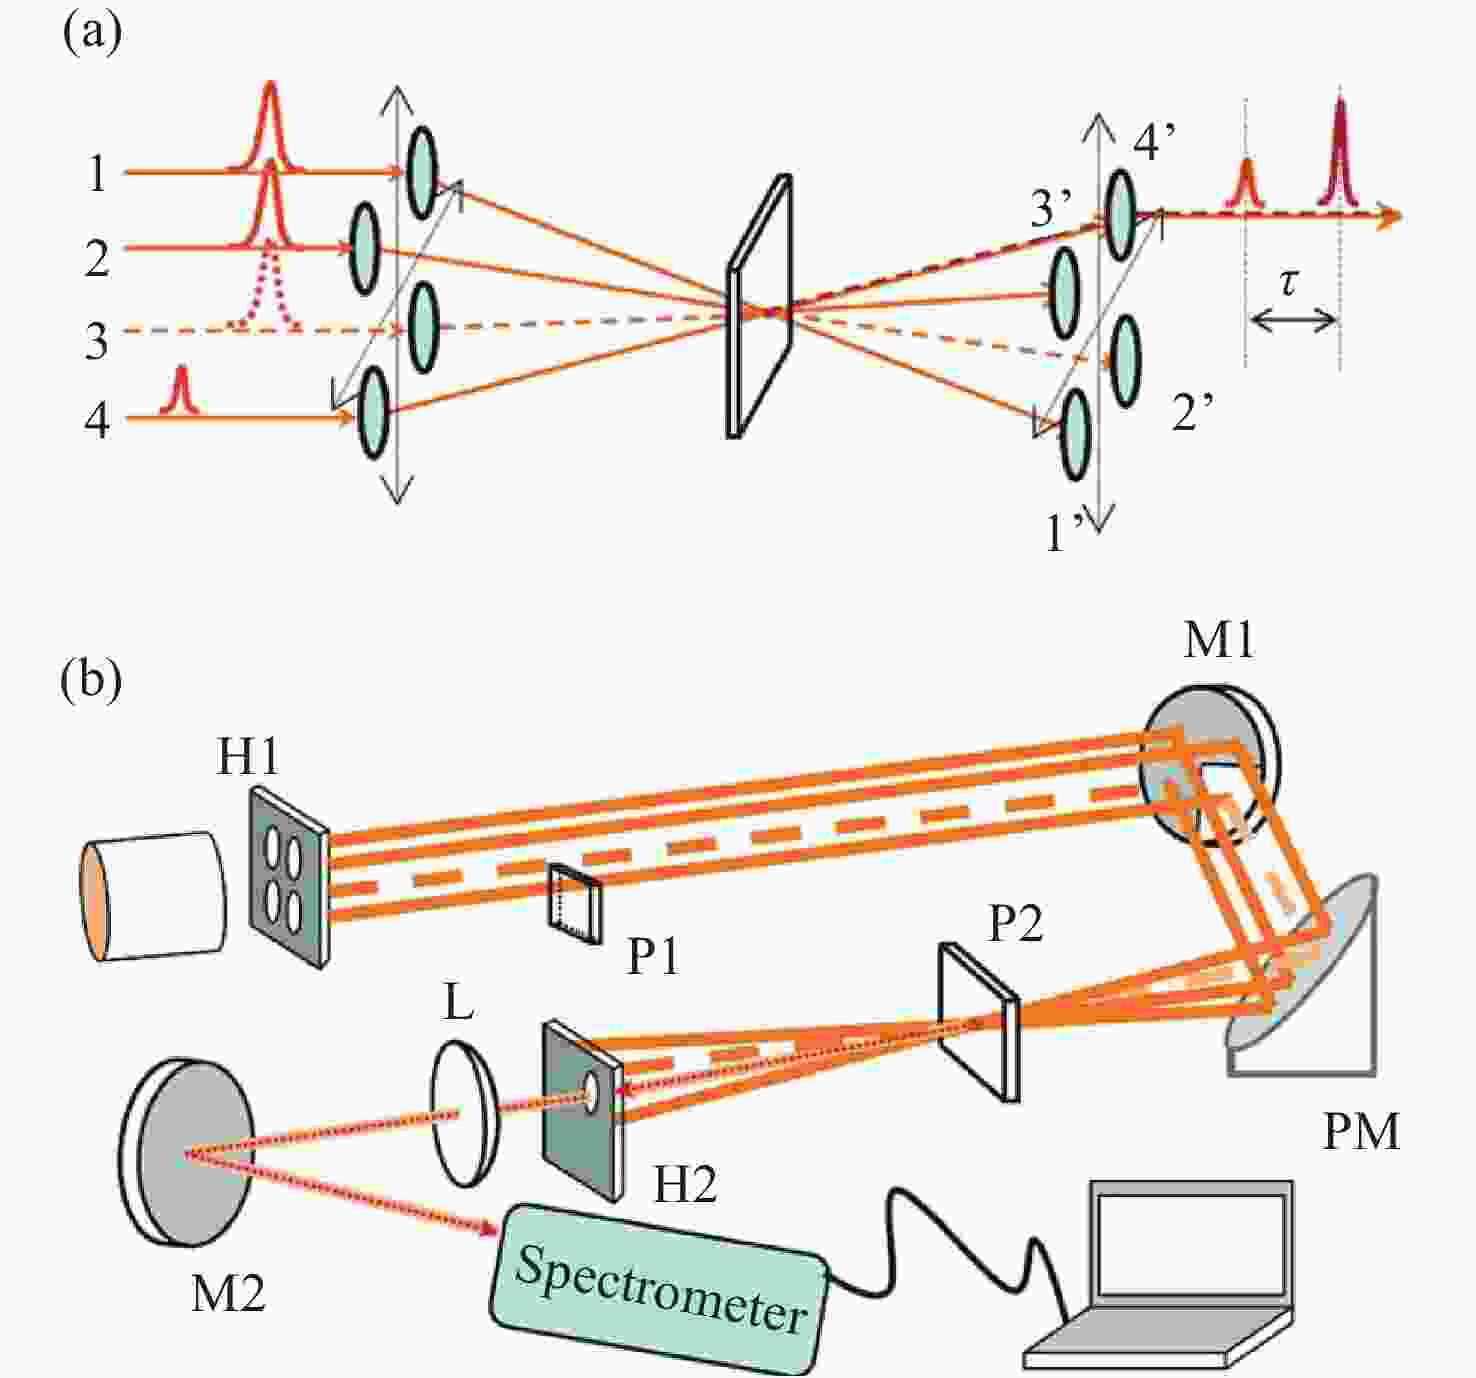
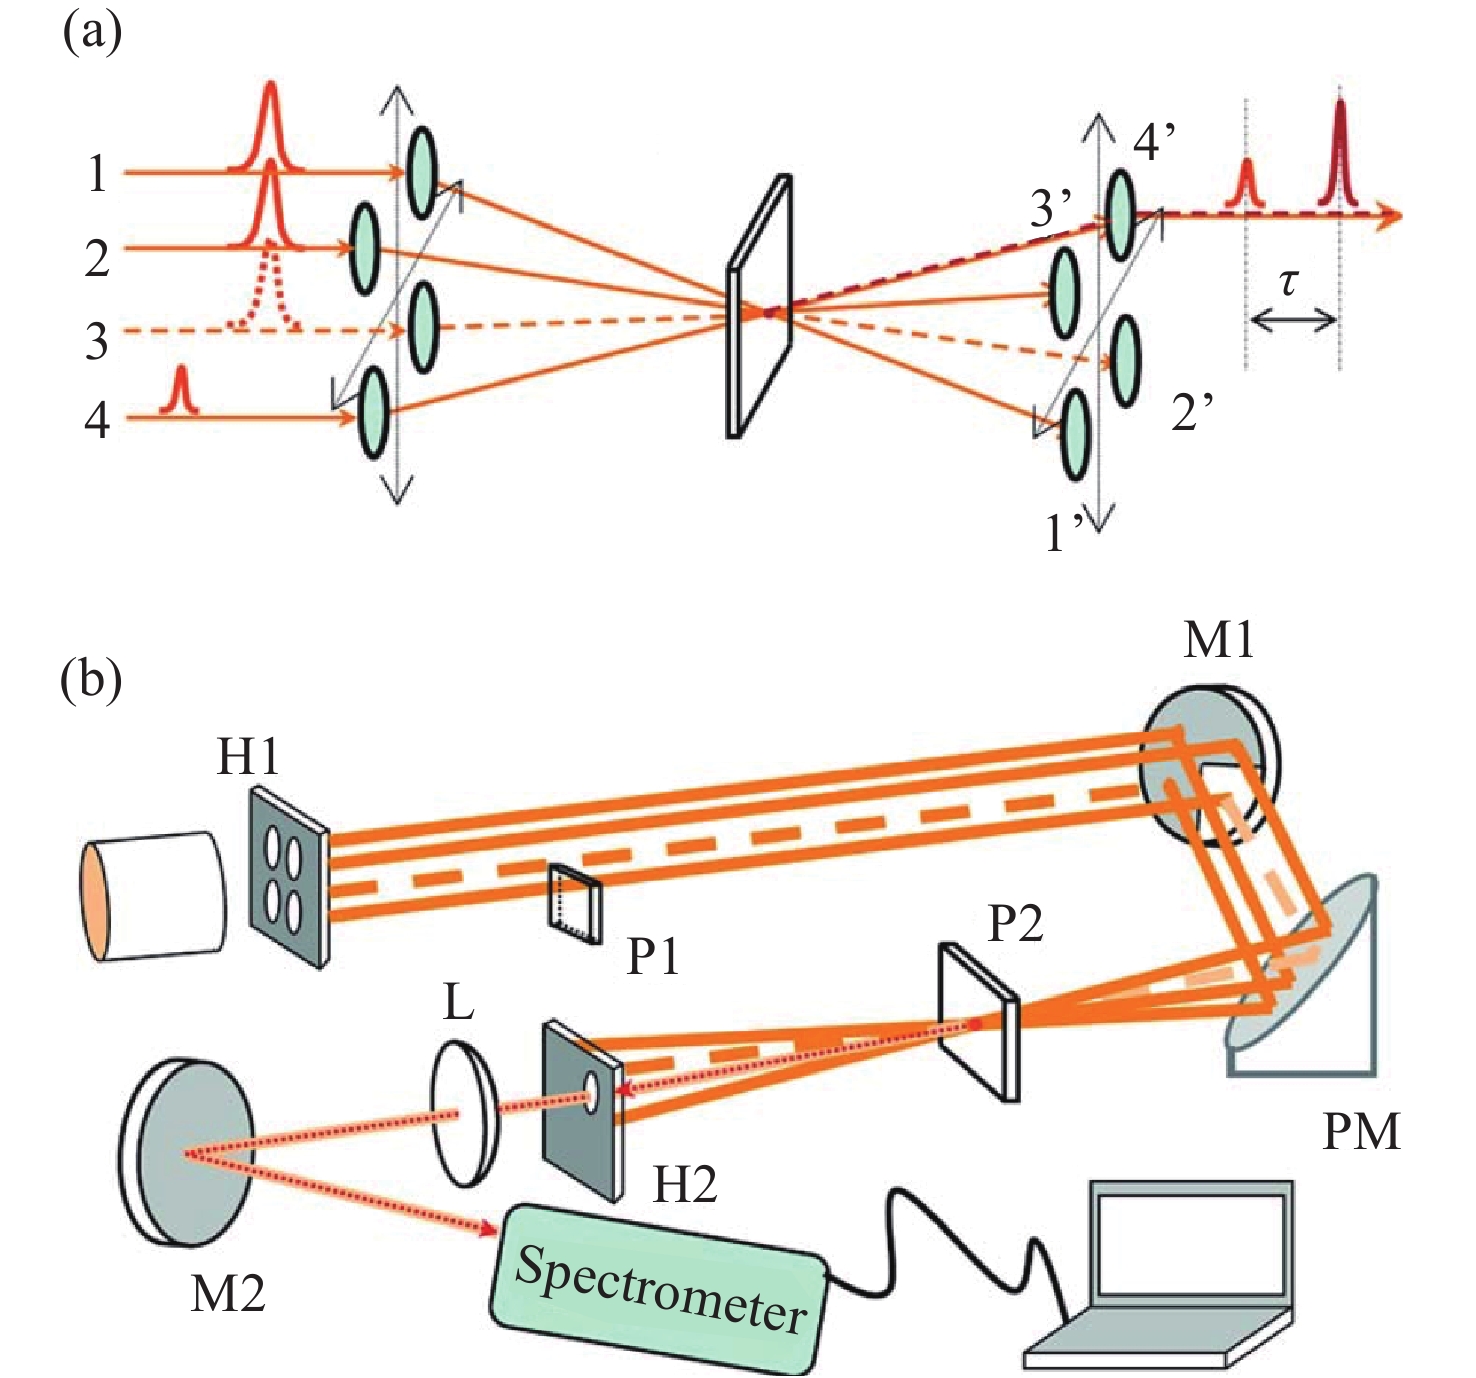
图 7 (a)瞬态光栅自参考光谱干涉法原理图。(b)实验装置图;H1,黑板;P1、P2,熔融石英片;M1,四分之三区域镀银的平面反射镜;PM,抛物面反射镜;H2,光阑;L,透镜;M2,平面反射镜[15]。
Figure 7. (a) Schematic of TG-SRSI. (b) Experimental setup; H1, black plate; P1, P2, fused silica plate; M1, plane mirror with three quarters parts silver-coated; PM, parabolic reflector; H2, iris; L, lens; M2, plane mirror[15].
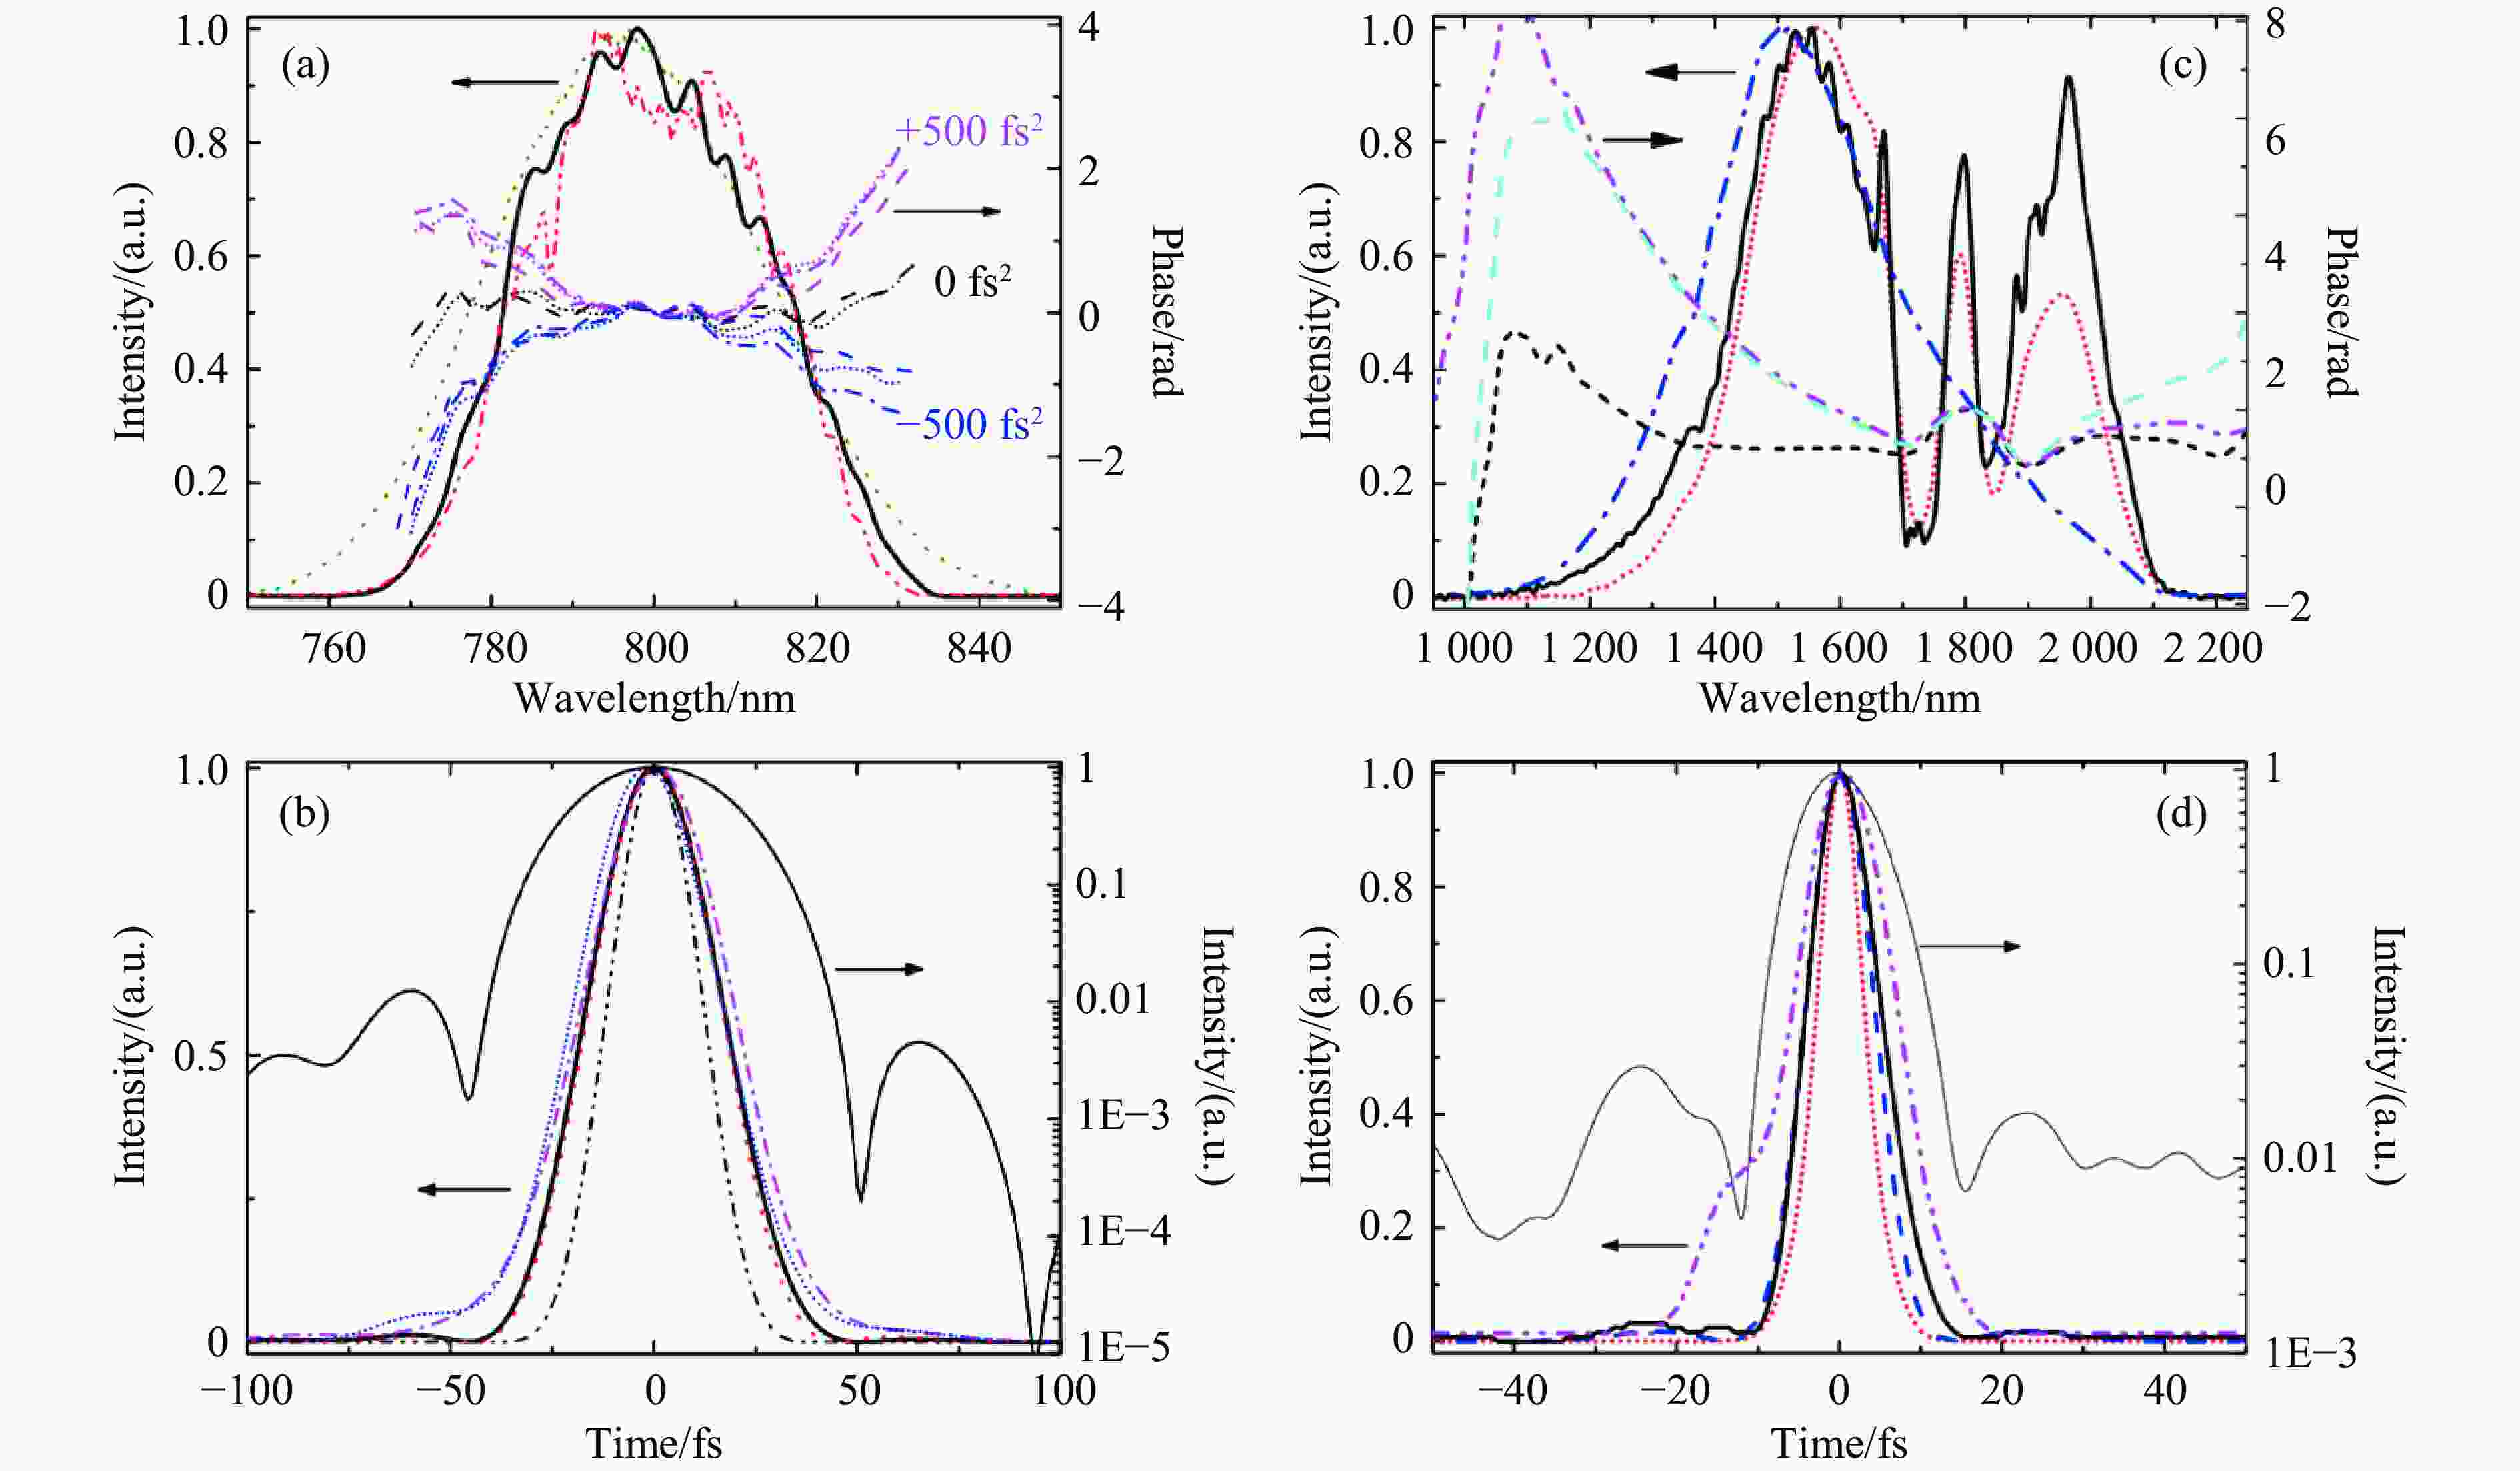
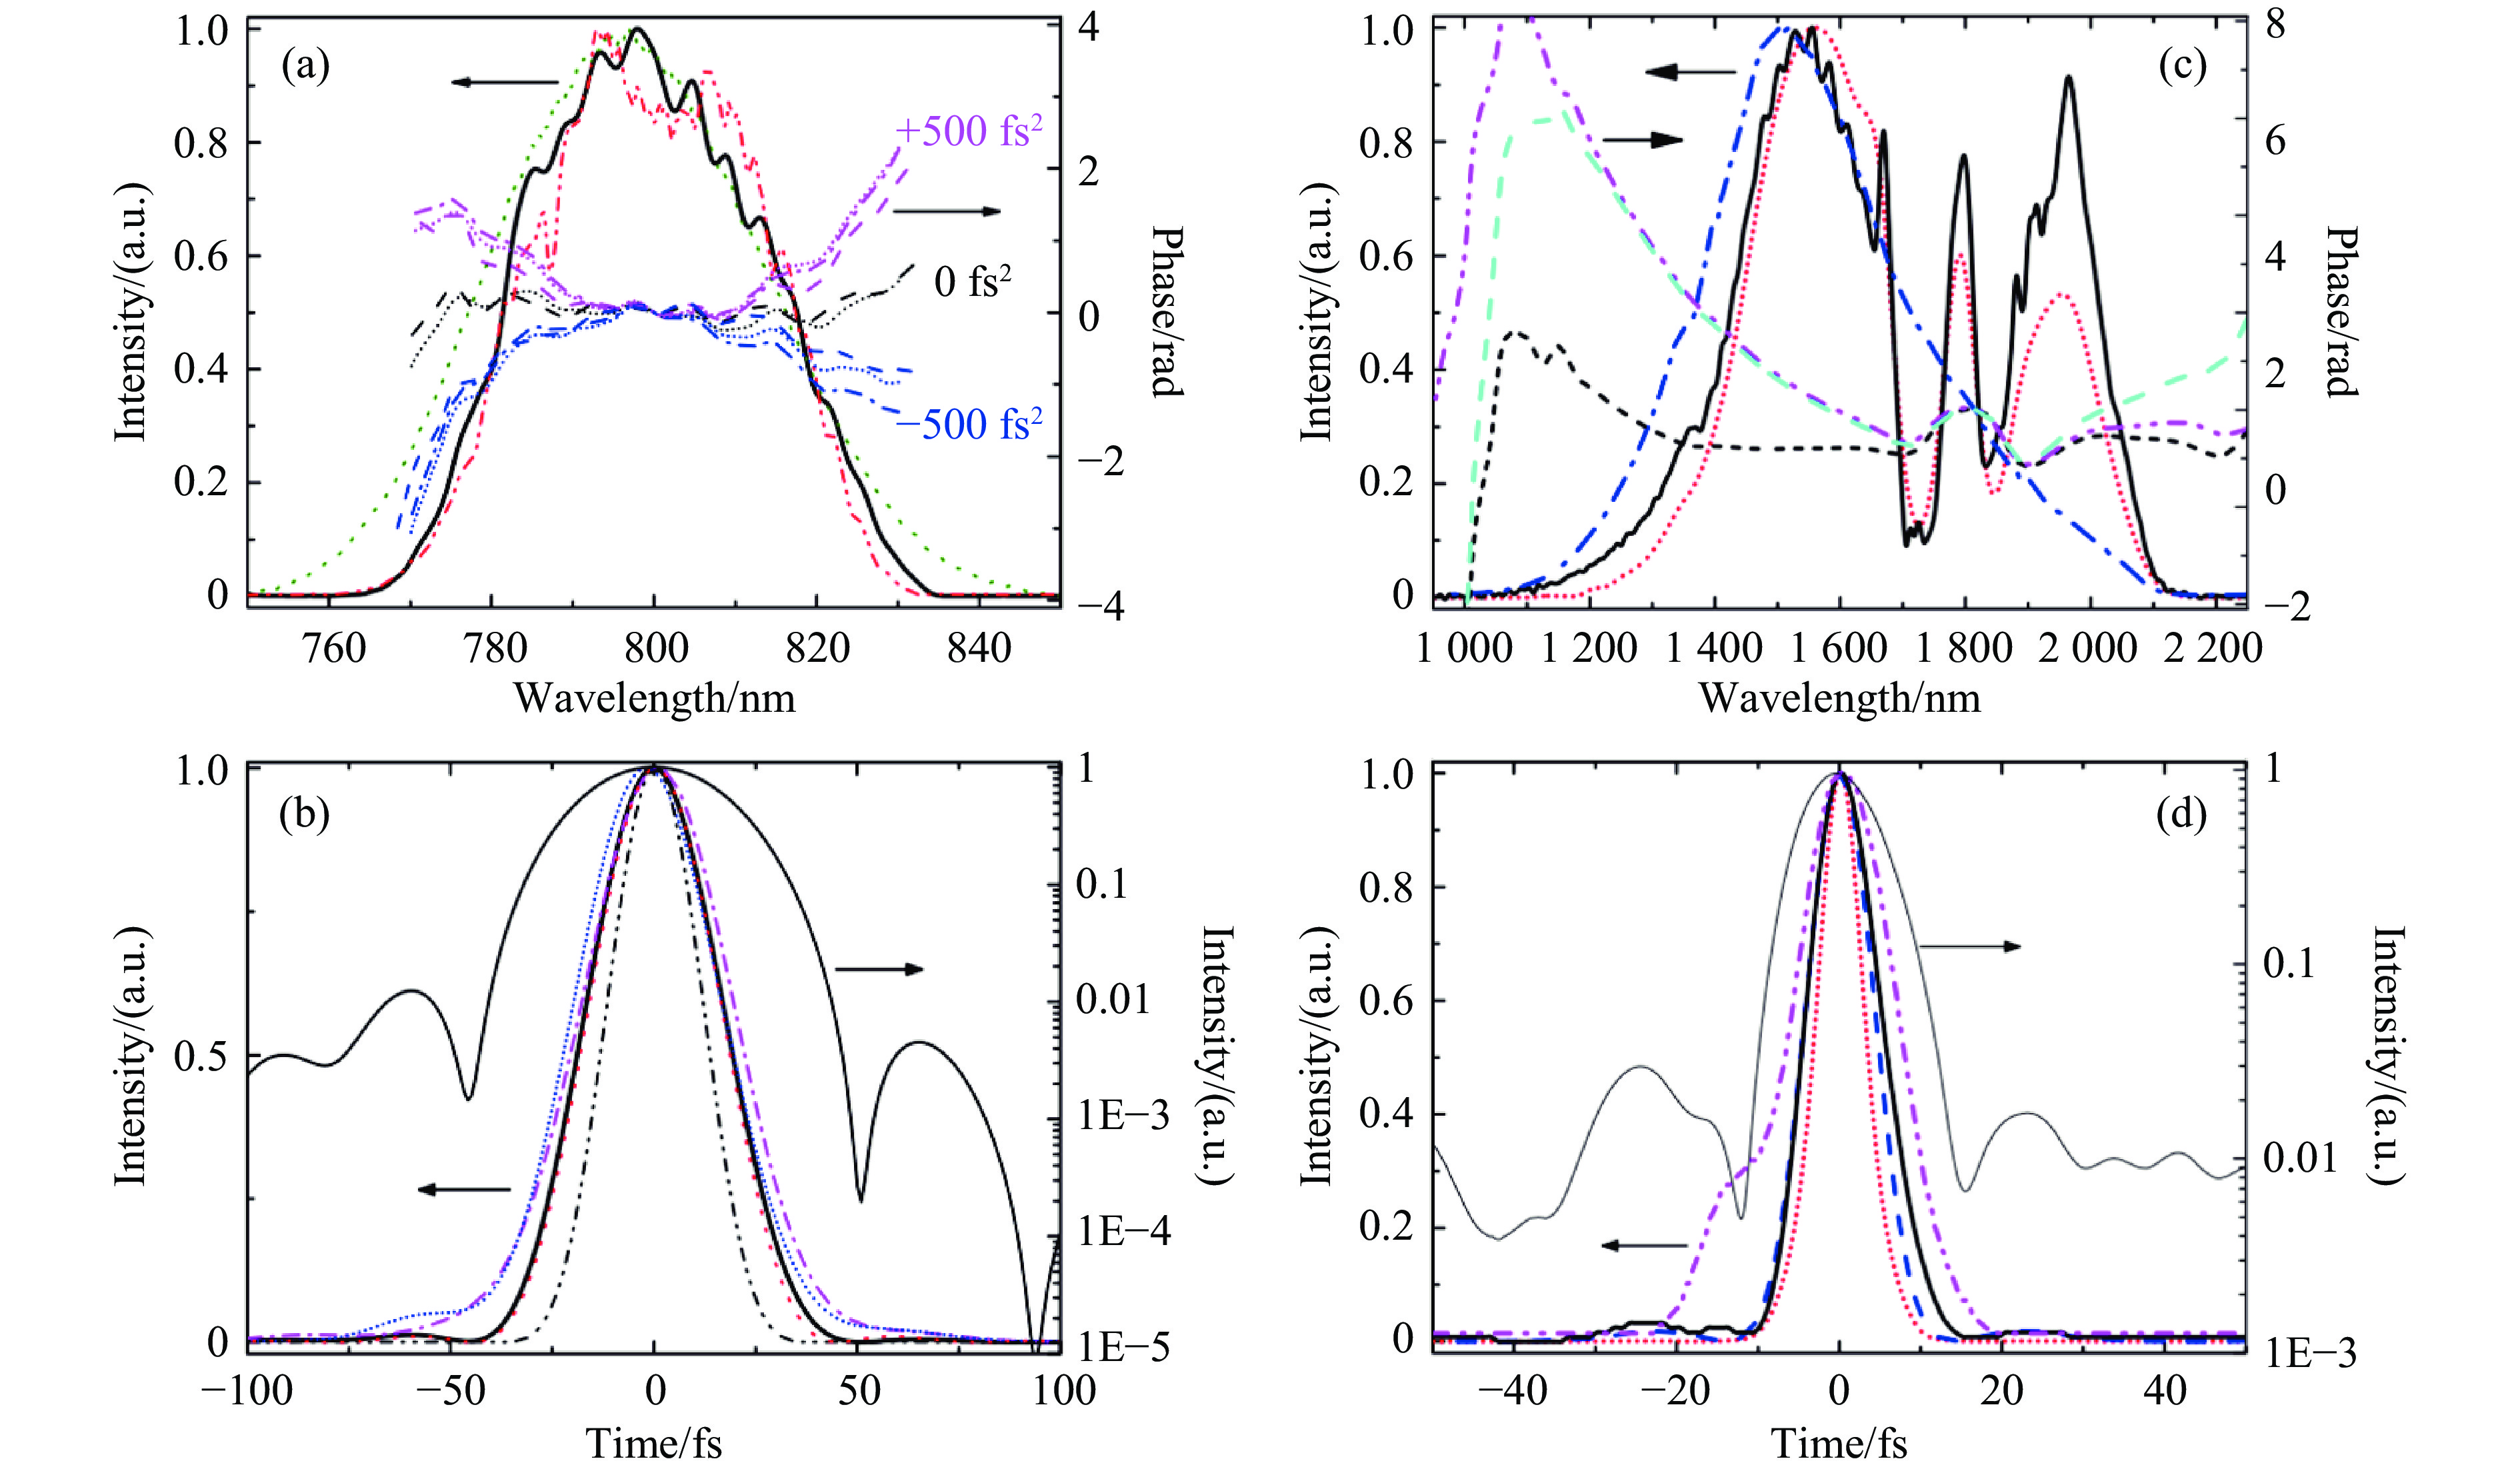
图 8 (a)当待测脉冲中分别引入0 fs2(居中,黑色)、+500 fs2(上方,品红色)和-500 fs2(下方,蓝色)的二阶色散时,测量得到的TG信号光谱(绿色点线)、待测脉冲光谱(红色点划线)、反演得到的待测脉冲光谱(黑色实线),以及由 TG-SRSI(短点线)、WIZZLER(虚线)和理论计算(点划线)得到的频谱相位。(b)三种不同条件下反演得到的待测脉冲时域波形:0 fs2(粗细黑色实线)、+500 fs2(品红色点划线)、-500 fs2(蓝色短点线)。红色点线和黑色点划线分别表示待测脉冲的傅里叶变换极限脉冲时域波形和TG信号的时域波形。(c)测量得到的TG信号光谱(蓝色点划线)、待测脉冲光谱(黑色实线)以及反演得到的待测脉冲光谱(红色短点线)。分别是有(黑色短虚线)和无(品红色双点划线)置于布儒斯特角位置的1 mm厚熔融石英片时,由TG-SRSI反演得到的频谱相位。青色虚线为无玻璃片时的理论计算频谱相位。(d) 有(粗细黑色实线)和无(品红色双点划线)1 mm厚玻璃片时反演得到的待测脉冲时域波形,其脉宽分别为10.6 fs和15.1 fs。蓝色虚线和红色短点线分别表示待测脉冲和TG信号的傅里叶变换极限脉冲时域波形,其脉宽分别为9.6 fs和6.8 fs[15]。
Figure 8. (a) Measured spectra of the TG signal (green dot) and the testing-pulse (red dash-dot-dot), the retrieved spectrum of the testing-pulse (solid black), the spectral phase obtained by TG-SRSI (short-dot), WIZZLER (dash) and the calculation (dash-dot) when introduced at 0 fs2 (center and black), +500 fs2 (up and magenta), -500 fs2 (down and blue) in the testing-pulse, respectively. (b) Retrieved temporal profile of the testing-pulse at 0 fs2 (thick and thin black solid), +500 fs2 (magenta dash-dot), -500 fs2 (blue short-dot); three different conditions. The red dot and the black dash-dot-dot lines are the FTL temporal profile of the testing-pulse and the TG signal, respectively. (c) Measured spectra of the TG signal (blue dash-dot), the testing-pulse (black solid), and the retrieved spectrum of testing-pulse (red short-dot). Retrieved spectral phase by TG-SRSI with (black short-dash) and without (magenta dash-dot-dot) the Brewster-angle located 1 mm thick fused silica plate. Cyan dashed line is the calculated spectral phase without the glass plate. (d) Retrieved temporal profile of the testing-pulse with (thick and thin black solid) and without (magenta dash-dot-dot) the 1 mm thick glass plate, which are 10.6 and 15.1 fs, respectively. Blue dashed and red short-dot lines are the FTL temporal profile of the testing-pulse and the TG signal, which are 9.6 and 6.8 fs, respectively[15].
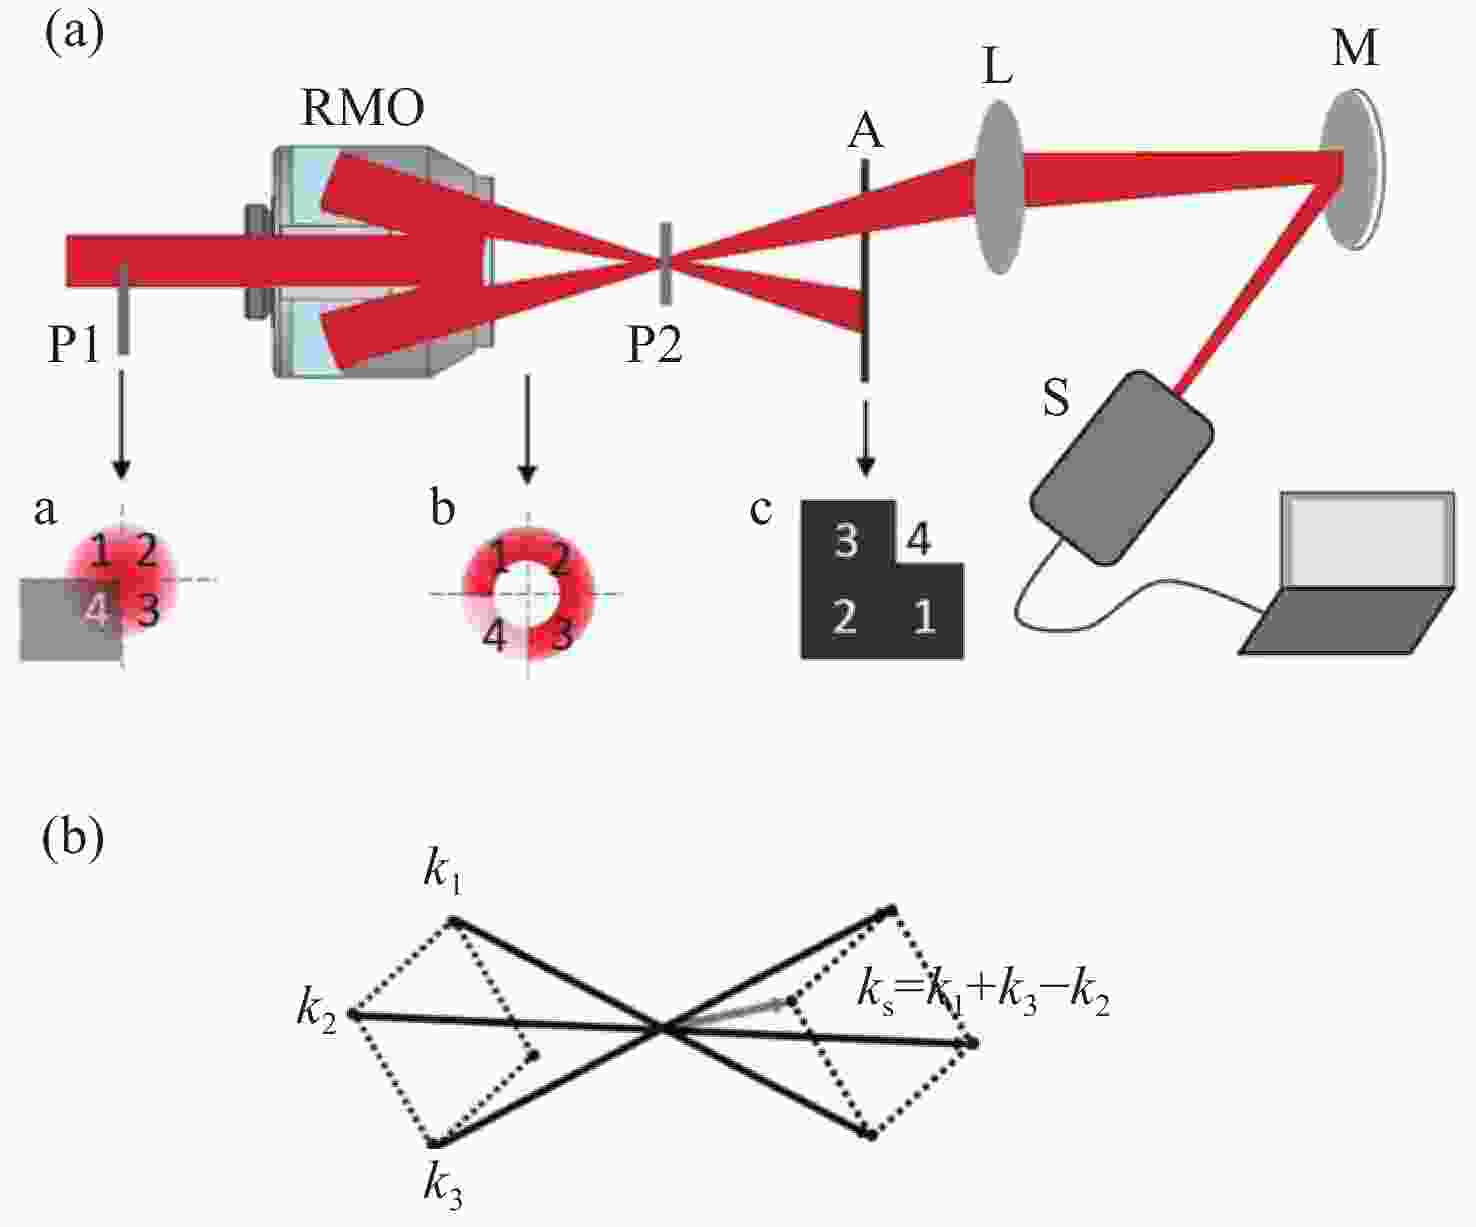
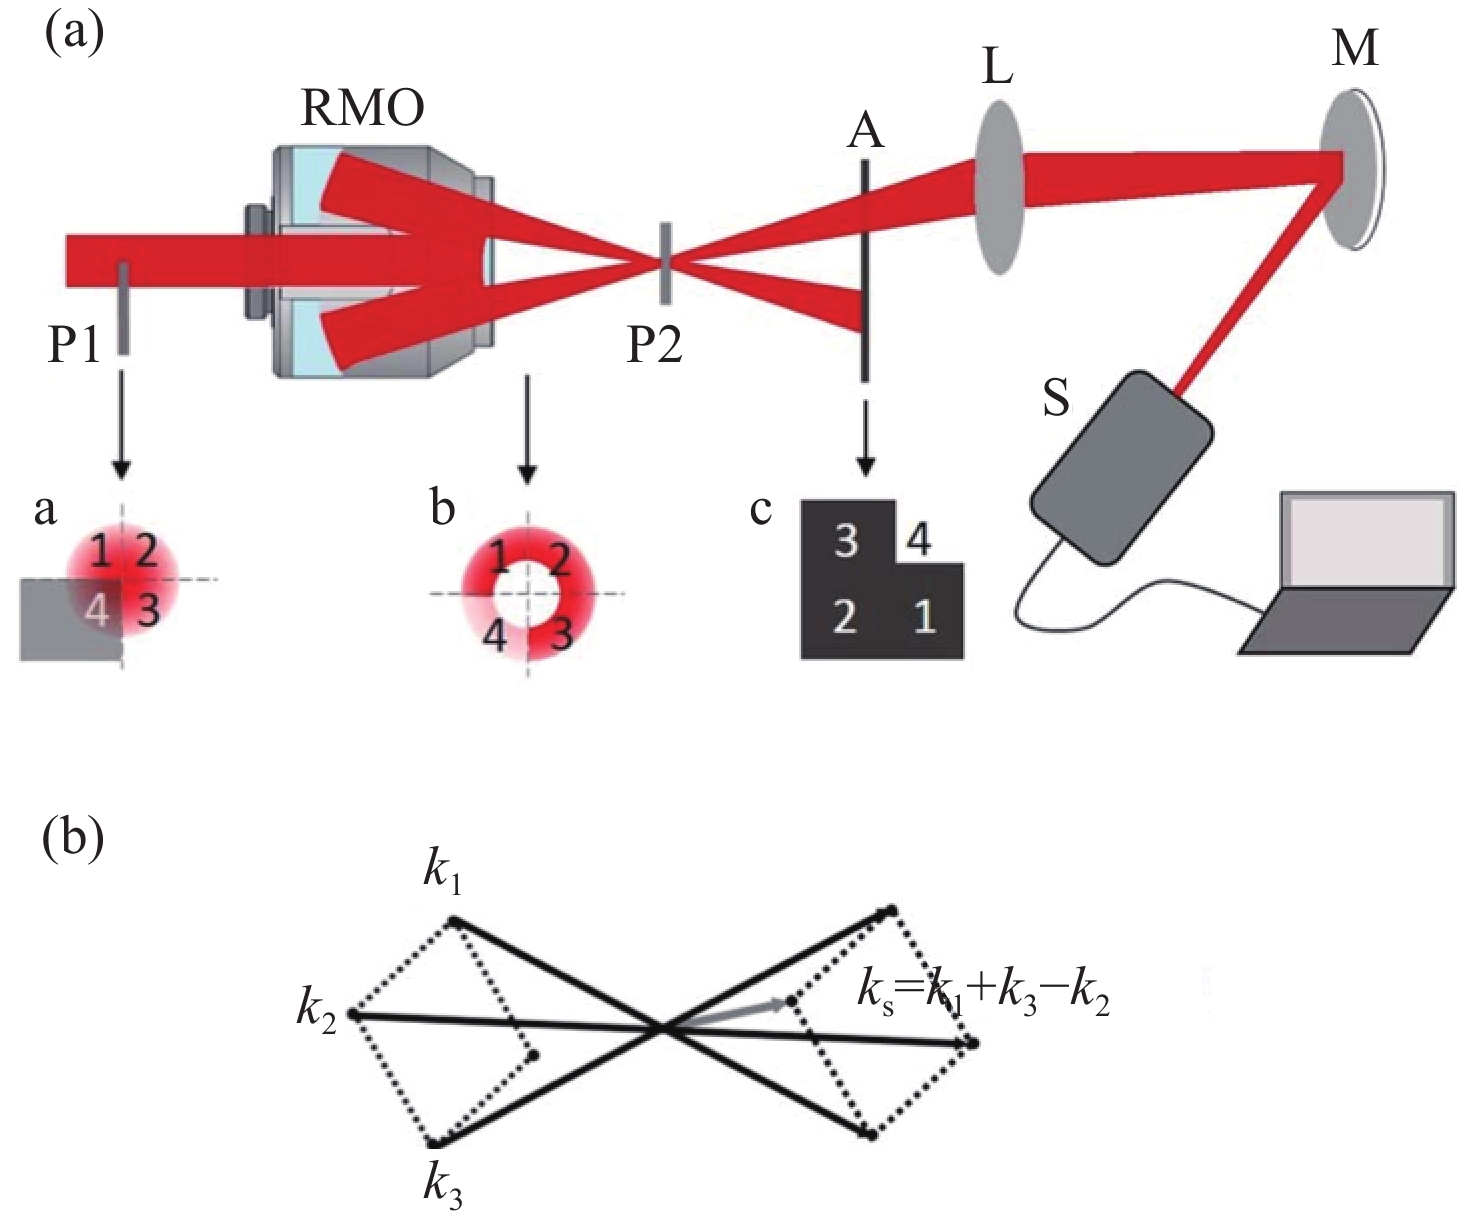
图 9 (a)基于反射式显微物镜的瞬态光栅自参考光谱干涉法光路图。P1,镀铝熔融石英片;P2,非线性材料;A,黑色挡板;L,透镜;M,平面反射镜;S,光谱仪;a和b为箭头所指部分的截面图,c为黑板。所有图示均为从右侧观察的视图。(b)BOX-CARS 相位匹配几何示意图[22]。
Figure 9. (a) The optical setup of the RMO based TG-SRSI. P1, aluminum-coated, fused silica plate; P2, nonlinear material; A, black plate; L, lens; M, reflective plane mirror; S, spectrometer; a and b are cross sections of the portions indicated by the arrows and c is the black plate. All are seen from the right side. (b) BOX-CARS phase-matching geometry[22].
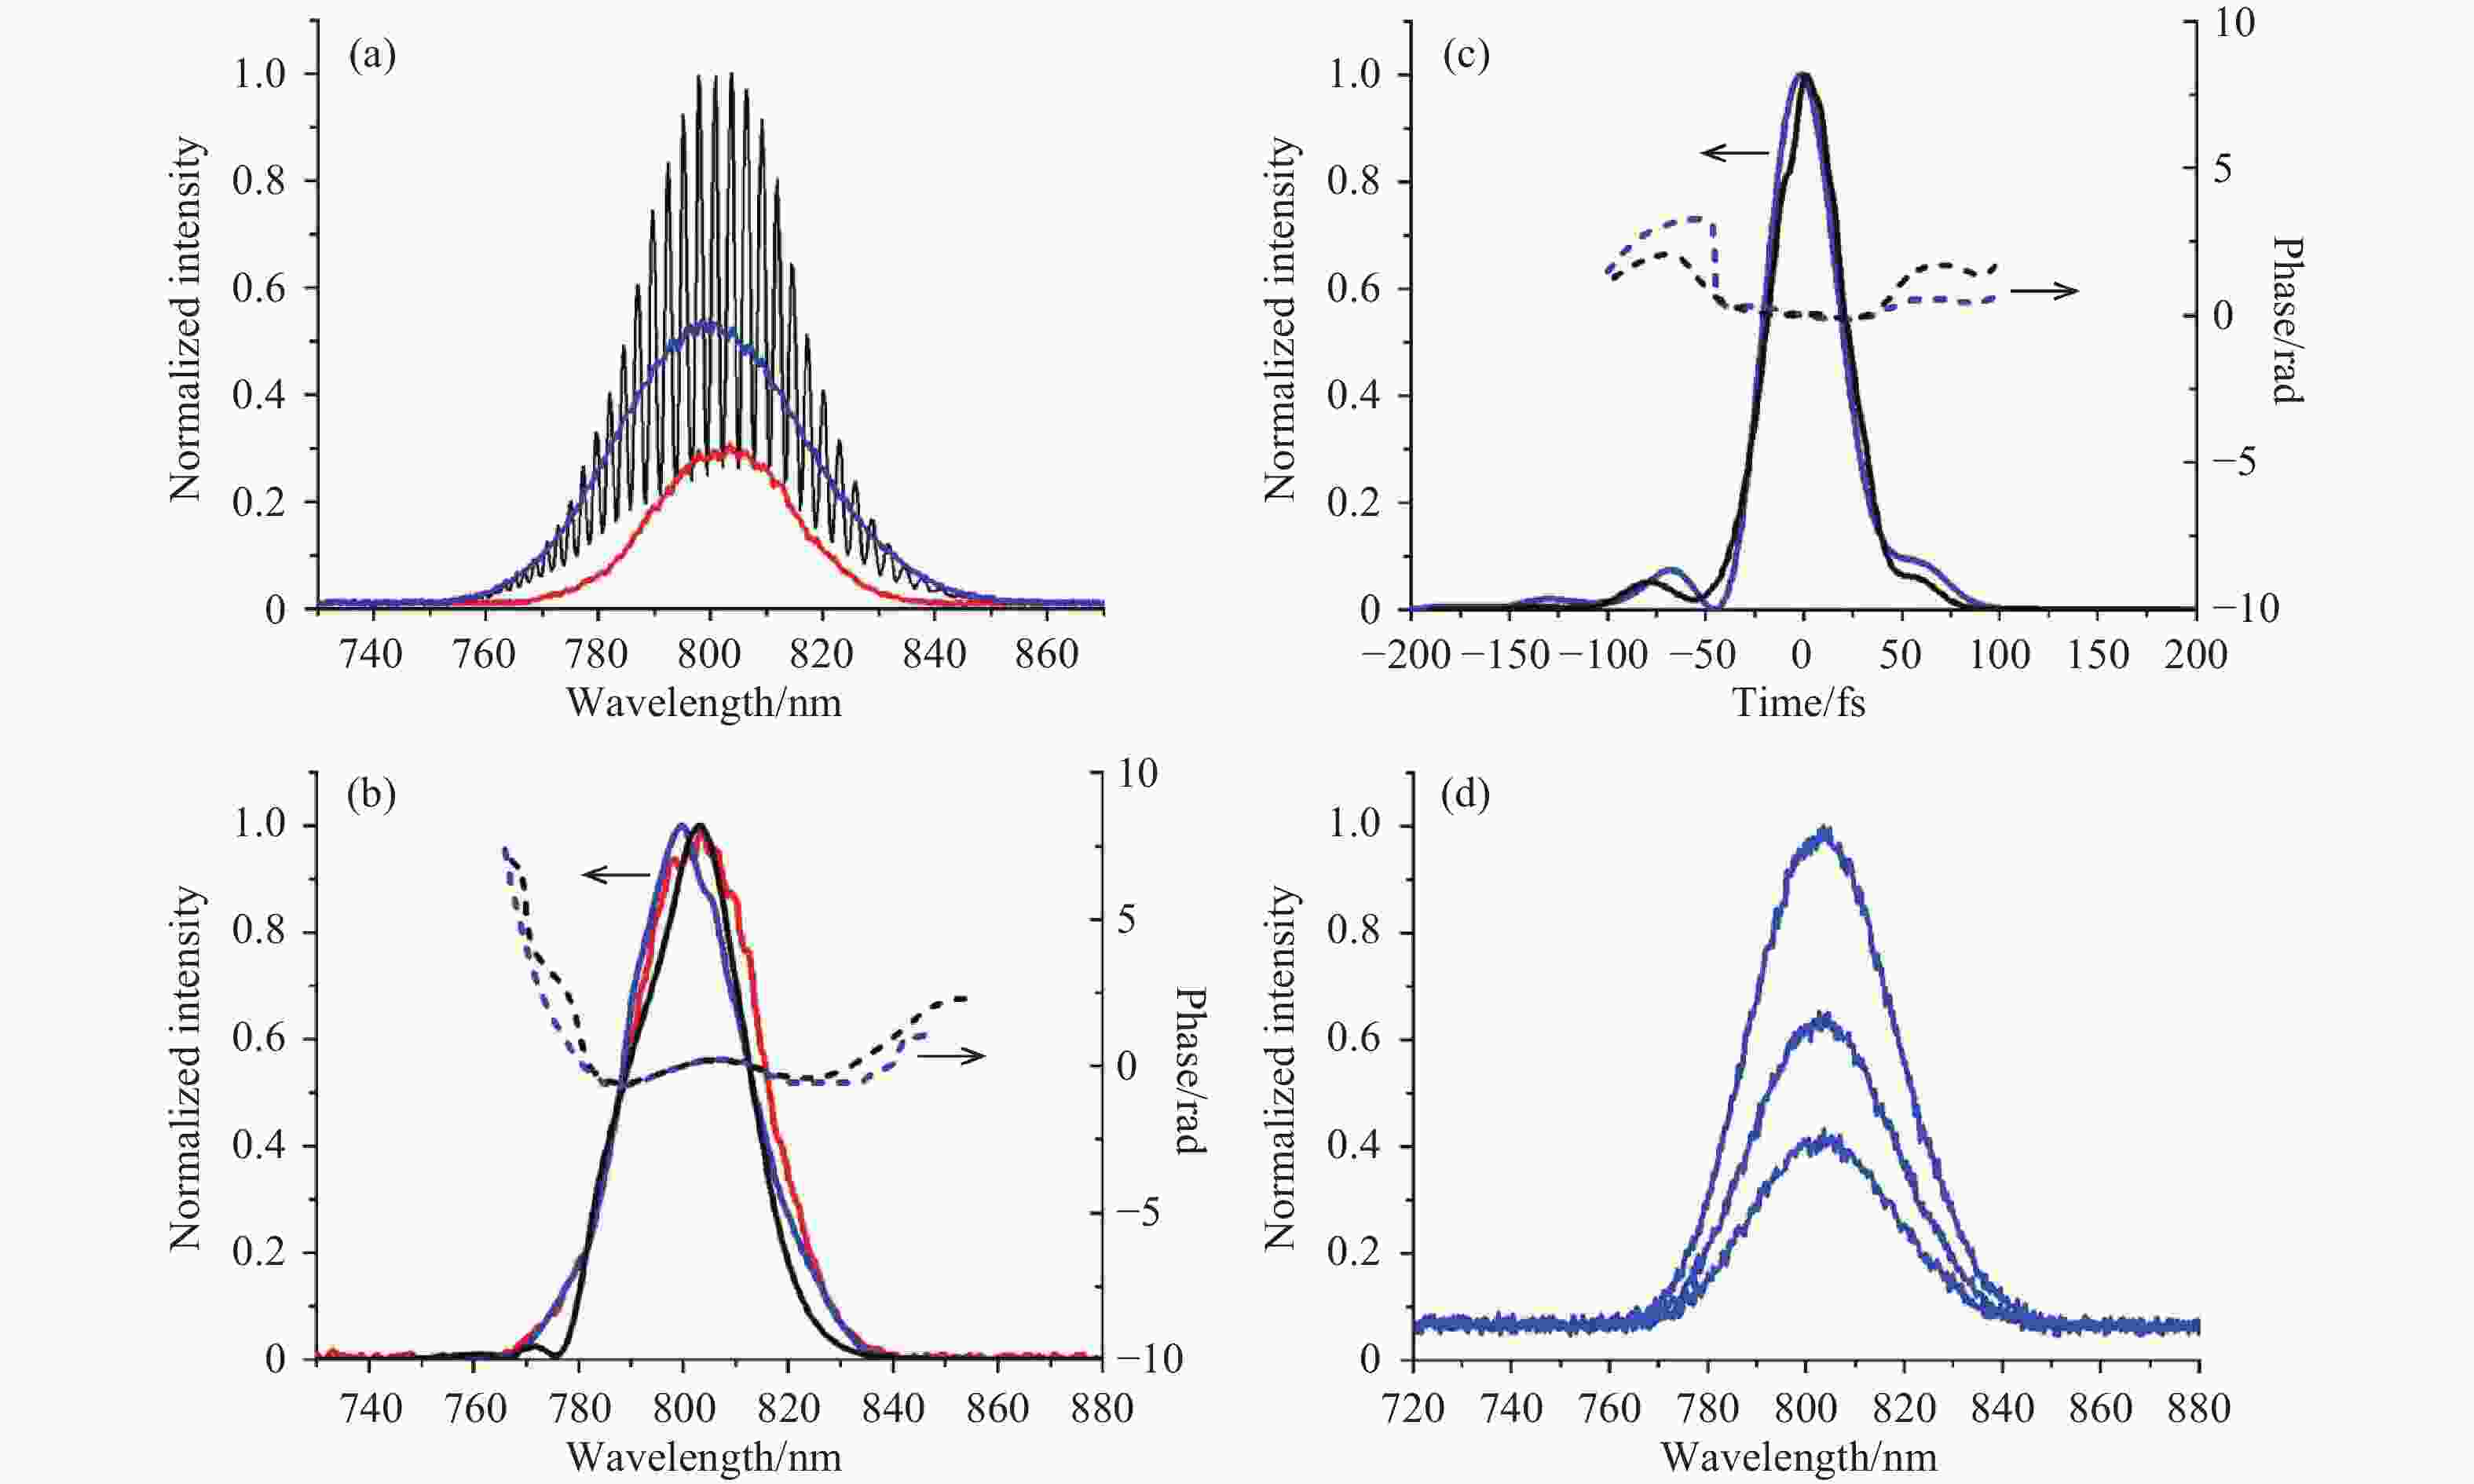
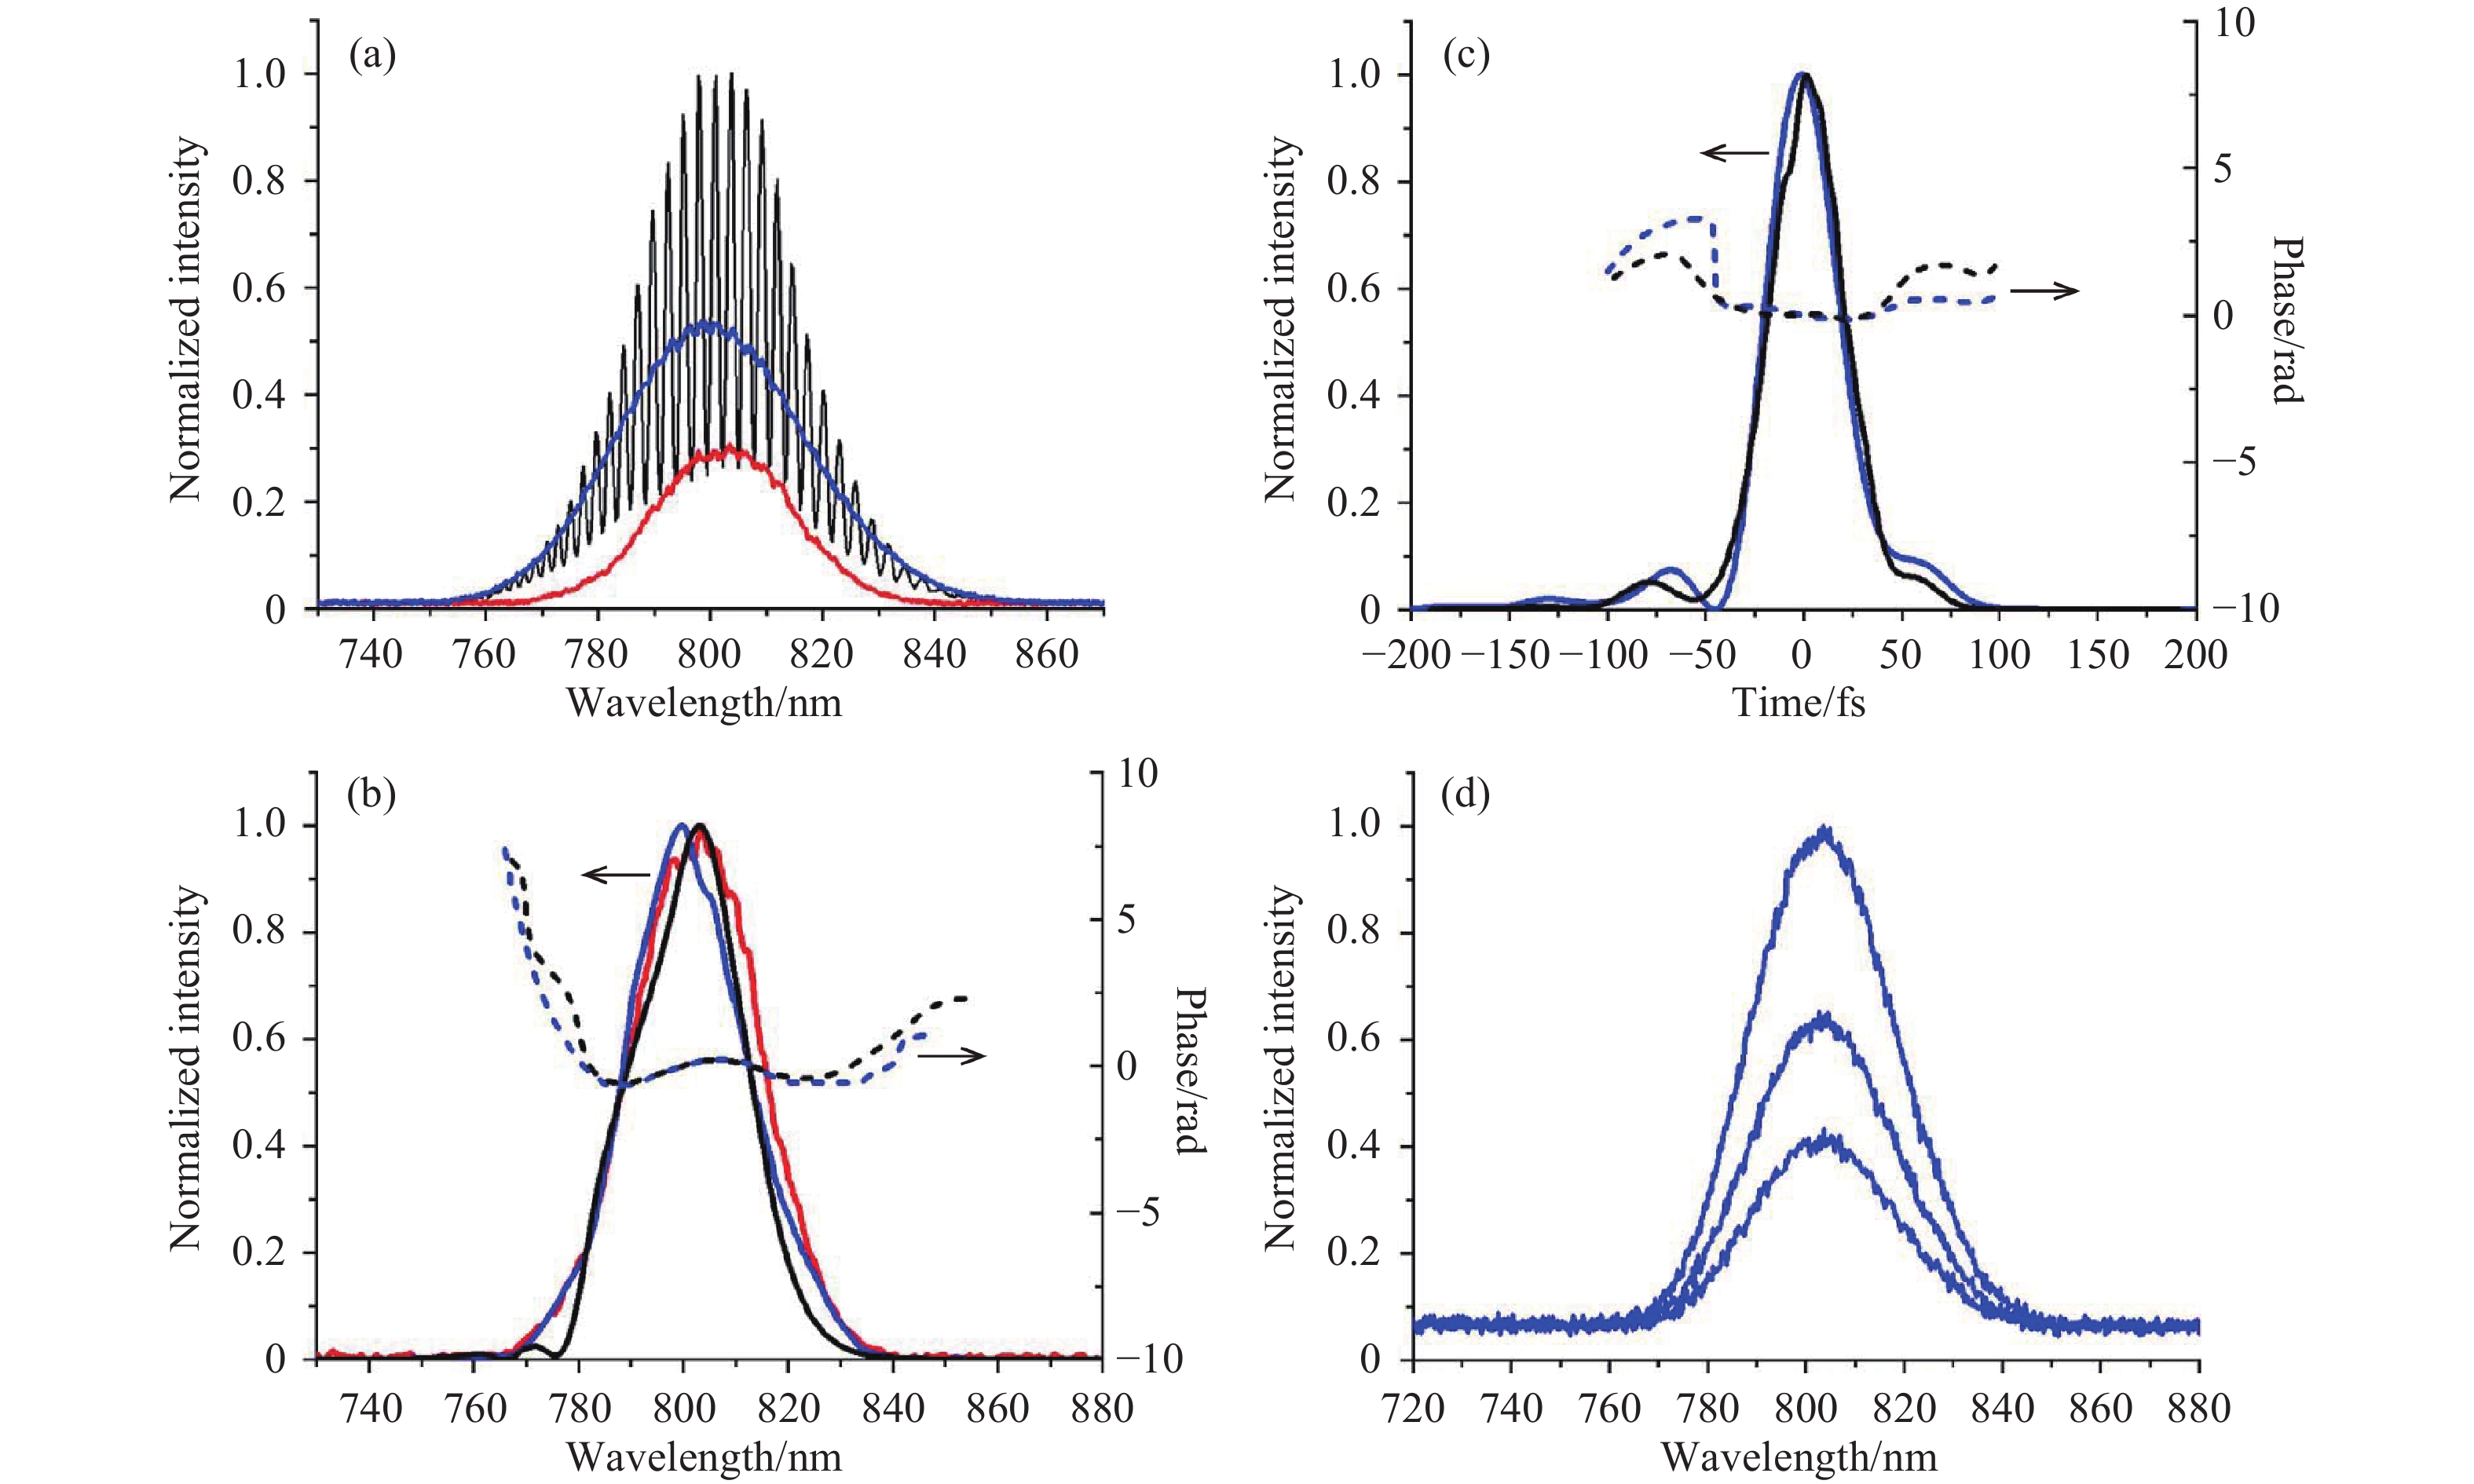
图 10 (a)由光谱仪直接测量得到的测试光束(红色曲线)、TG信号(蓝色曲线)及其干涉图(黑色曲线)的光谱强度。(b)使用TG-SRSI反演得到的光谱(黑色实线)和频谱相位(黑色点线)。使用SHG-FROG反演得到的光谱(蓝色实线)和频谱相位(蓝色点线)。红色曲线为光谱仪直接测得的测试光束光谱。(c)使用TG-SRSI(黑色曲线)和SHG-FROG(蓝色曲线)反演得到的时域波形(实线)和相位(虚线)。(d)光谱仪直接测得的三个TG信号光谱。自下而上的光谱分别对应输入脉冲能量为65 nJ、75 nJ 和85 nJ时的情况[22]。
Figure 10. (a) Spectral intensity of the test beam (red curve), the TG signal (blue curve), and the interference between them (black curve) measured directly with the spectrometer. (b) The spectrum retrieved (black solid curve) and the spectral phase (black dotted curve) by using TG-SRSI. The spectrum retrieved (blue solid curve) and the spectral phase retrieved (blue dotted curve) by using SHG-FROG. The red curve is the spectrum of the test beam measured directly by the spectrometer. (c) The temporal profiles (solid curves) and phases (dashed curves) retrieved by using TG-SRSI (black curves) and SHG-FROG (blue curves). (d) Spectra of three TG signals measured directly by the spectrometer. Spectra from the bottom to the top correspond to when the input pulse energies are 65, 75, and 85 nJ, respectively[22].
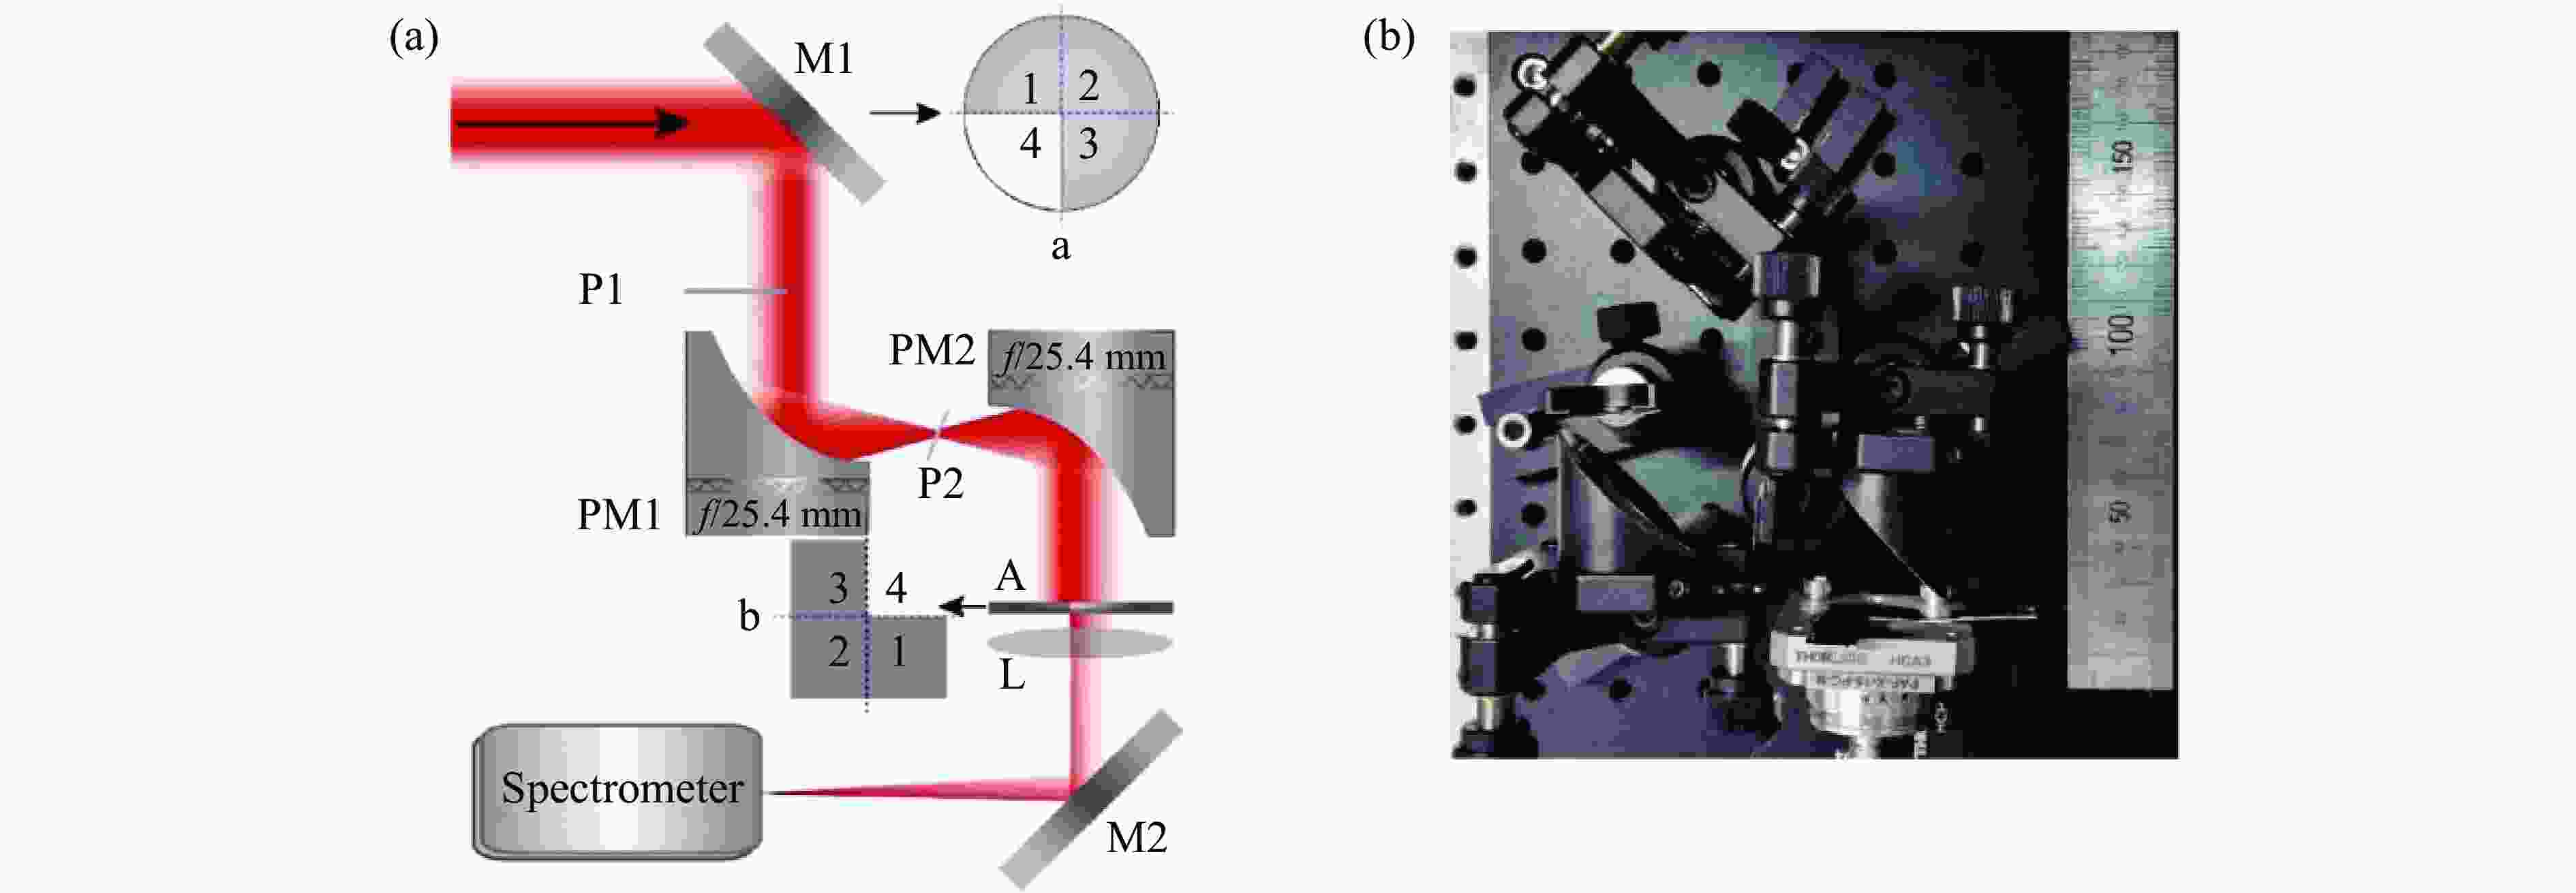
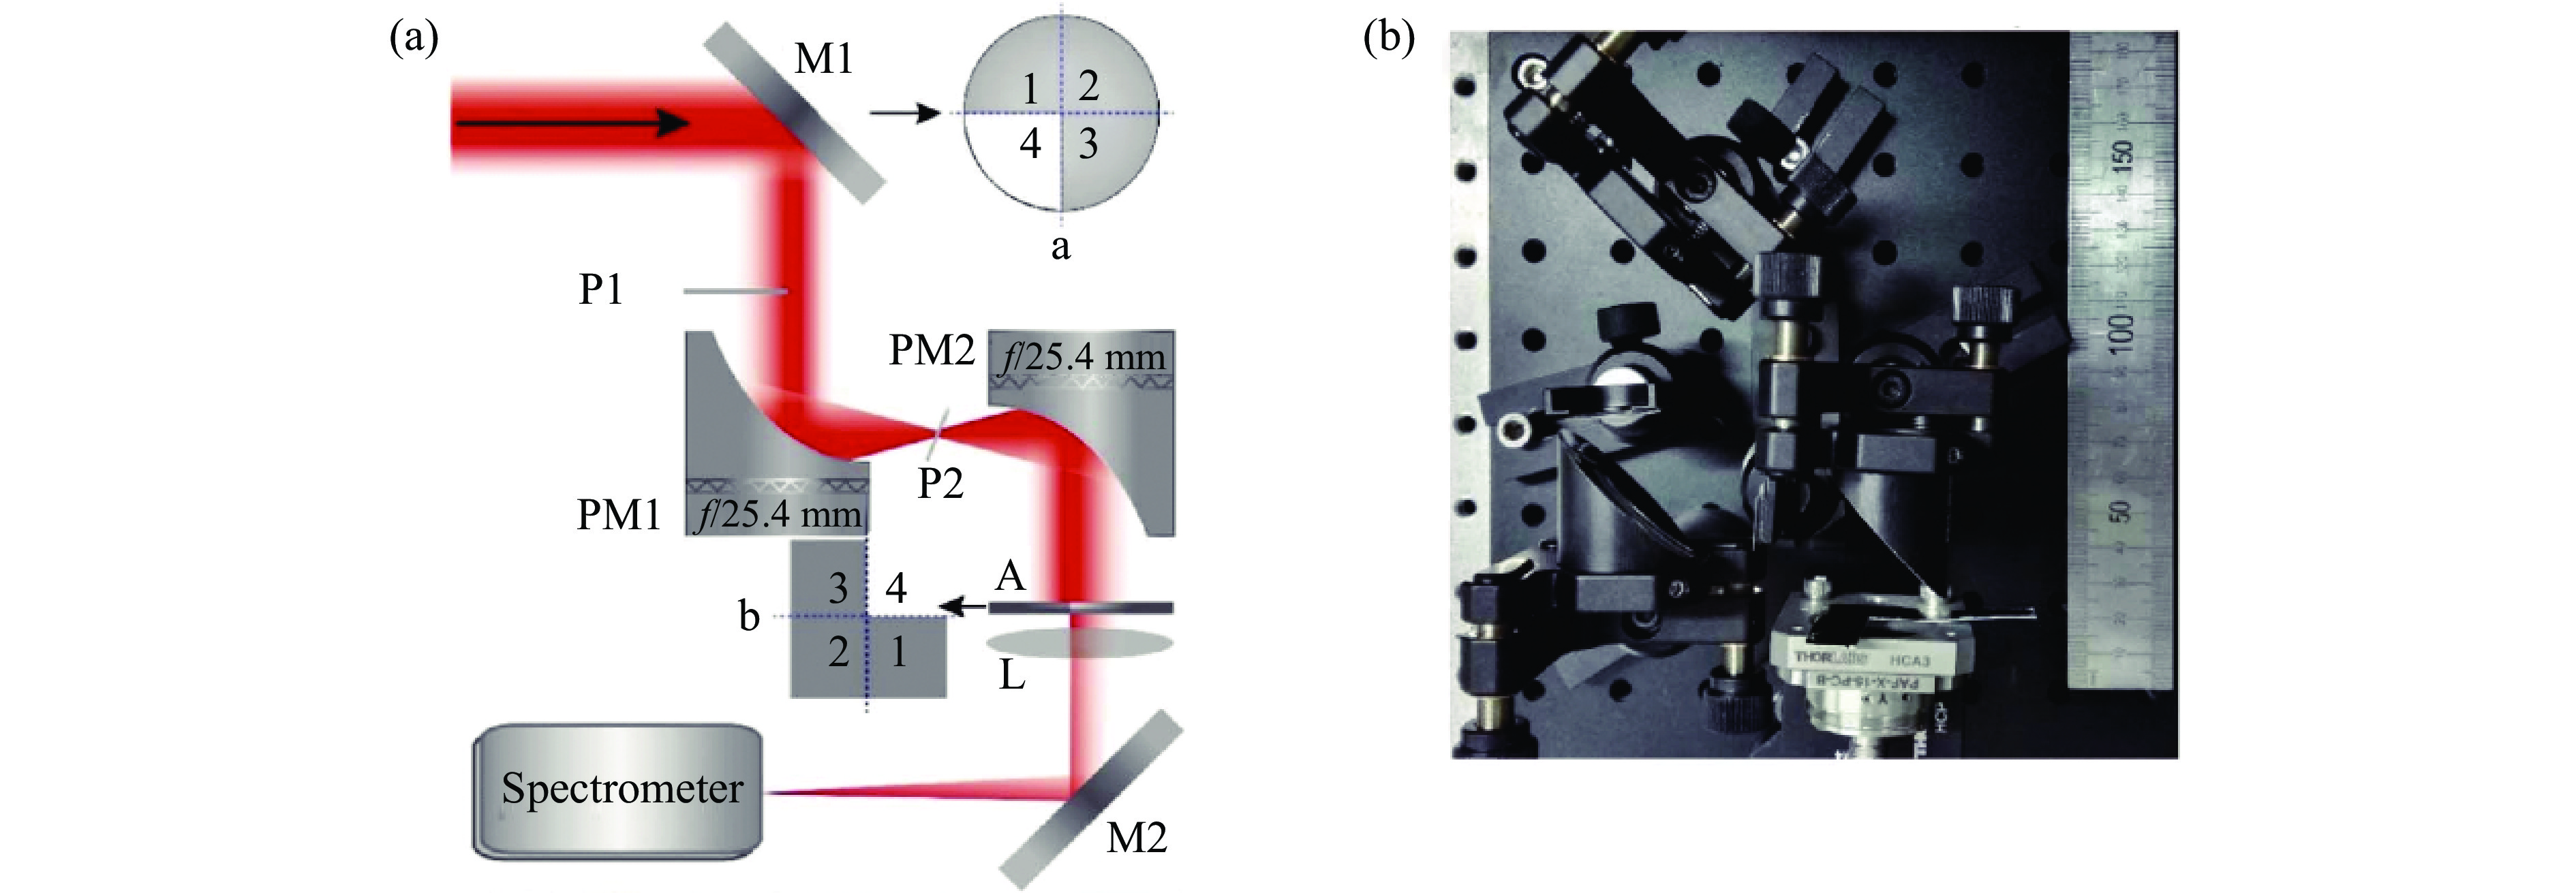
图 11 实验装置图。(a) M1,特制3/4镀膜反射镜;P1,0.5 mm厚熔融石英片;PM1、PM2,90°镀铝离轴抛物面反射镜,焦距f=25.4 mm;P2,0.15 mm厚YAG晶体片;A,光阑;L,透镜,焦距f=200 mm;M2,反射镜。插图a为M1的正面视图;插图b为光阑A的形状。(b)装置光路实物照片[24]。
Figure 11. Experimental setup. (a) M1, special 3/4 coated reflective mirror; P1, fused silica plate, 0.5 mm thick; PM1, PM2, 90° aluminum coating off-axis parabolic mirror, f = 25.4 mm; P2, YAG plate, 0.15 mm thick; A, aperture; L, lens, f = 200 mm; M2, reflective mirror. Inset a, the front side of M1; inset b, the shape of A. (b) Picture of the optical setup of the device[24].
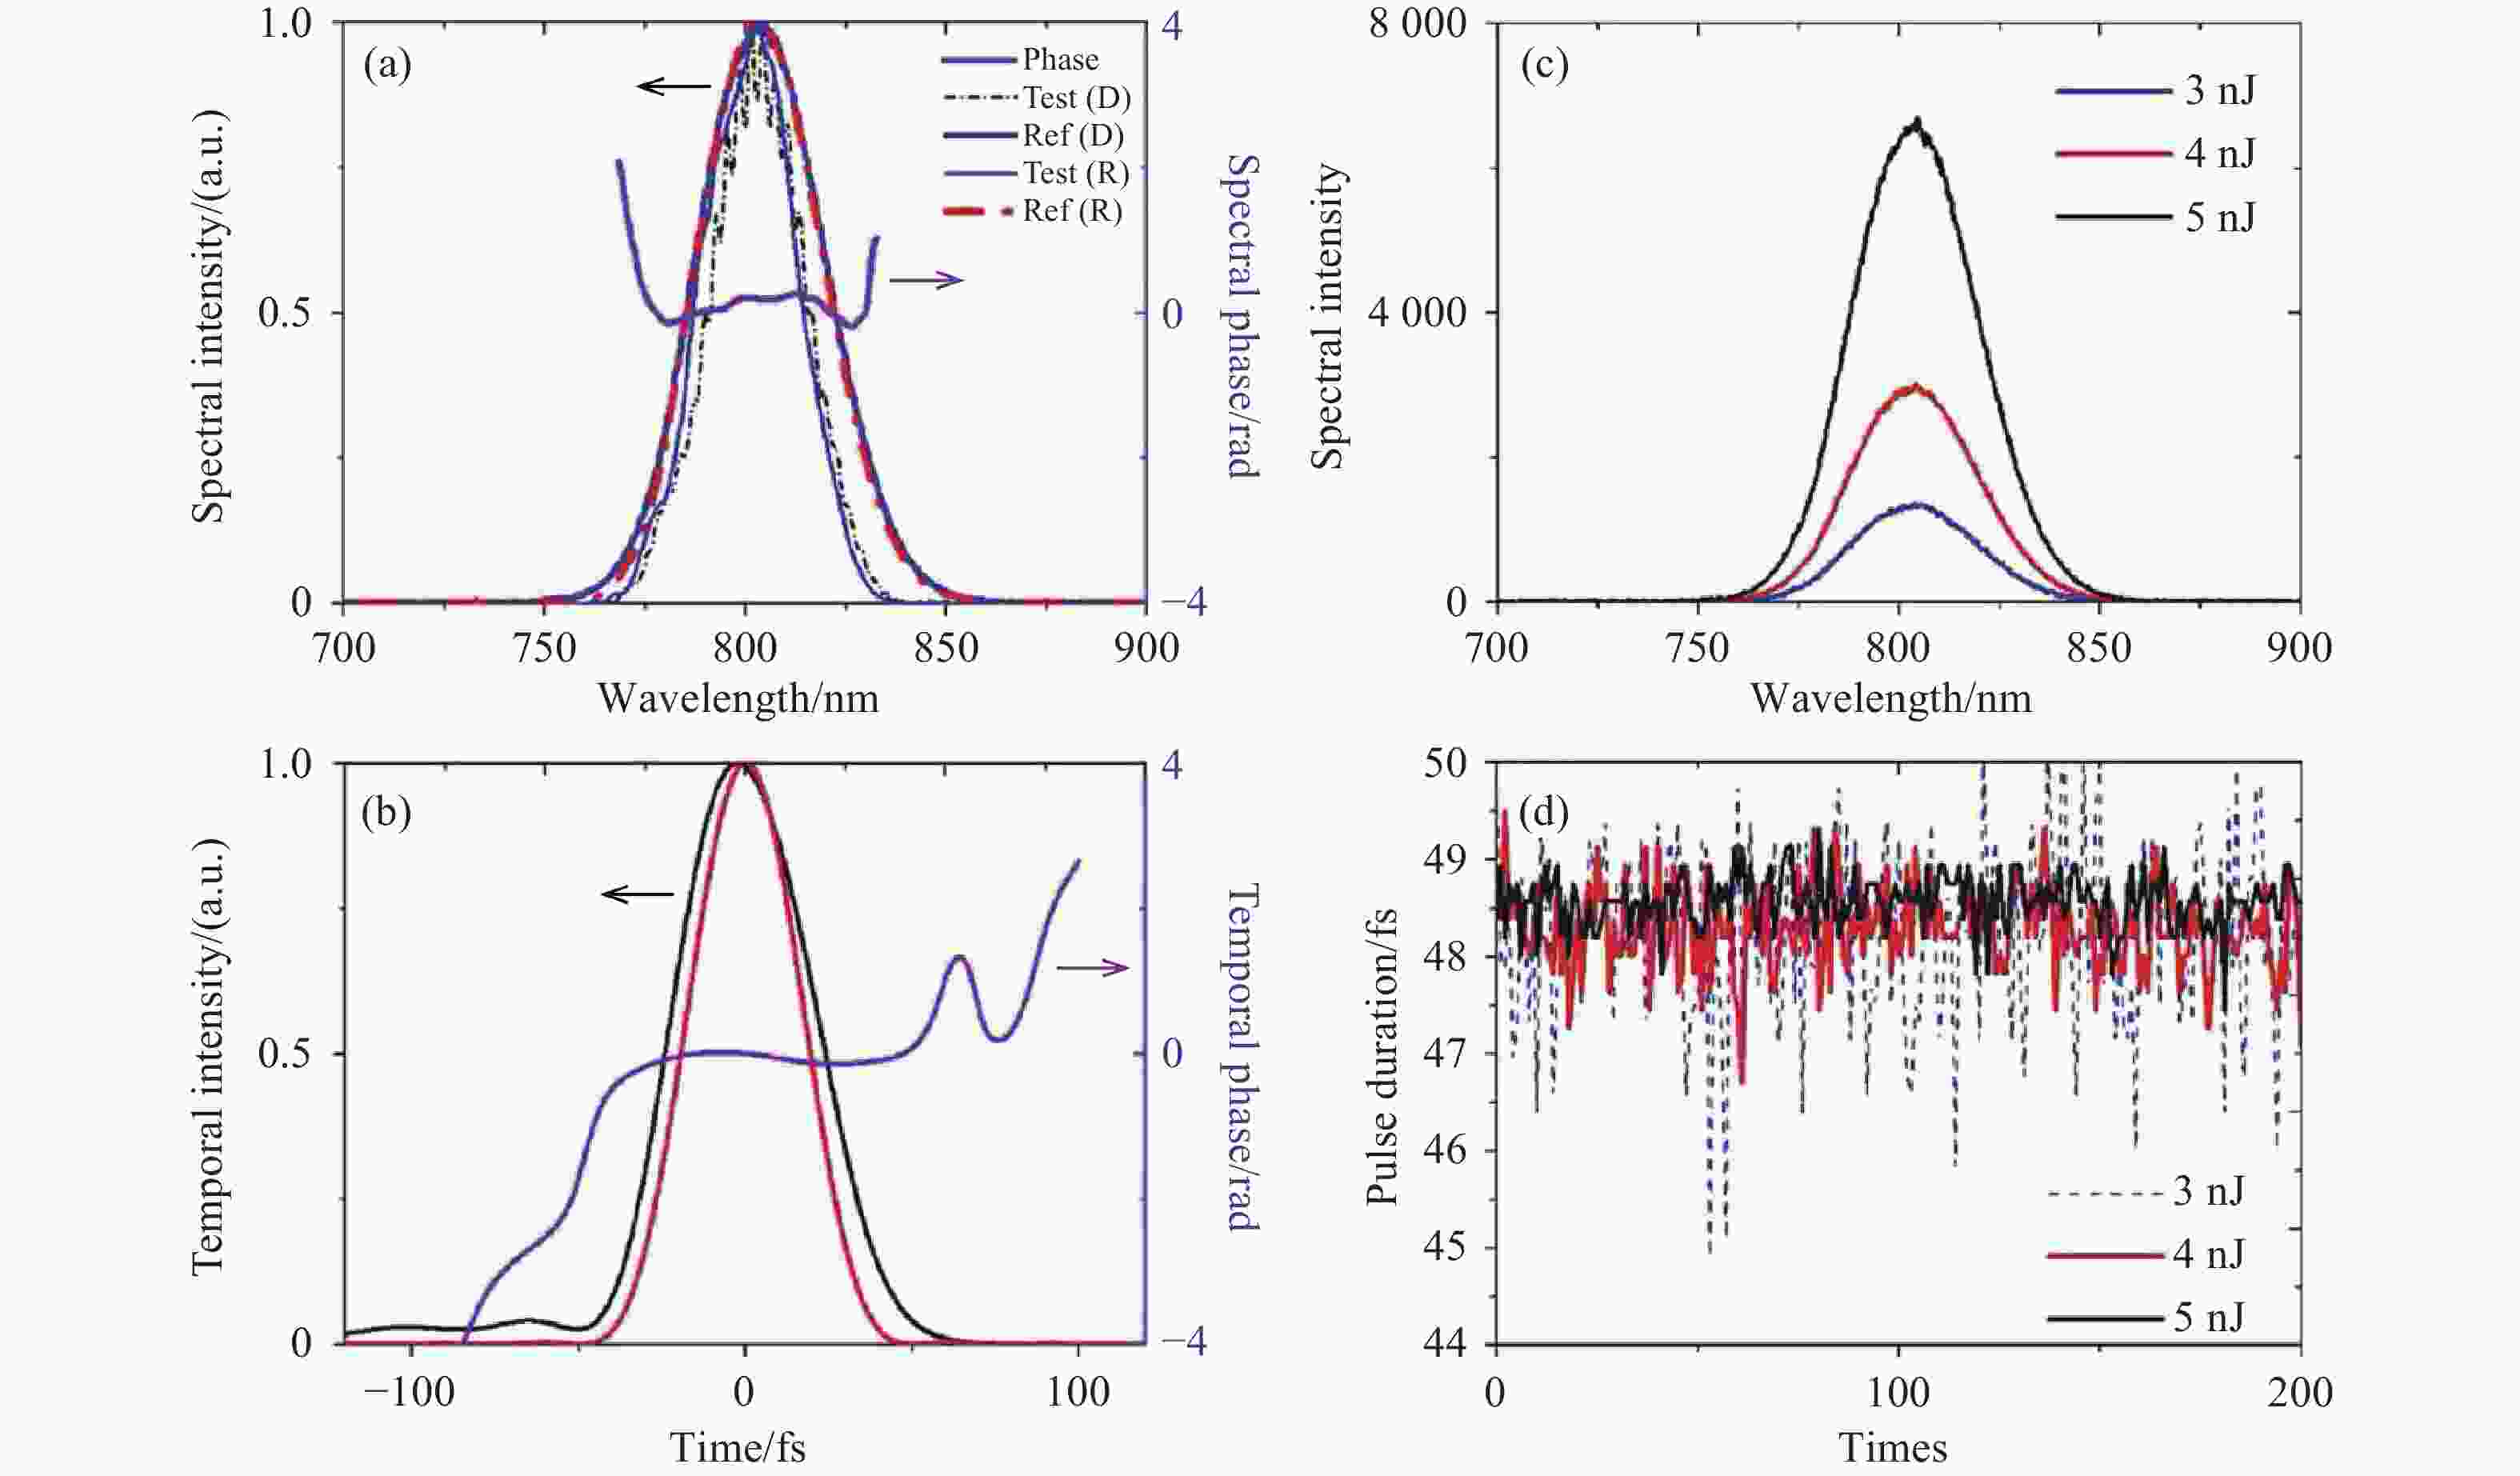
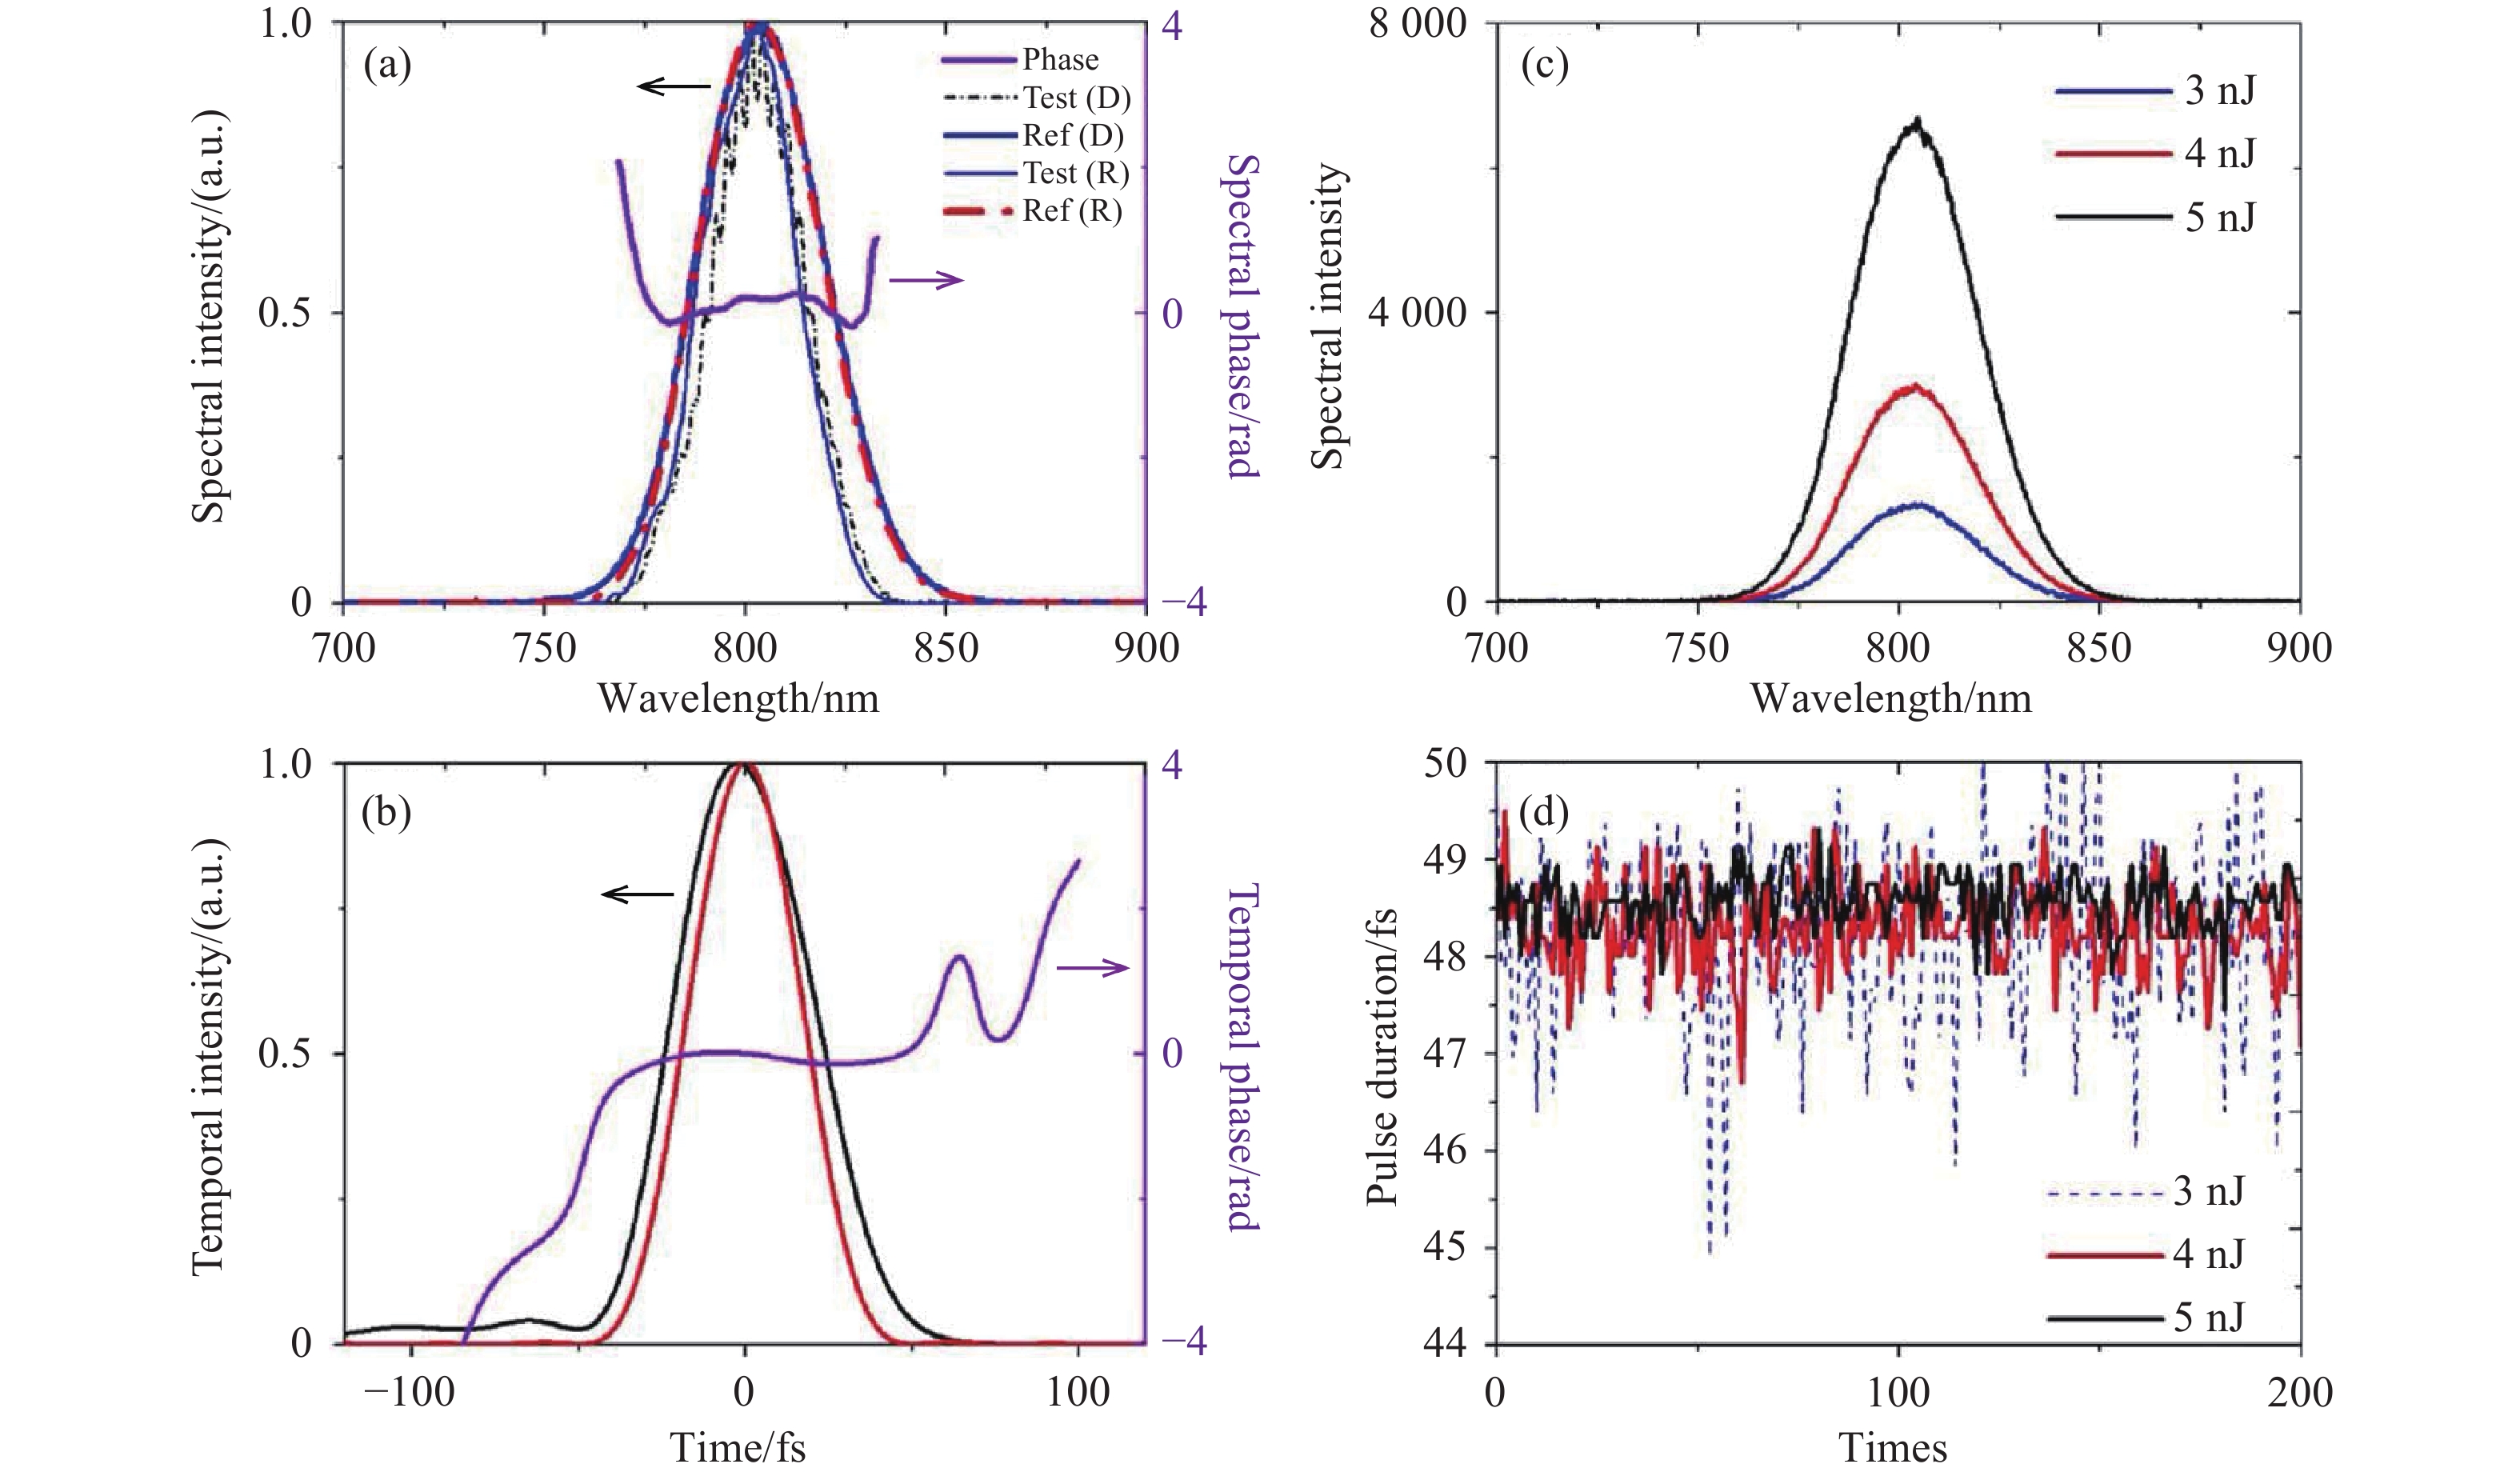
图 12 1 kHz重复频率下飞秒脉冲的表征结果。(a)反演得到和直接测量的未知输入脉冲及TG参考脉冲的光谱,其中“R”表示“反演光谱”,“D”表示“直接测量光谱”。(b)反演得到的未知输入脉冲的时域波形(黑色实线)、傅里叶变换极限脉冲时域波形(红色点划线)及相位。(c)输入能量分别为5 nJ、4 nJ 和 3 nJ时自产生的 TG 参考脉冲的光谱强度。(d)不同输入脉冲能量下表征过程中的脉冲宽度波动[24]。
Figure 12. Characterization results of femtosecond pulses at 1 kHz repetition rates. (a) Retrieved and directly measured spectra of the unknown input pulse and TG reference, “R” for “retrieved spectra” and “D” for “directly measured spectra.” (b) Retrieved temporal profile (black solid line), the Fourier transform limit pulse temporal profile (red dashed-dotted line), and the phase of the unknown input pulse. (c) Spectra intensity of self-created TG reference pulses with input energy of 5 nJ, 4 nJ, and 3 nJ, respectively. (d) Pulse duration fluctuation in the characterization with different input pulse energies[24].
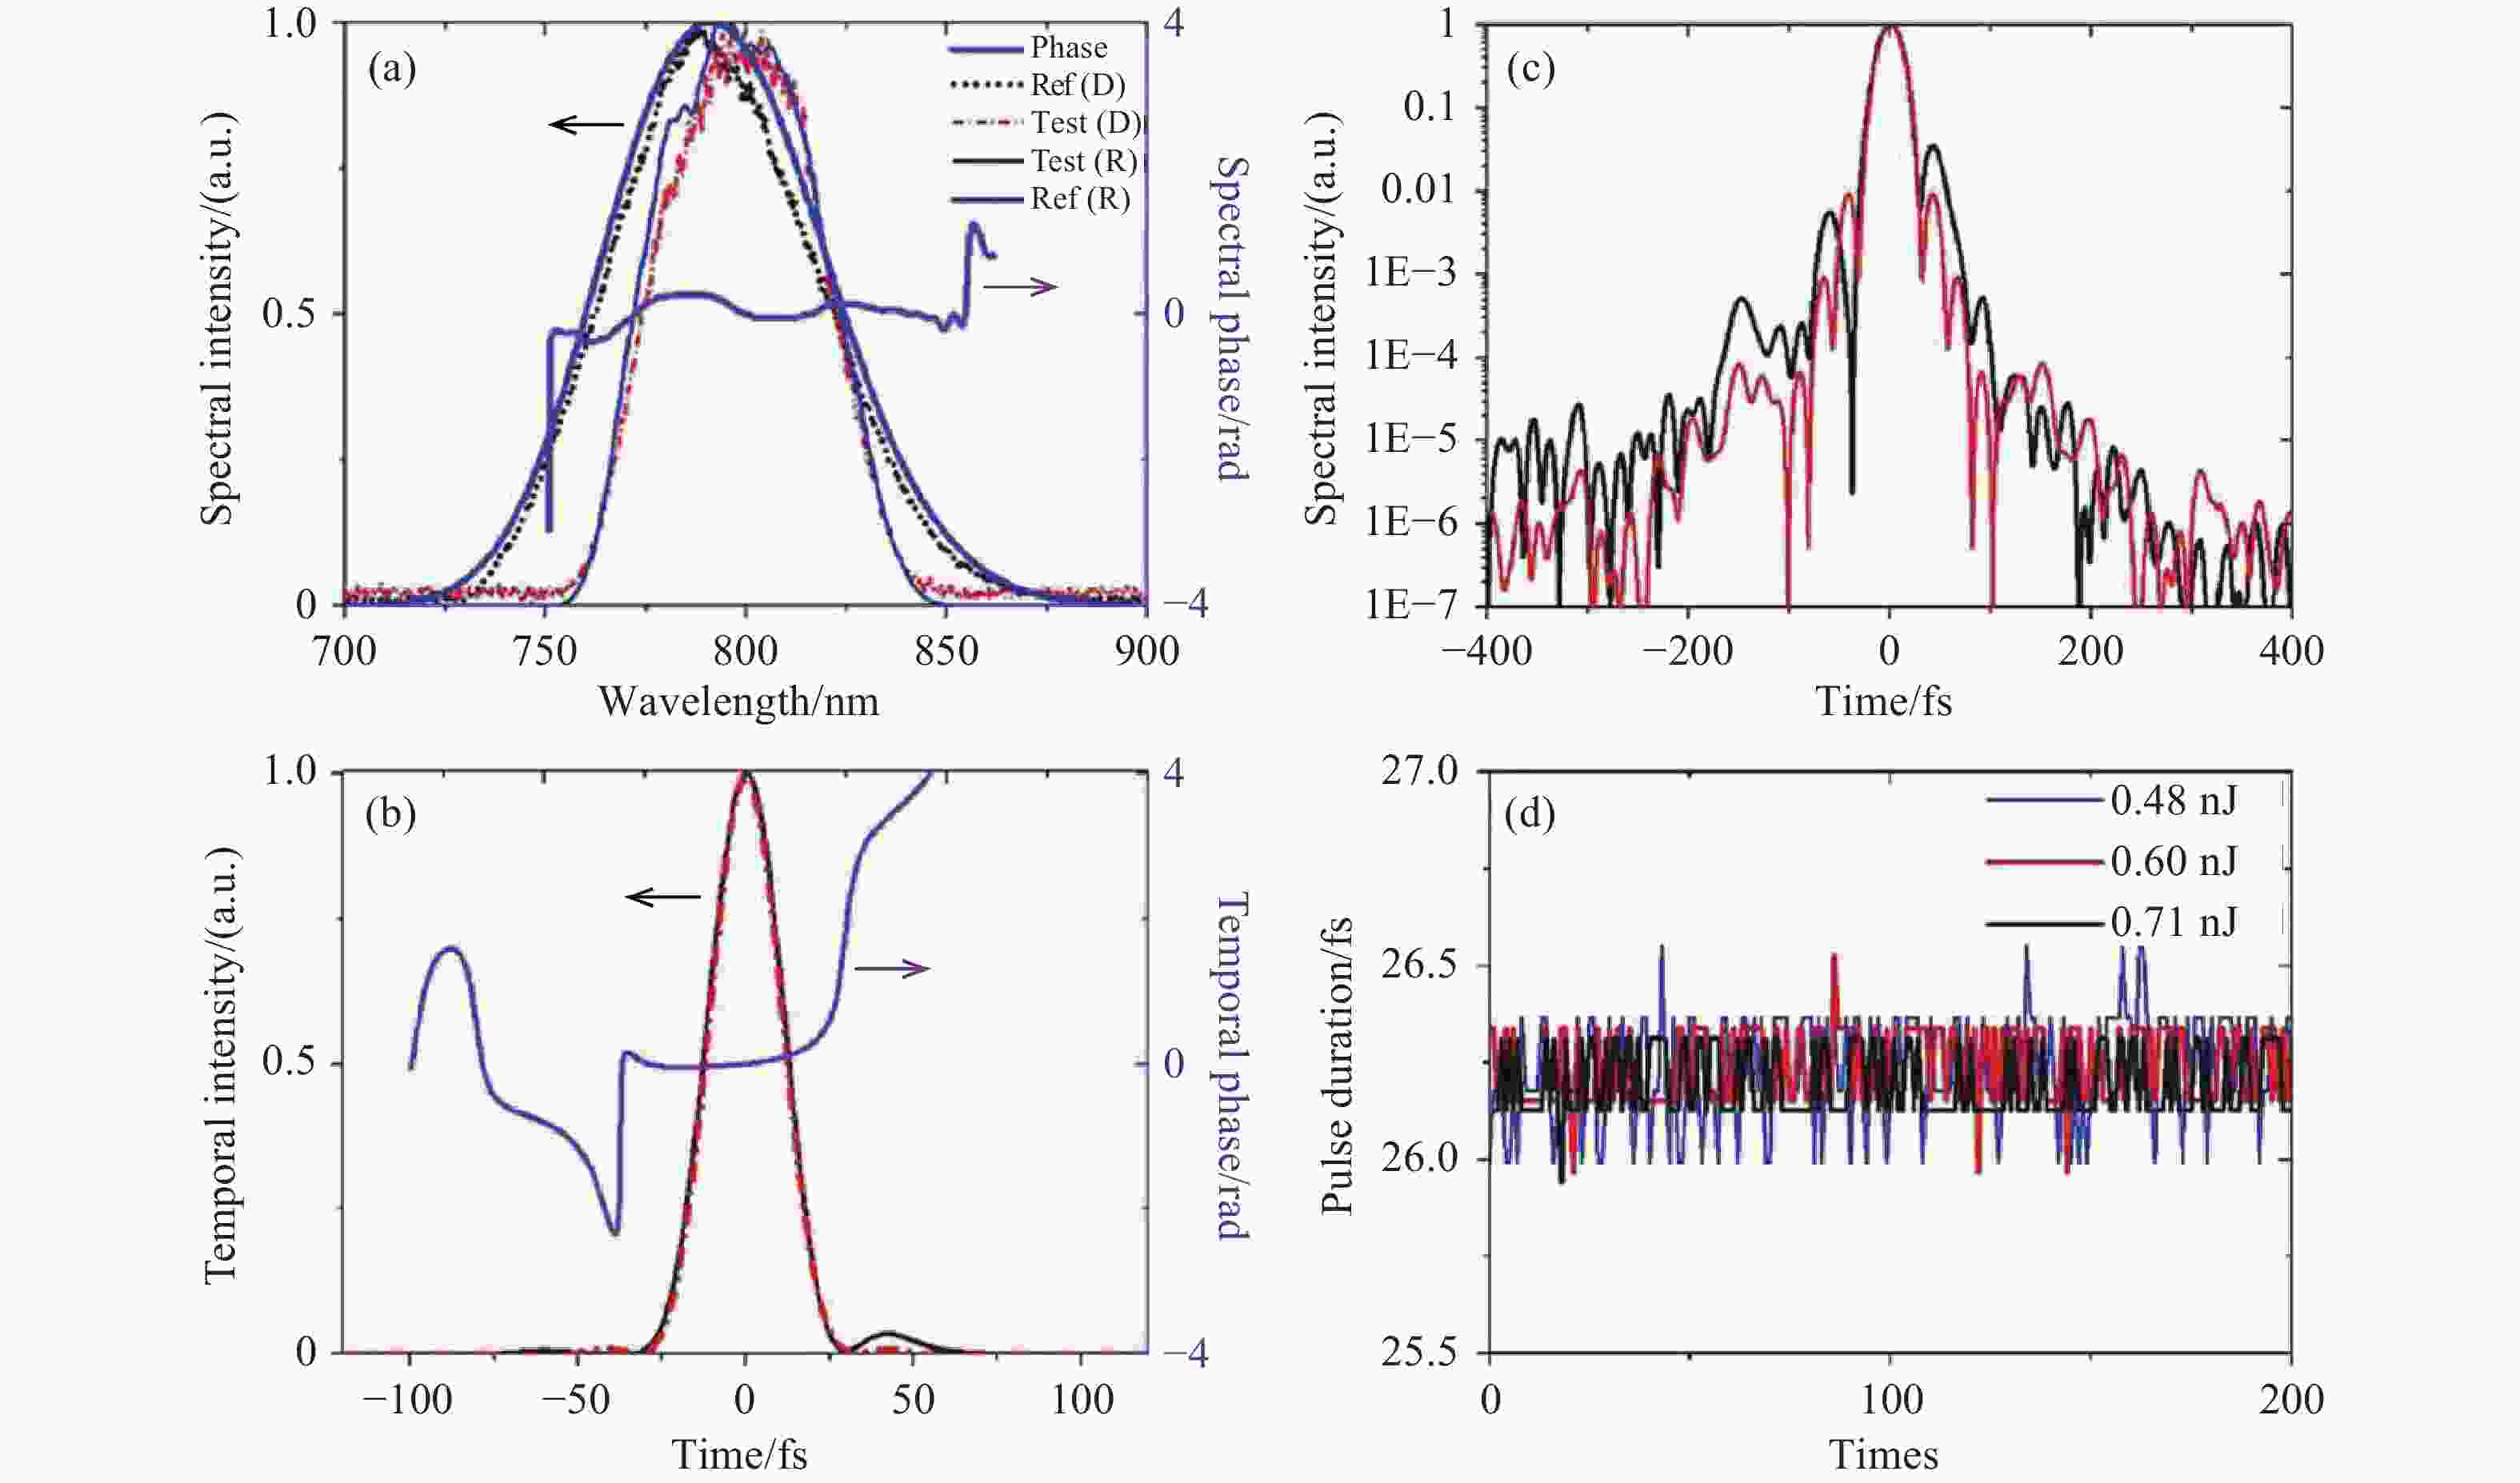
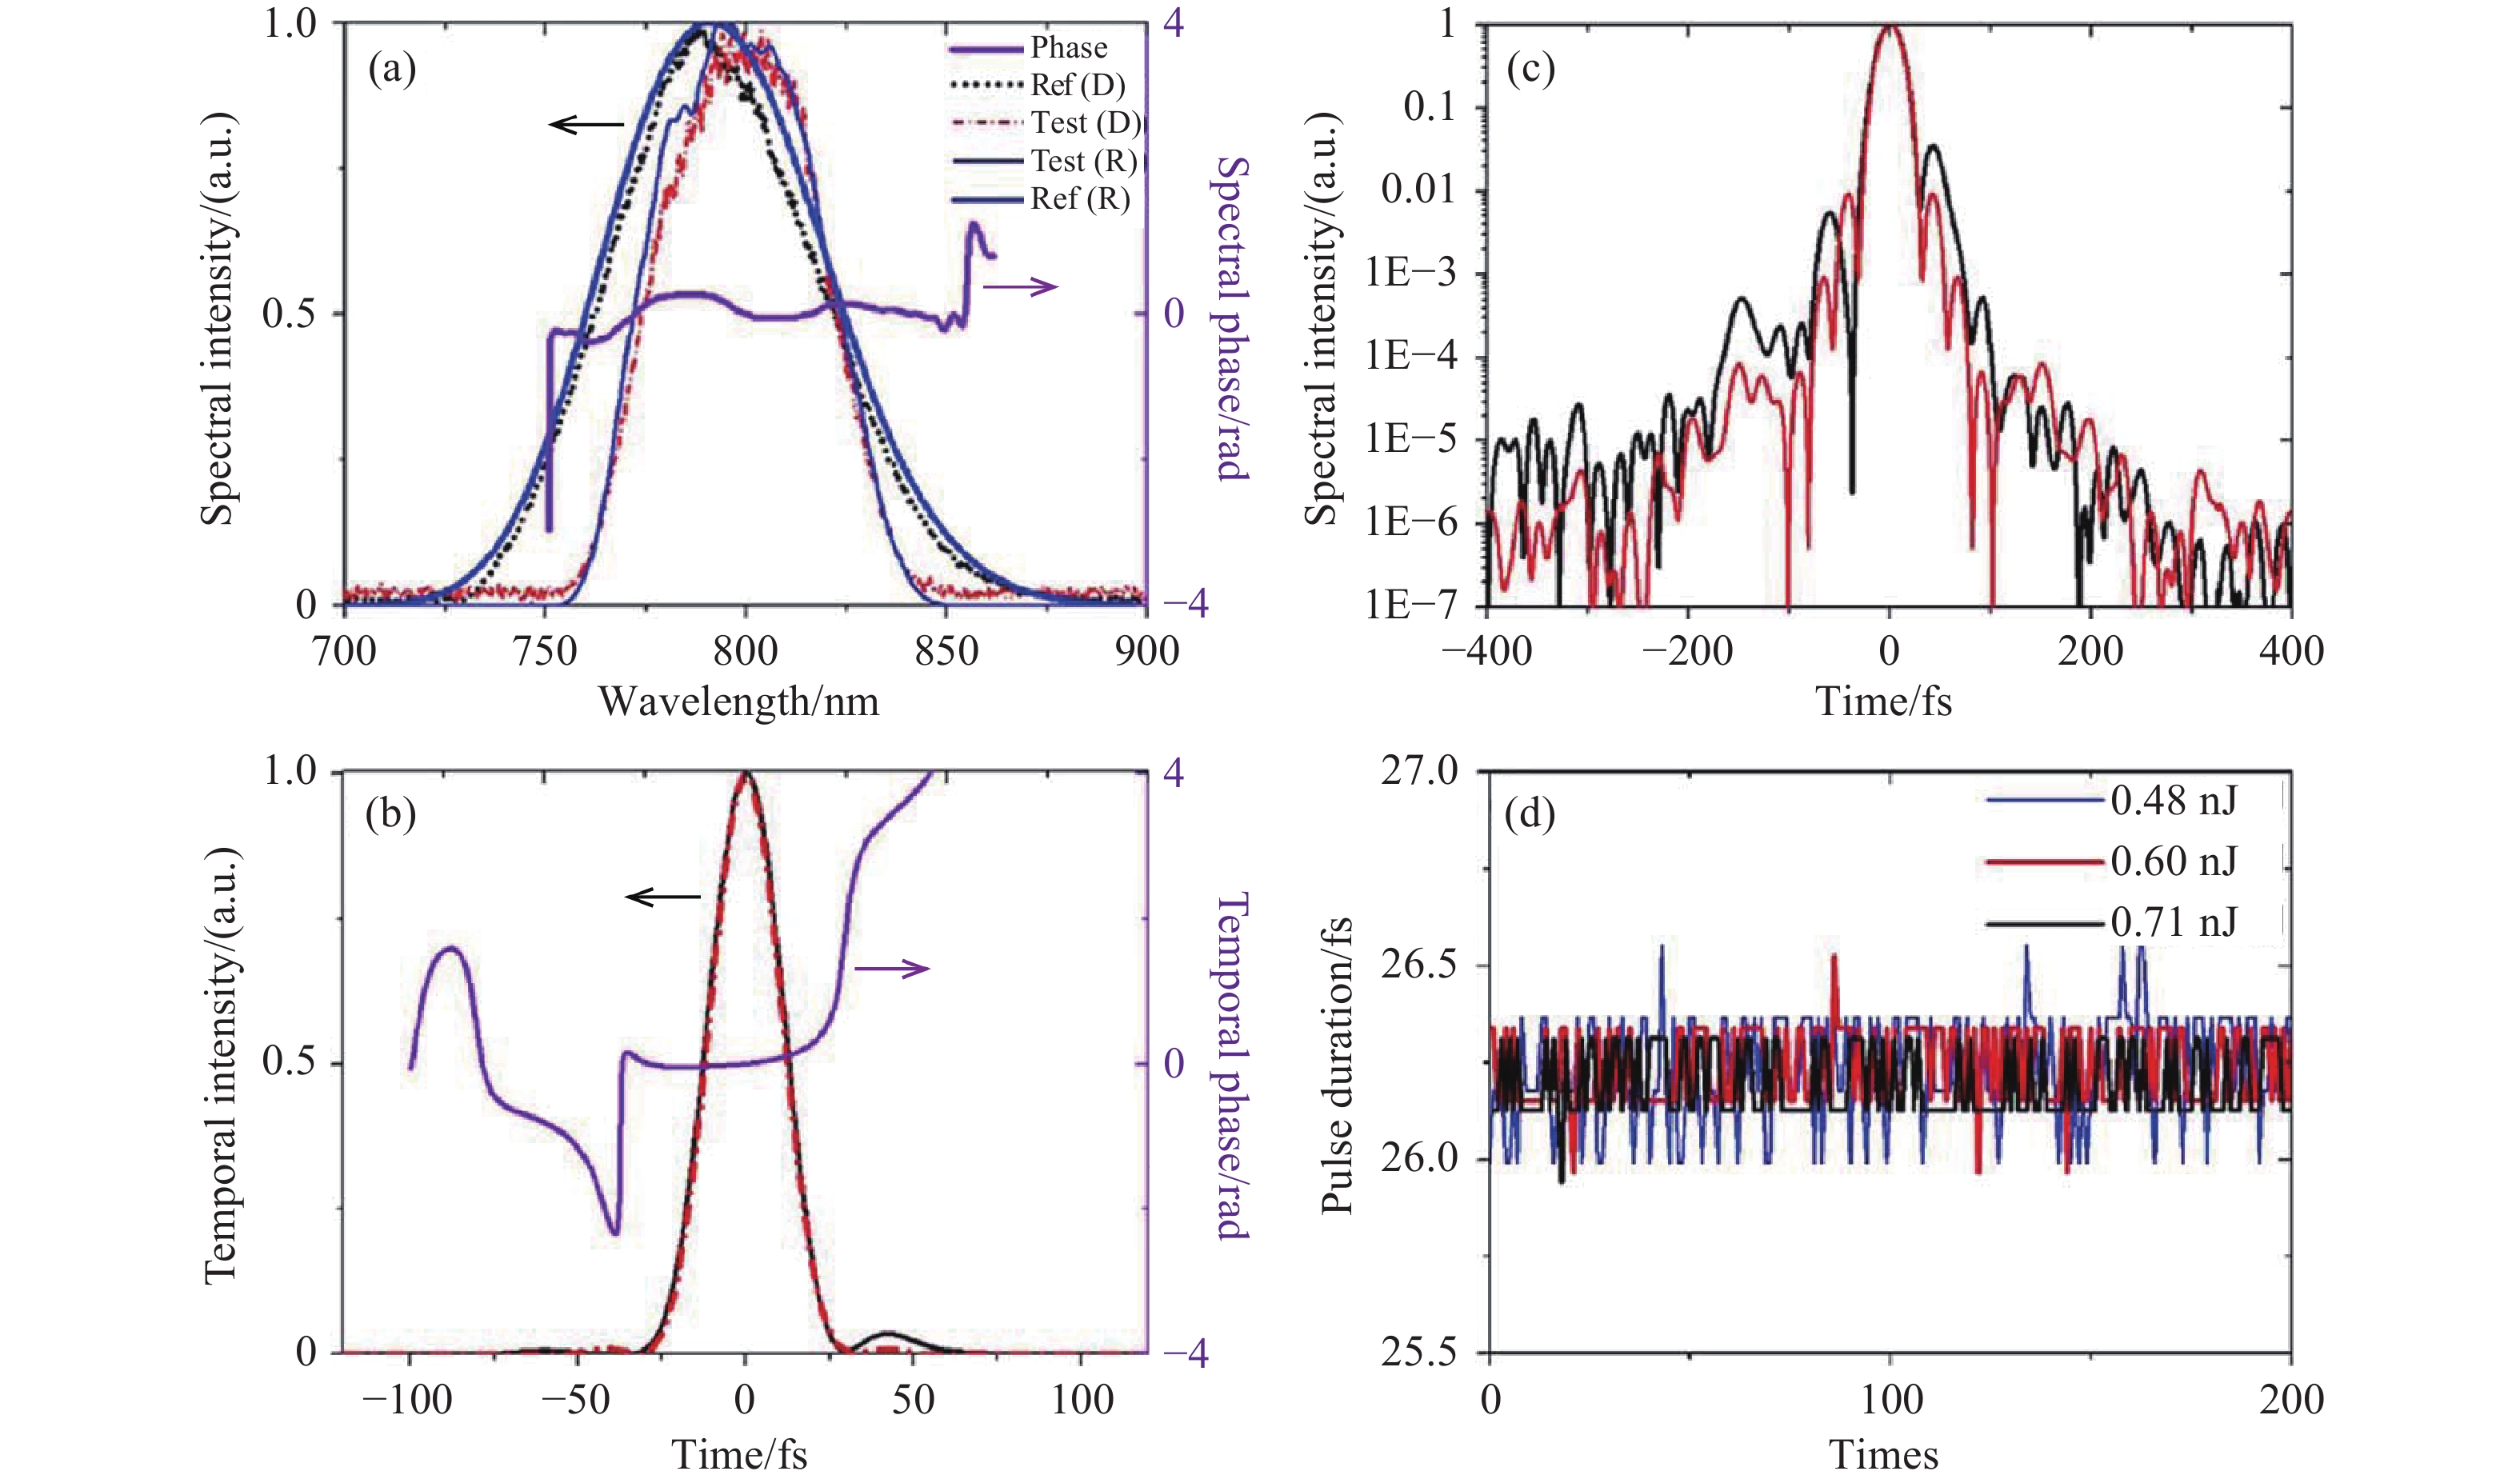
图 13 84 MHz重复频率下飞秒脉冲的表征结果。(a)反演得到和直接测量的未知输入脉冲及TG参考脉冲的光谱,其中“R”表示“反演光谱”,“D”表示“直接测量光谱”。(b)反演得到的未知输入脉冲的时域波形(黑色实线)、傅里叶变换极限脉冲时域波形(红色点划线)及相位。(c)对数坐标下反演得到的时域强度波形(黑色线)和傅里叶变换极限脉冲时域波形(红色线)。(d)不同输入脉冲能量下表征过程中的脉冲宽度波动曲线[24]。
Figure 13. Characterization results of femtosecond pulses at 84 MHz repetition rates. (a) Retrieved and directly measured spectra of the unknown input pulse and TG reference pulse, “R” for “retrieved spectra” and “D” for “directly measured spectra.” (b) Retrieved temporal profile (black solid line), Fourier transform limit pulse temporal profile (red dashed-dotted line), and phase of the unknown input pulse. (c) Retrieved temporal intensity profile (black line) and Fourier transform limit pulse temporal profile (red line) on a logarithmic scale. (d) Pulse duration fluctuation curves in the characterization with different input pulse energies[24].
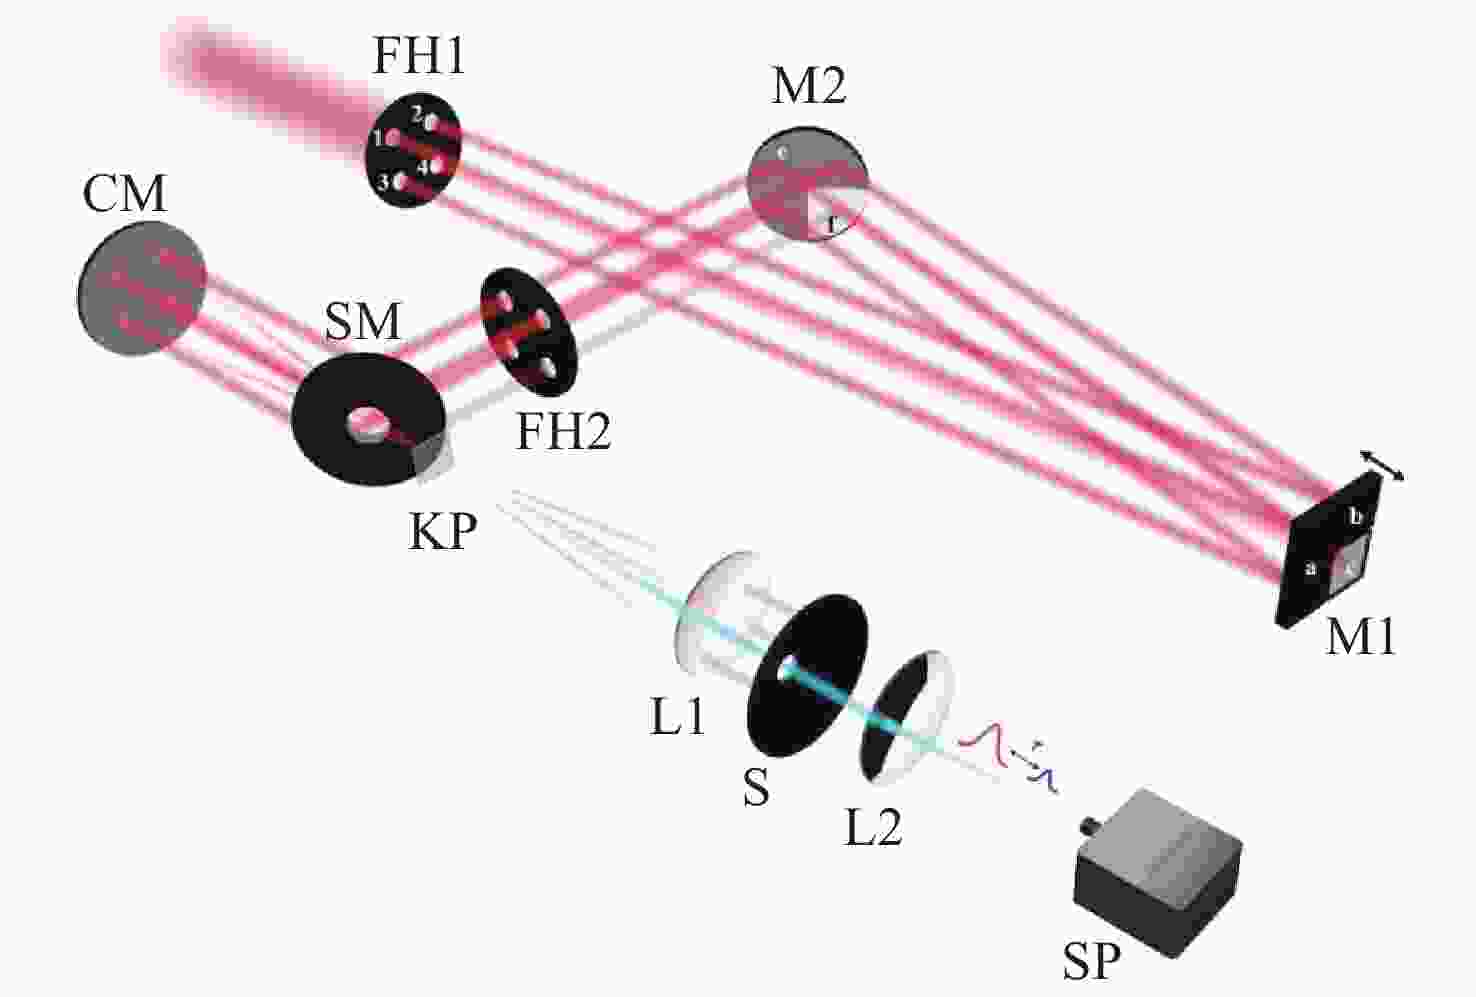
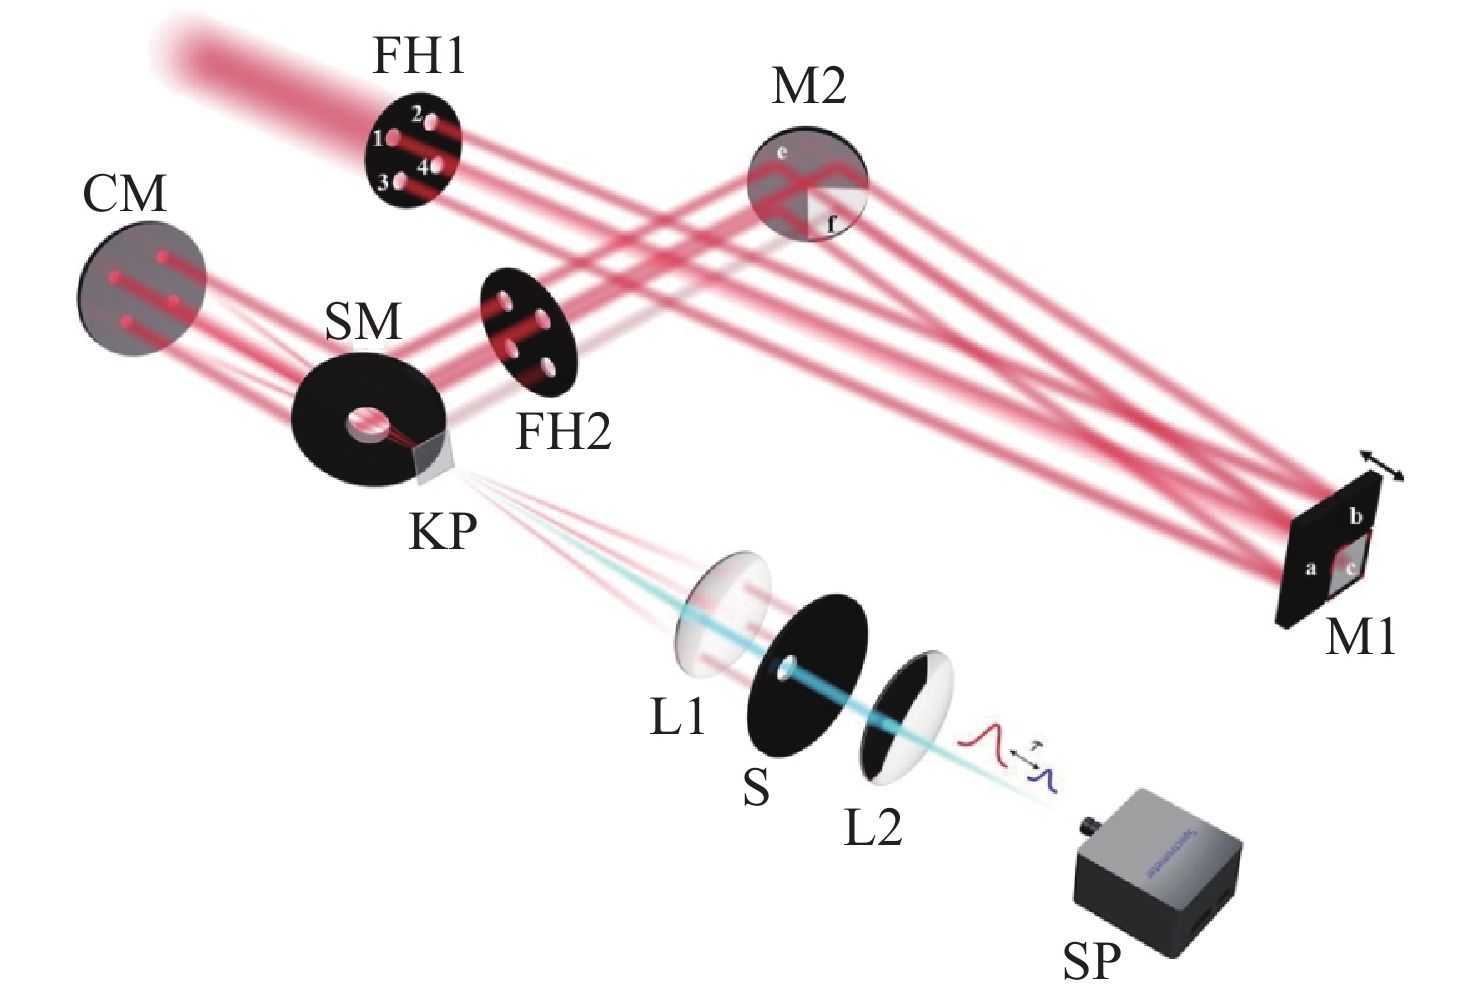
图 14 实验装置示意图。FH1、FH2:四孔小孔光阑;M1:四分之三镀膜反射镜;M2:四分之三镀膜反射镜;SM:中心开孔平面反射镜;CM:凹面反射镜;KP:薄熔融石英片;L1、L2:透镜;S:单孔光阑;SP:光谱仪[25]。
Figure 14. Schematic of the experimental setup. FH1, FH2: Four-Hole Pinhole. M1: three-quarter coated mirror. M2: Three-quarter coated mirror. SM: Plane mirror with hole in the center. CM: Concave mirror. KP: Thin fused-silica plate. L1, L2: Lens. S: Single-hole aperture. SP: spectrometer[25].
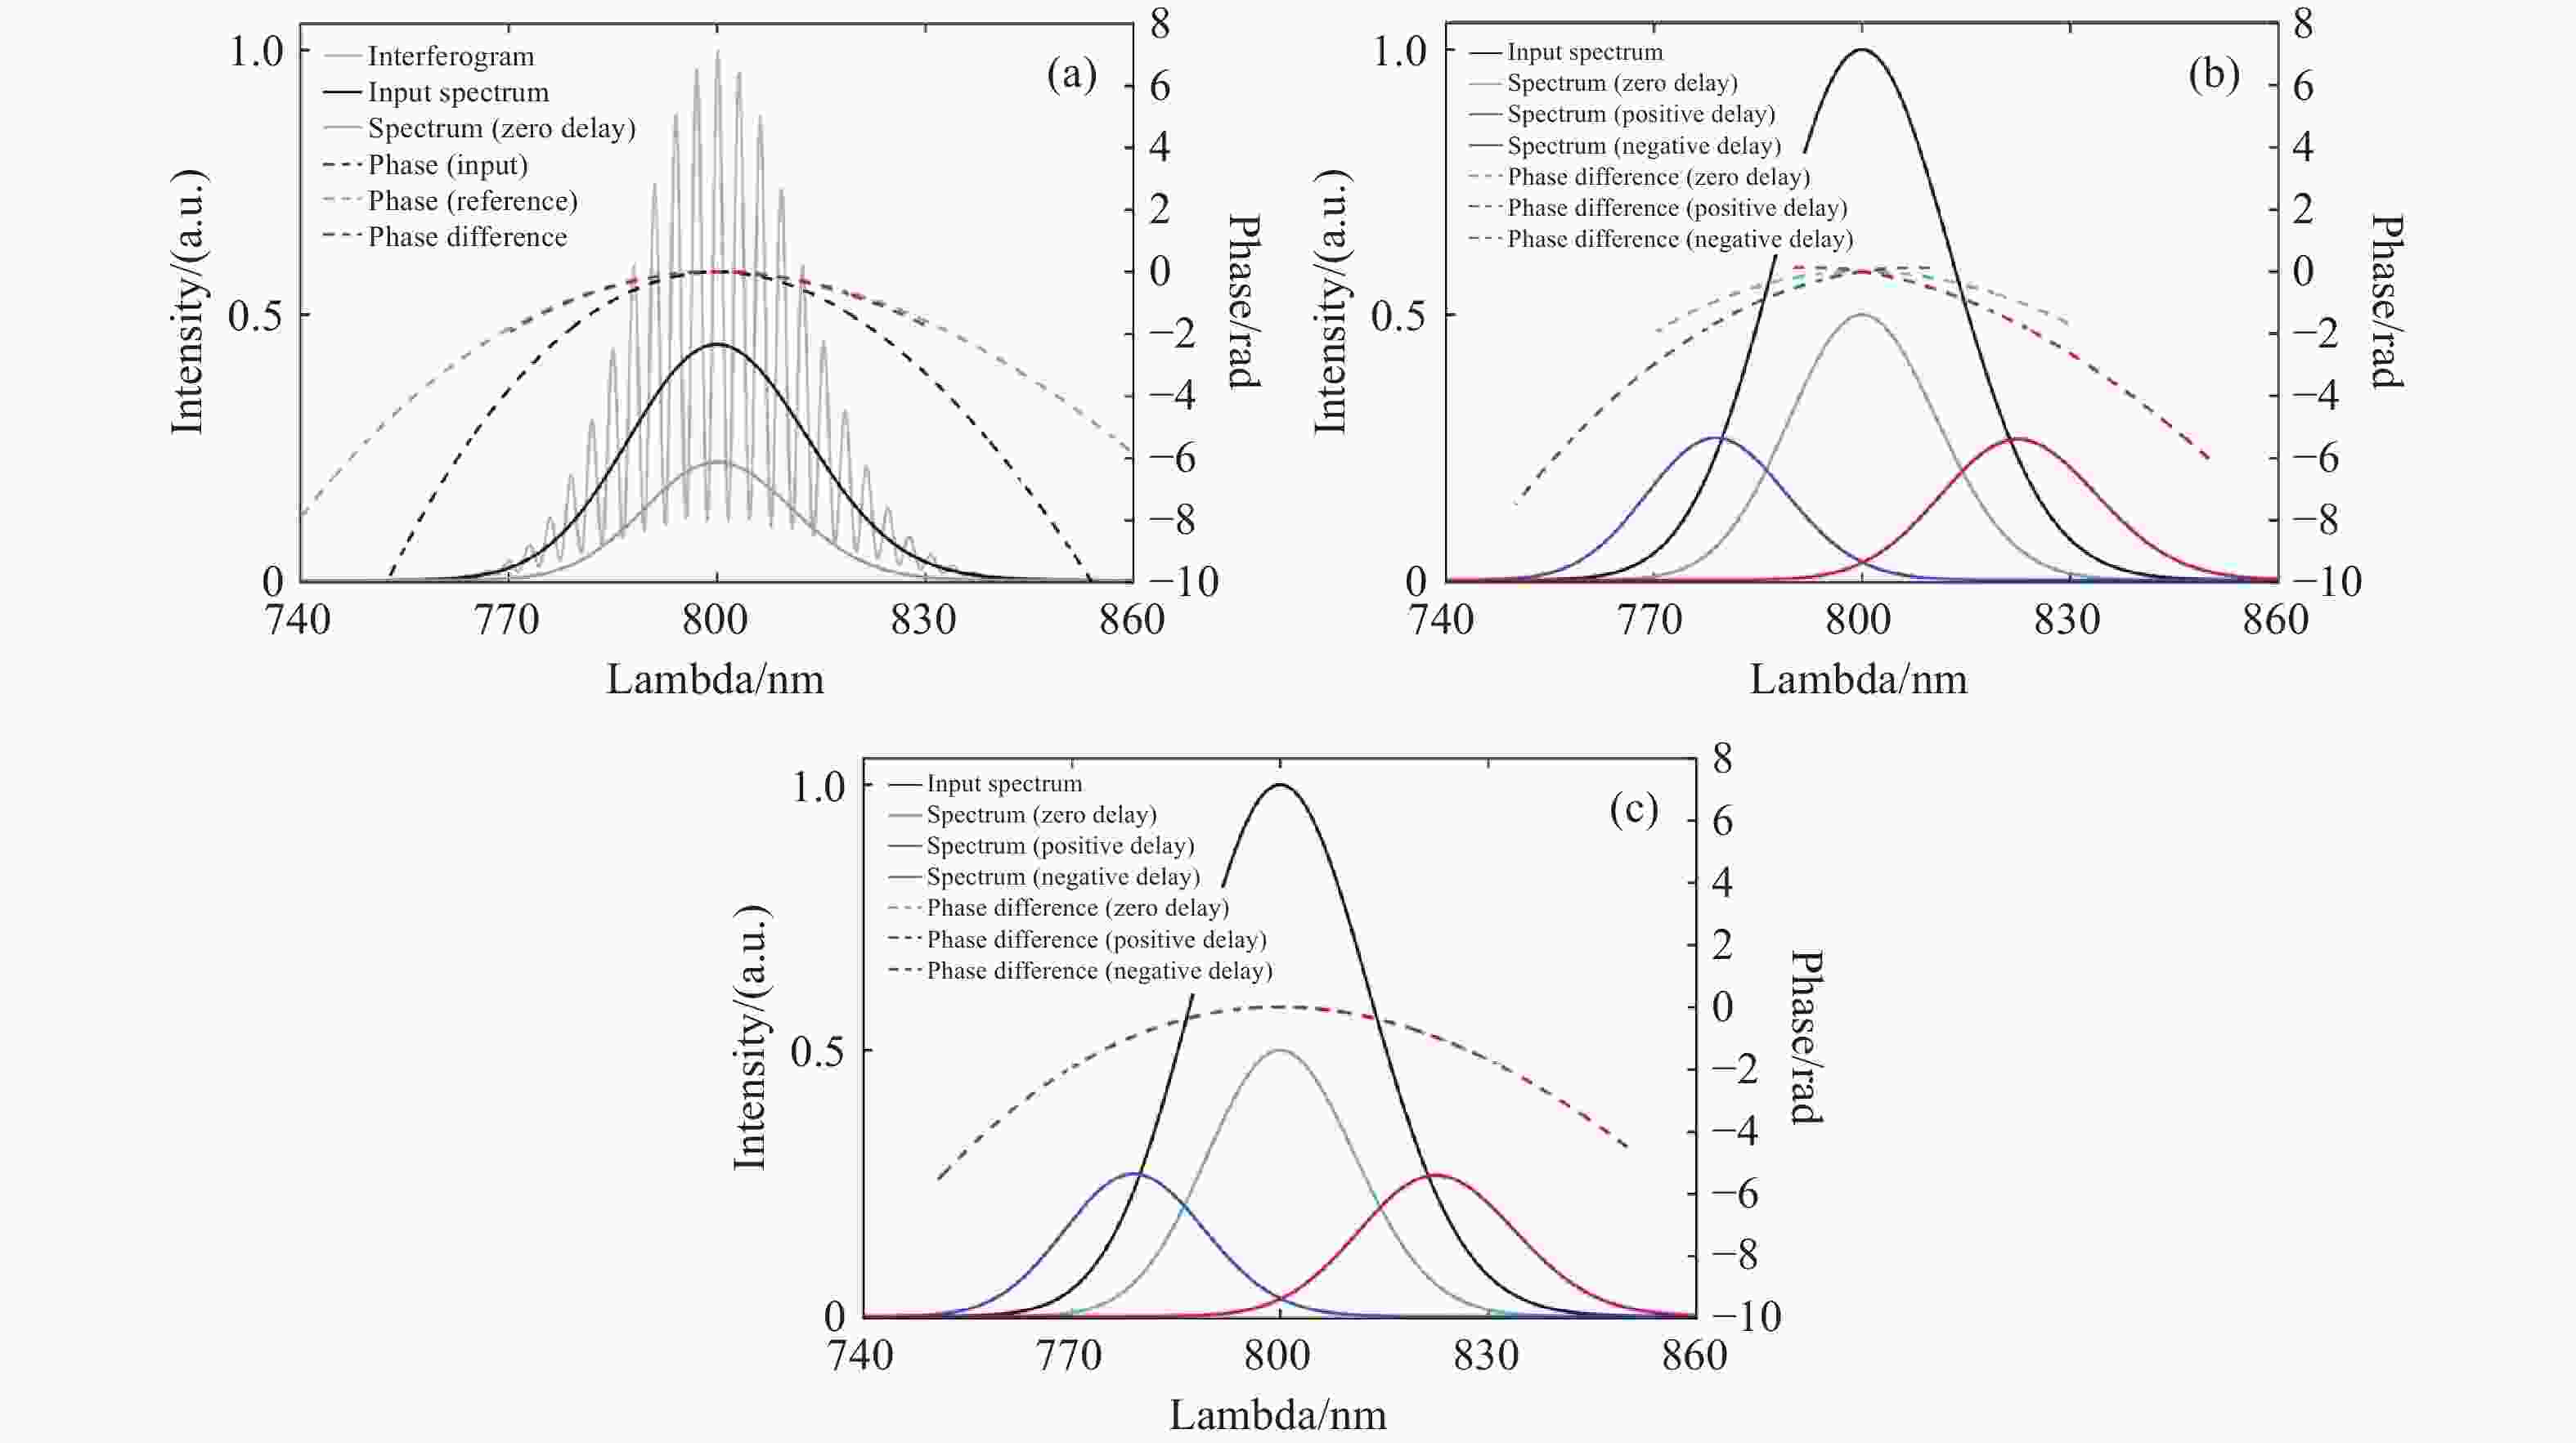
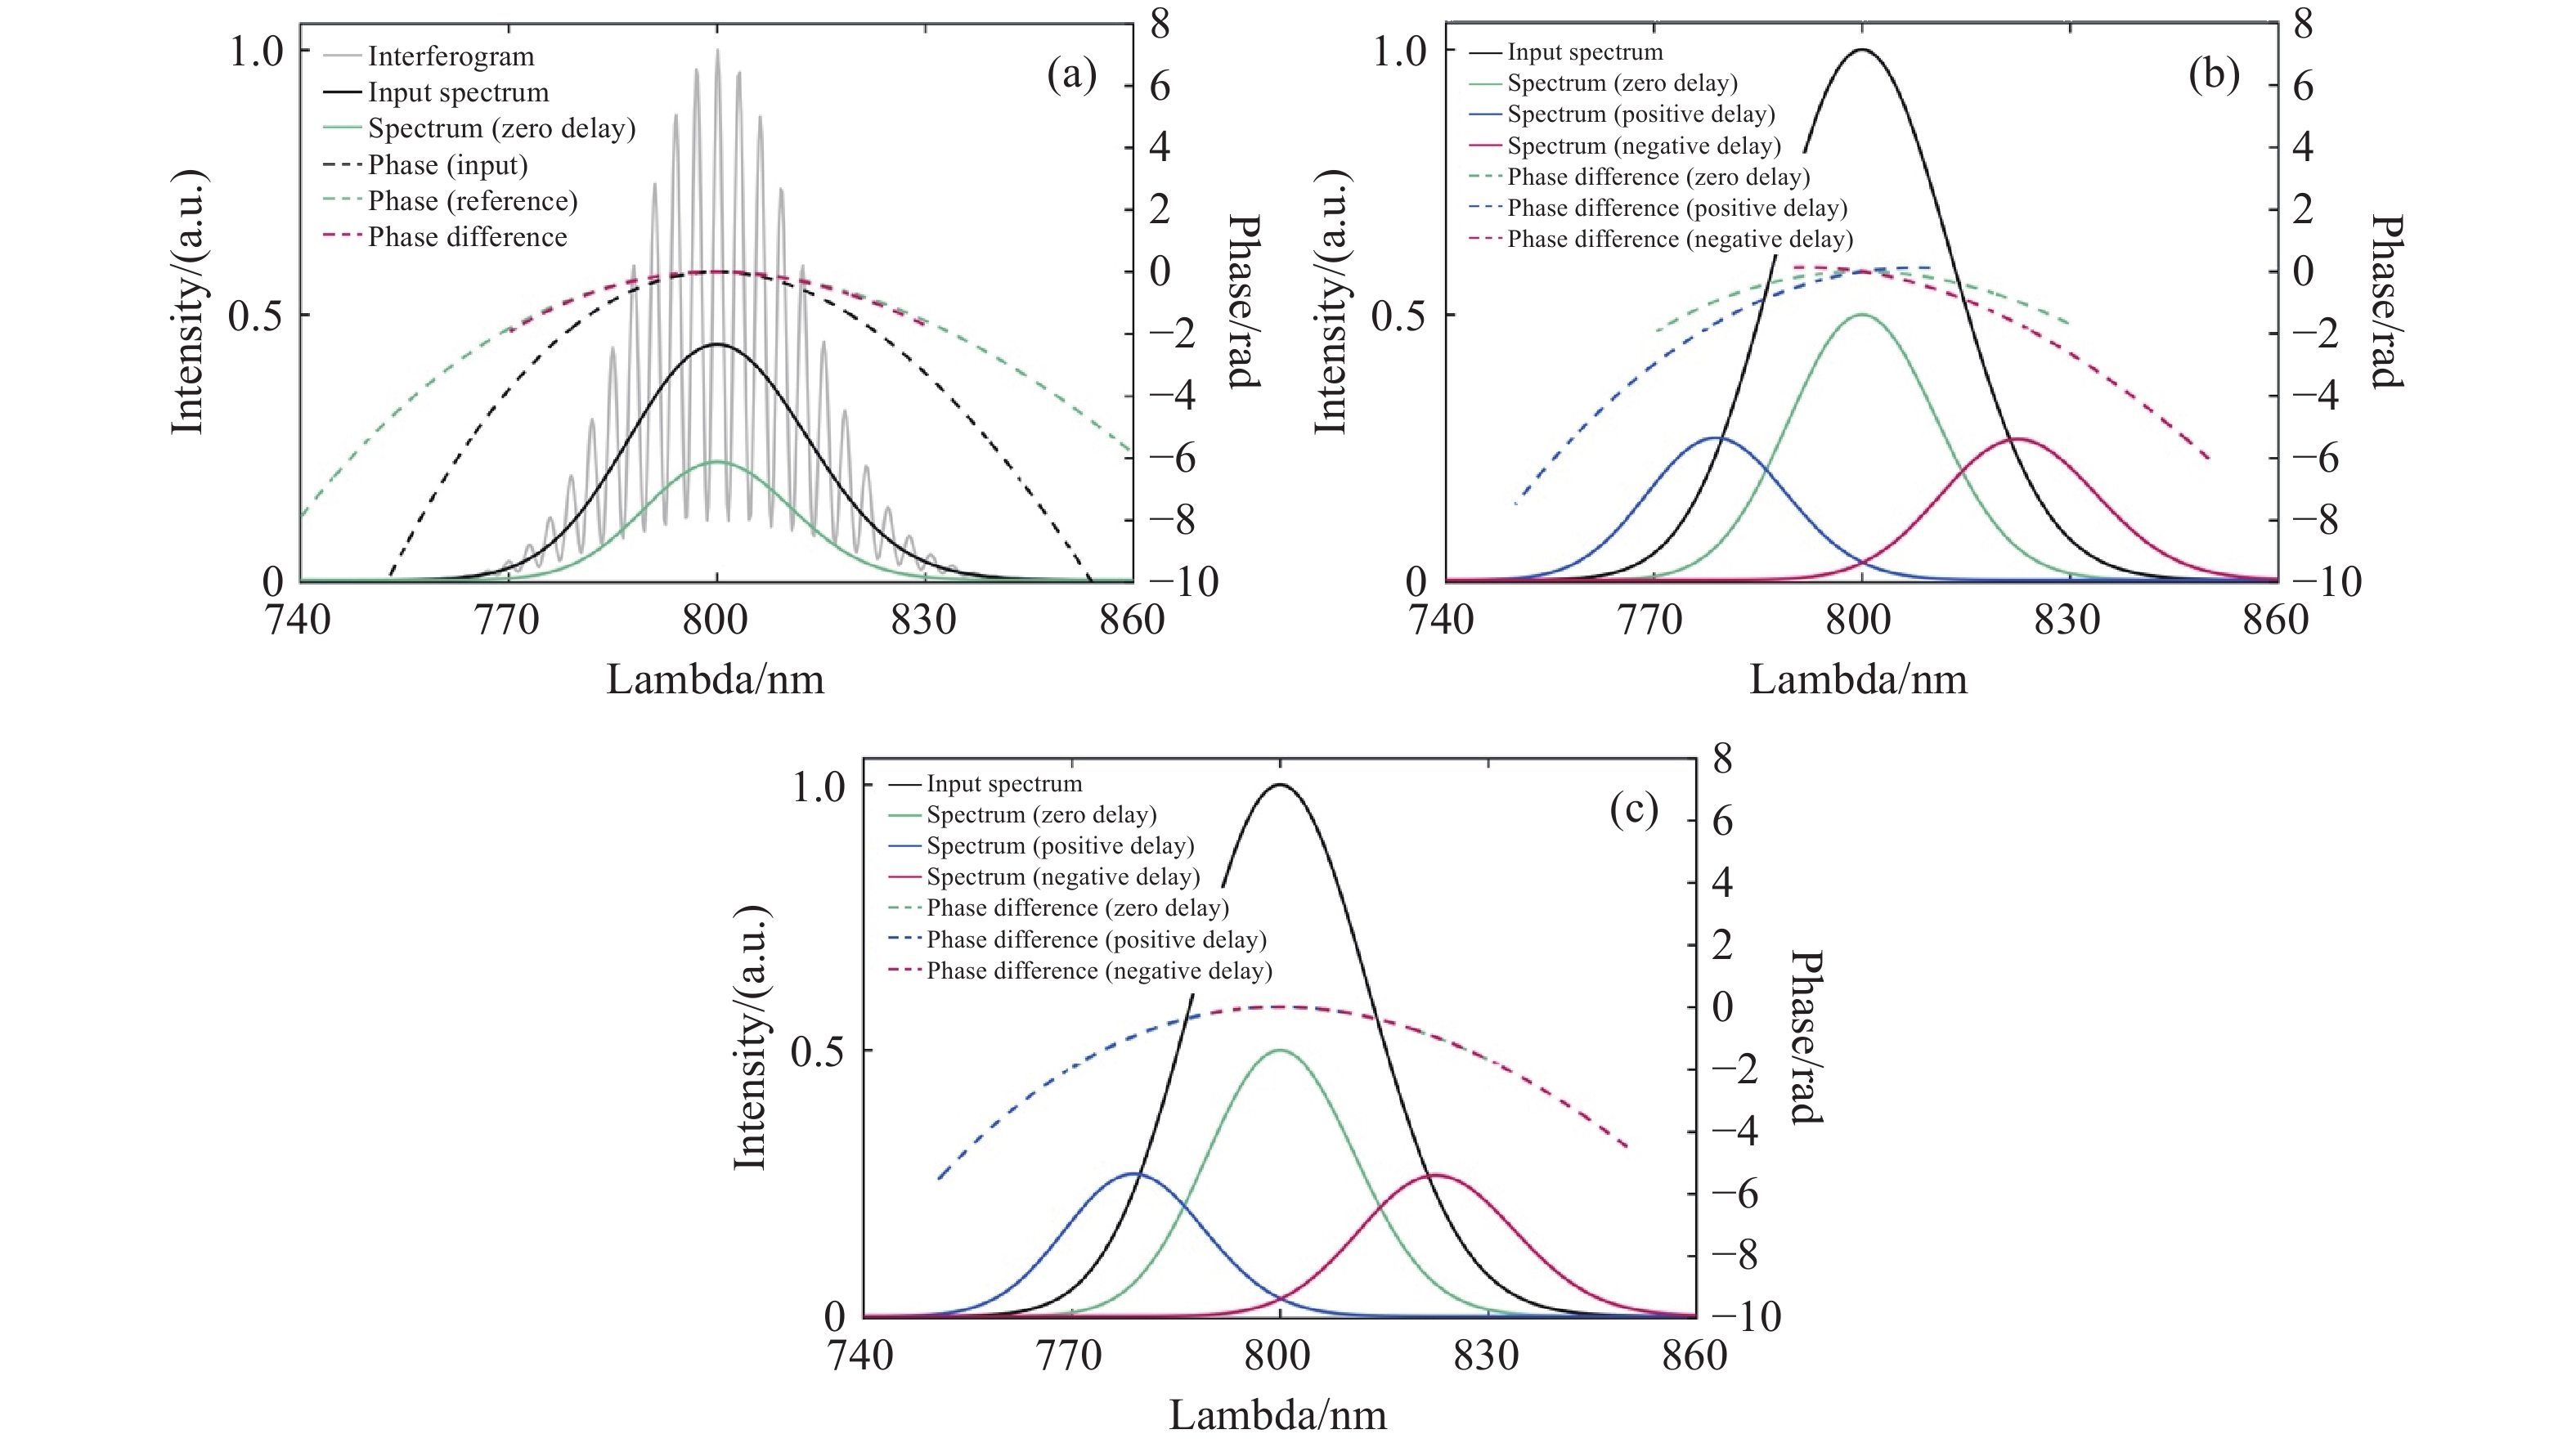
图 15 SRSI算法的局限性及改进。(a)在大GDD情况下,原始SRSI算法能够提取相位的范围。(b)不同延迟下参考脉冲的光谱及其各自的相位差。(c)扣除拟合的一阶和零阶相位后的相位差。
Figure 15. Limitations and improvements of the SRSI algorithm. (a) Range over which the vanilla SRSI can extract phase in cases with large GDD. (b) Spectra of reference pulses with varied delays and their respective phase differences. (c) Phase difference after subtracting the fitted first and zeroth-order phases.
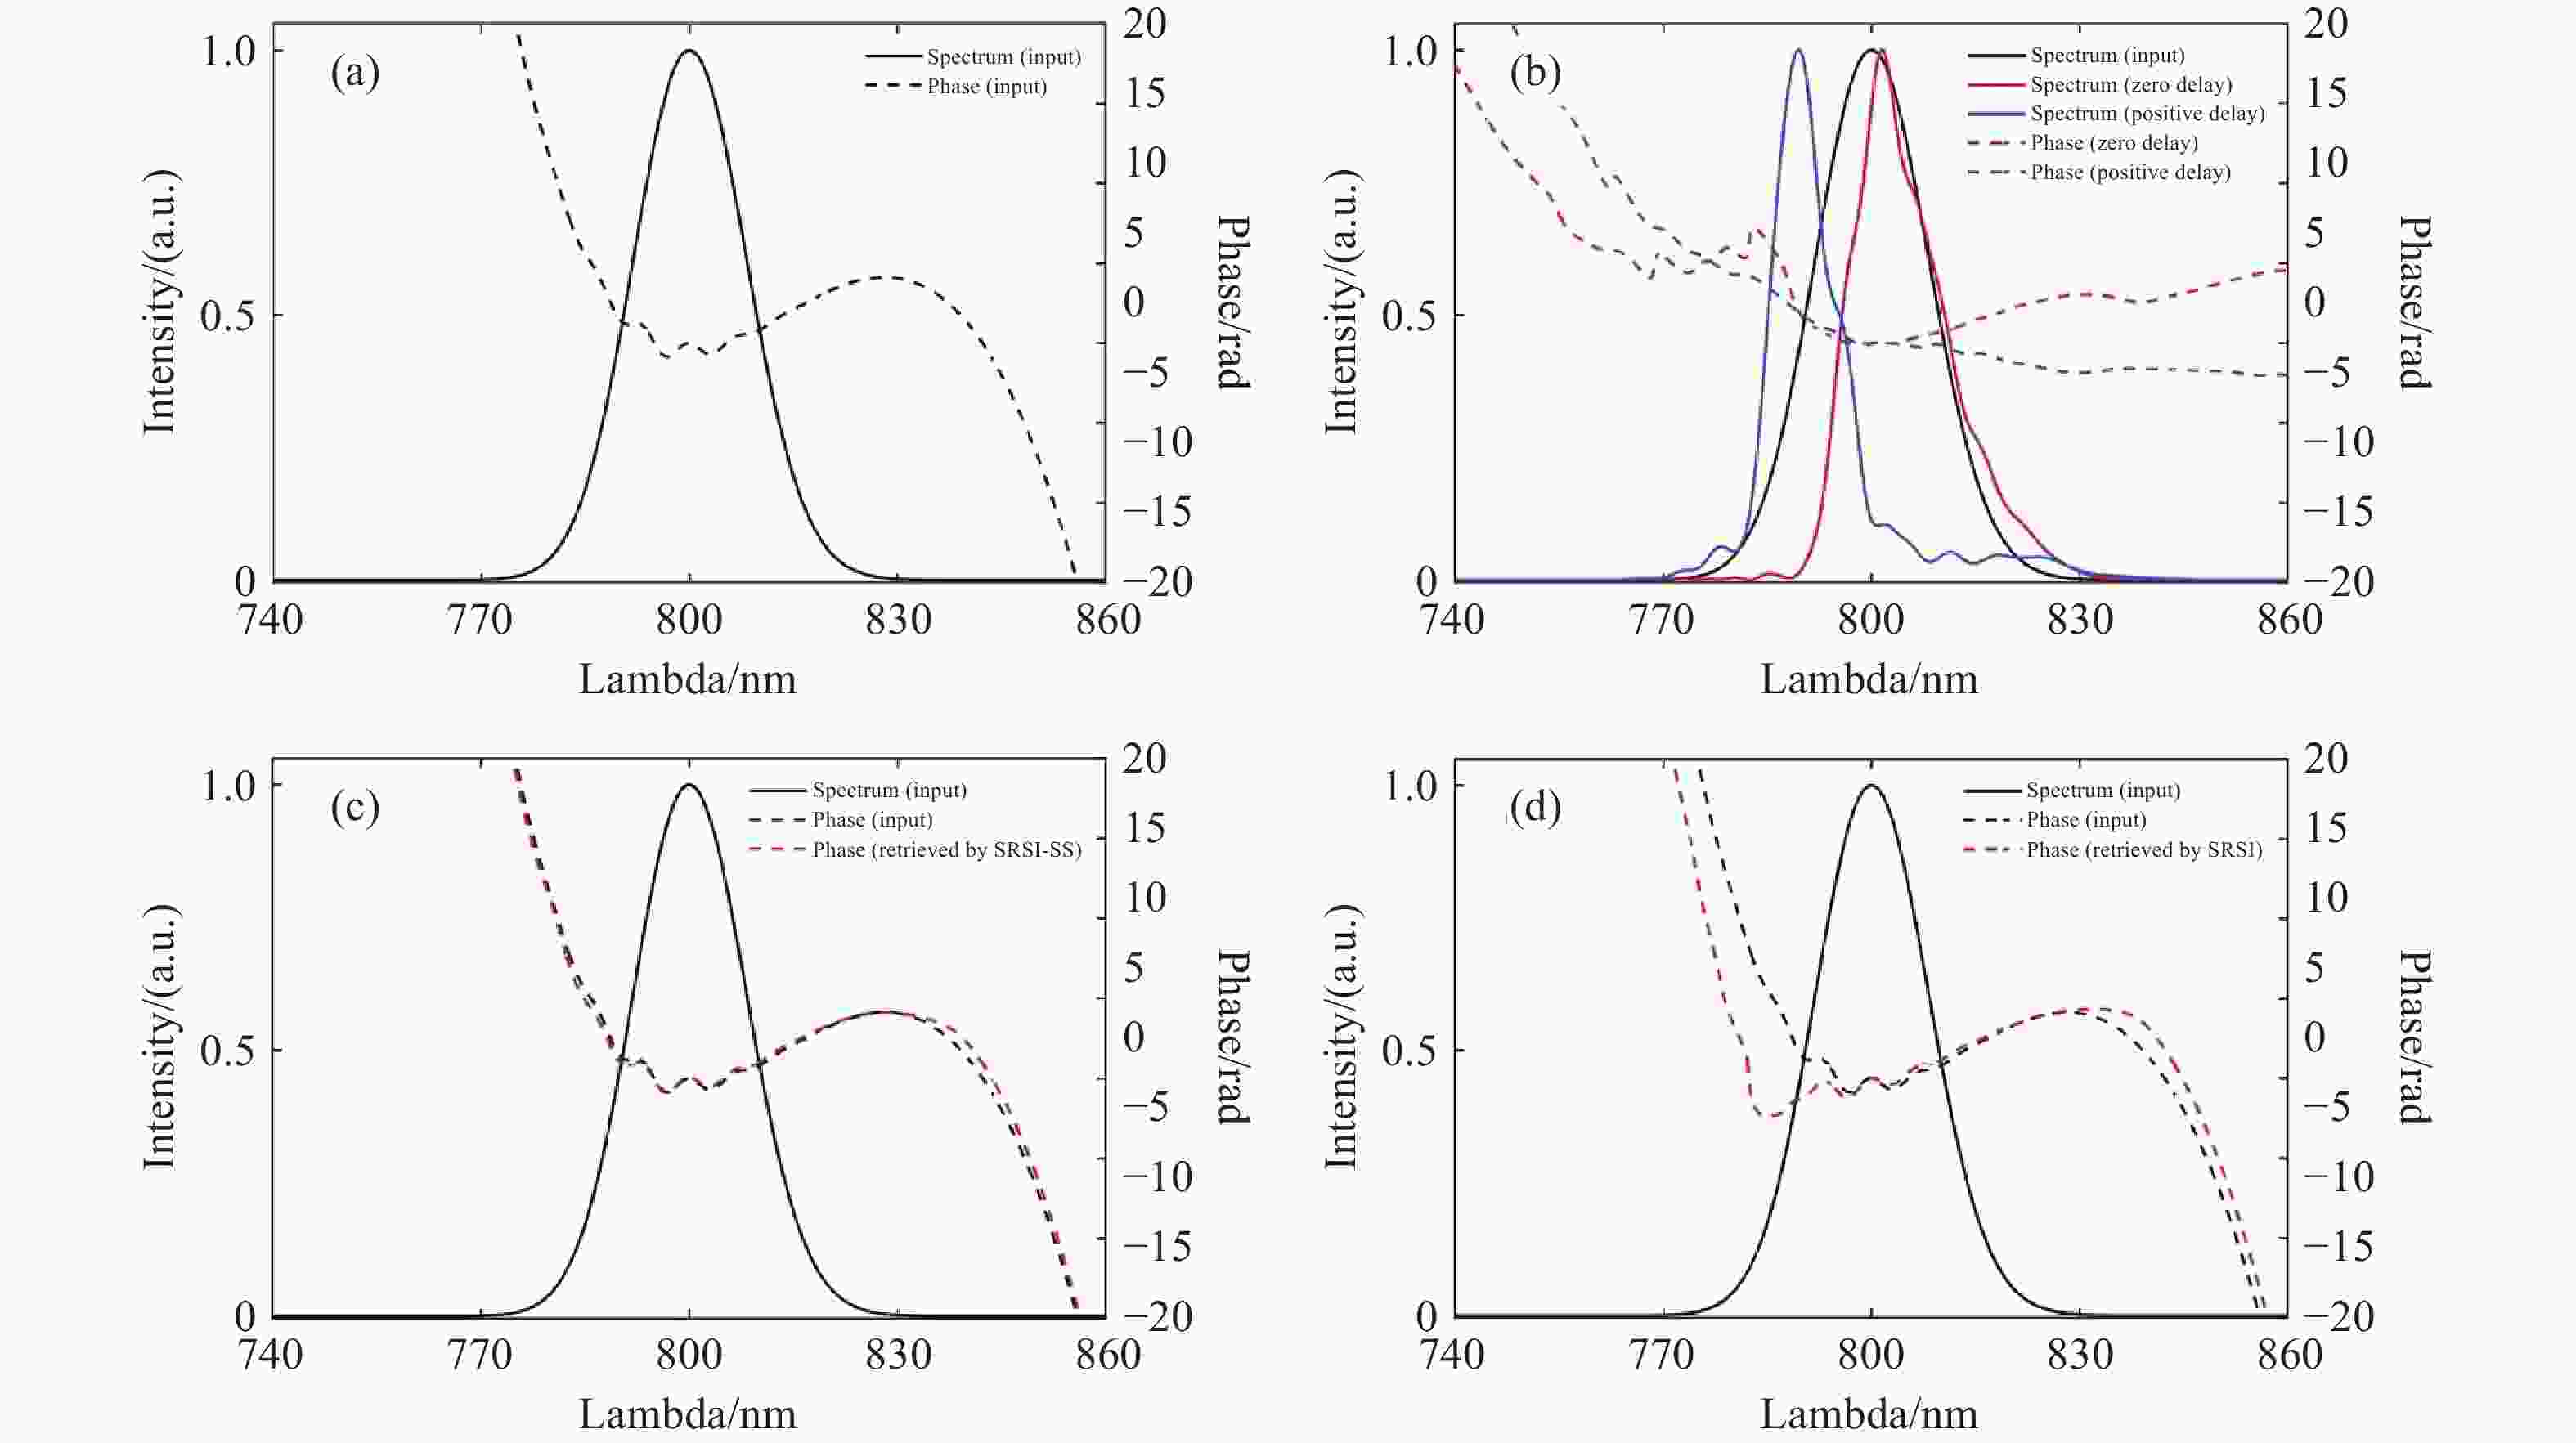
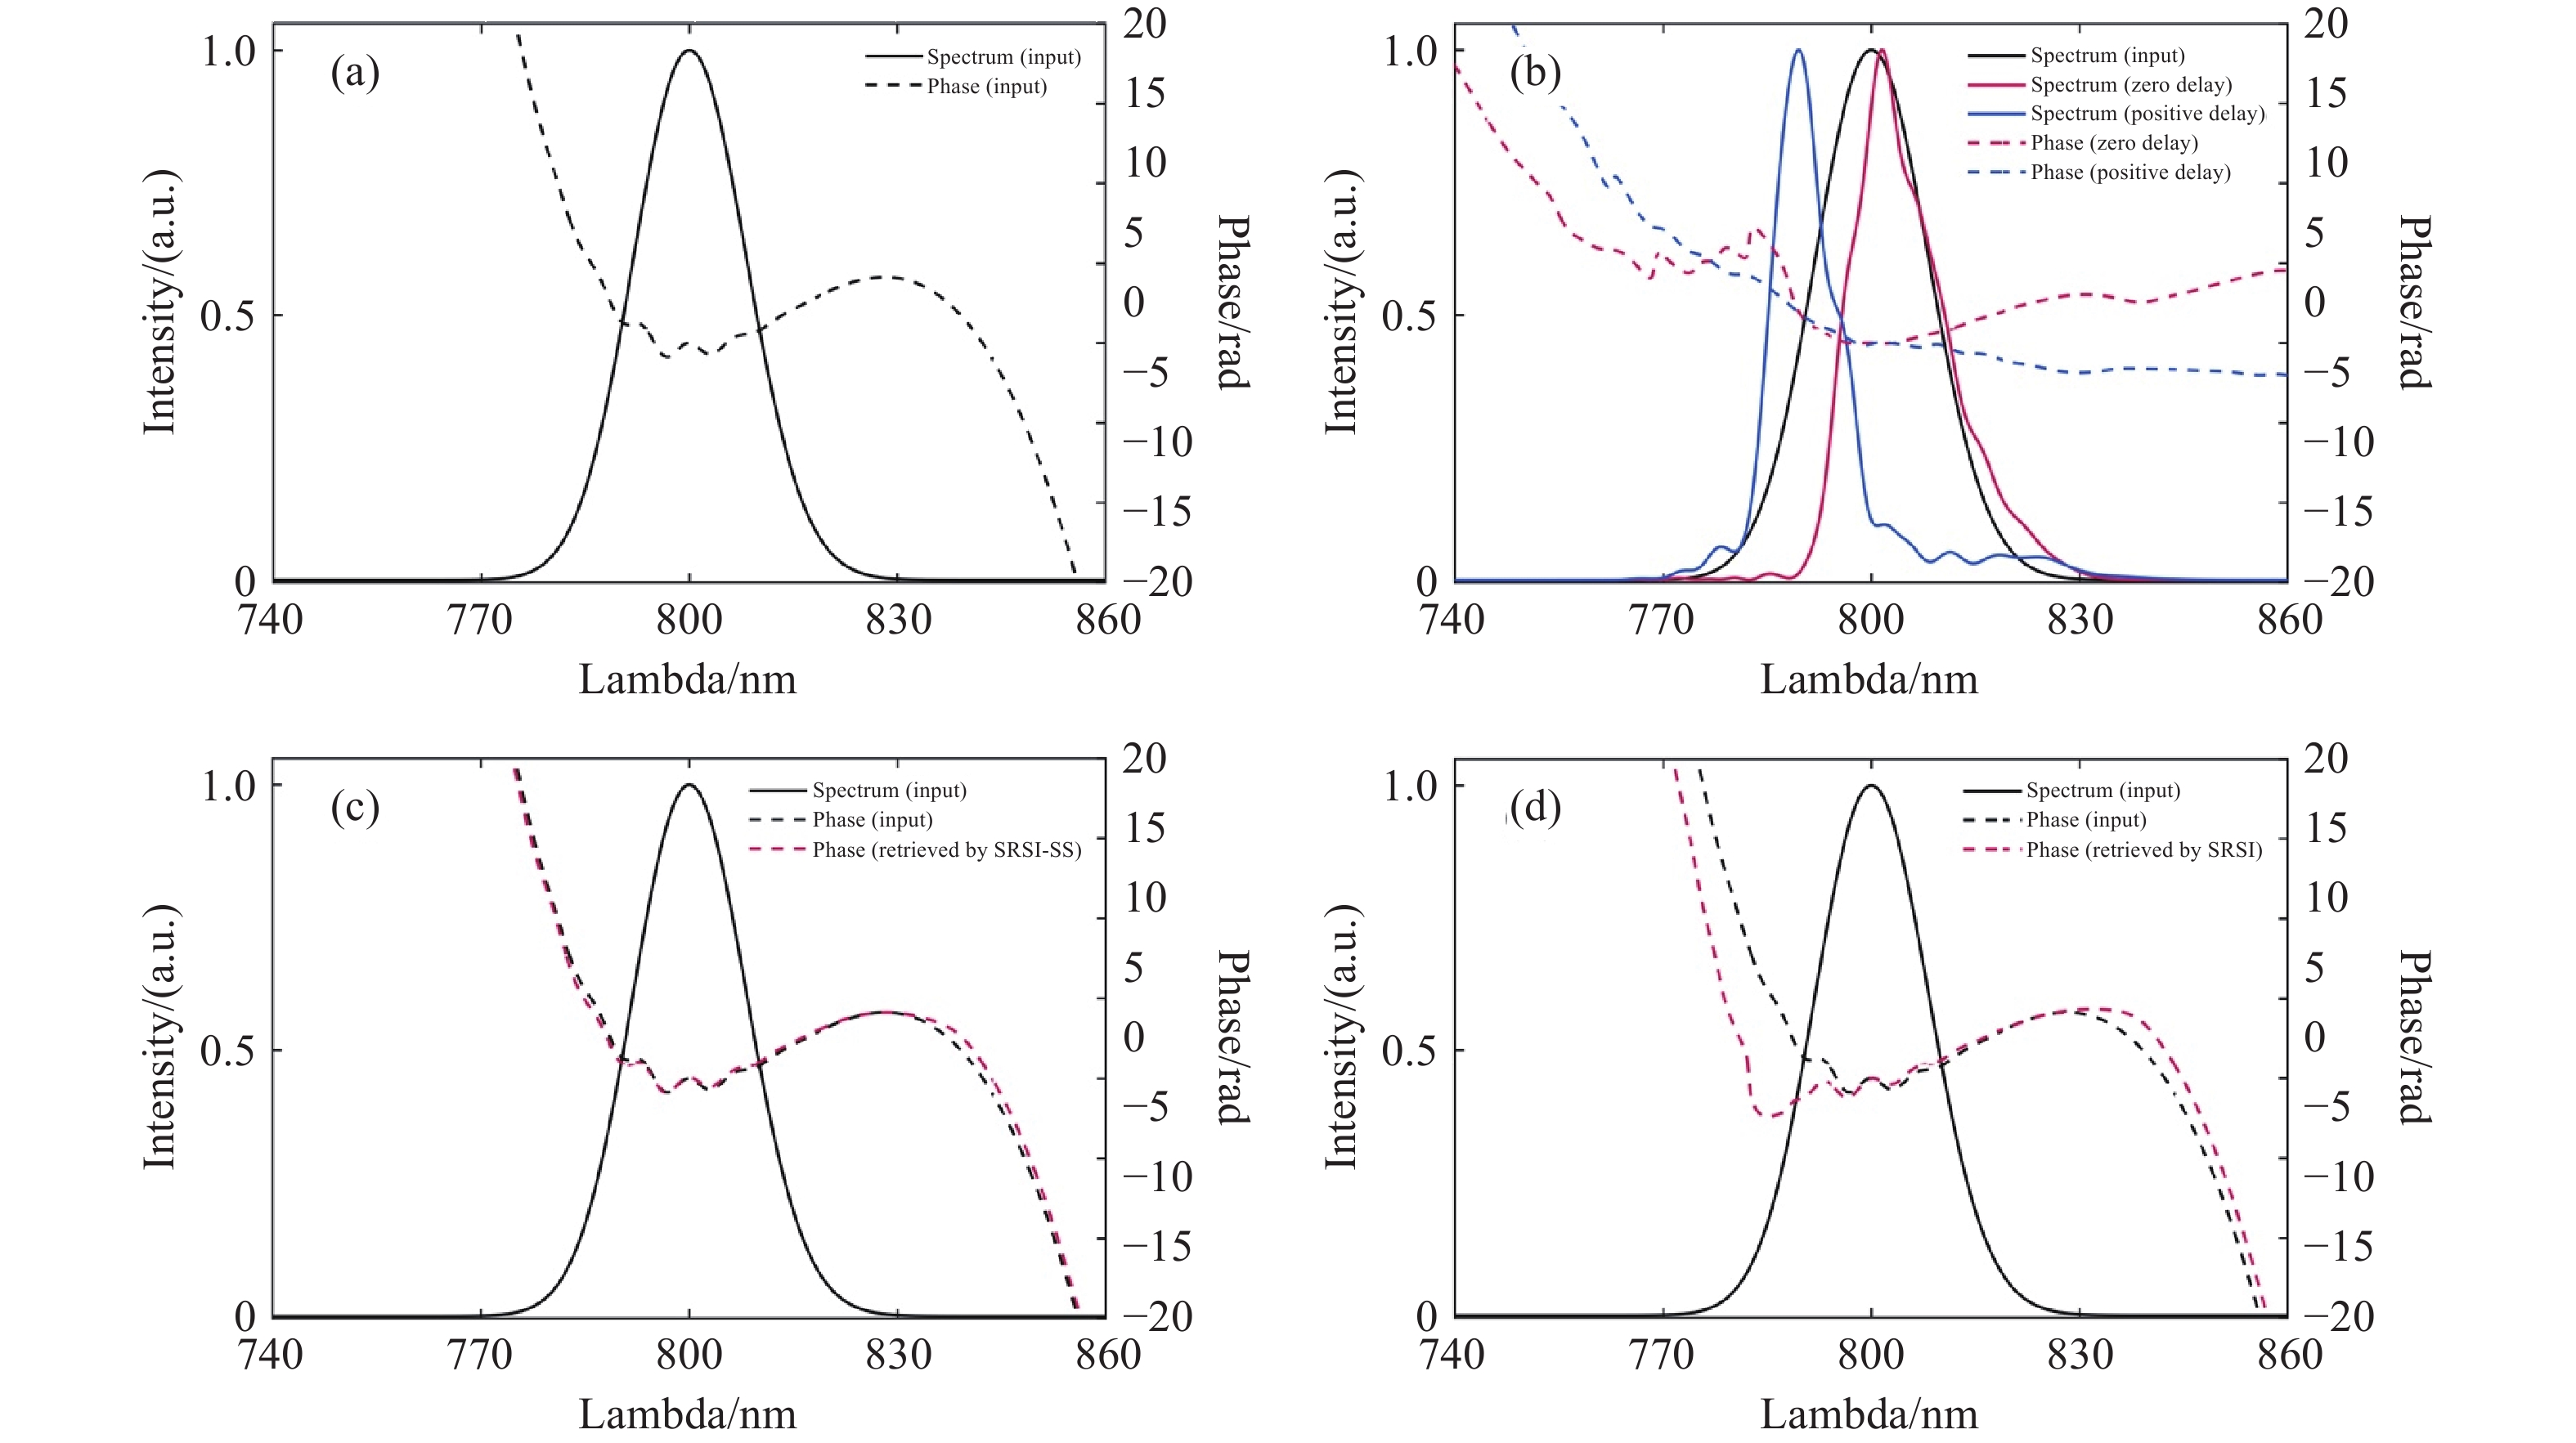
图 16 原始SRSI与改进型SRSI对具有高阶色散的大啁啾高斯脉冲的反演相位对比。(a)脉冲的模拟光谱轮廓。(b)由共轭脉冲在正延迟和零延迟下产生的参考脉冲的光谱相位曲线。所有光谱相位均已扣除一阶相位项,并在中心波长处设为零。(c)改进型SRSI反演得到的频谱相位。(d)SRSI反演得到的频谱相位[25]。
Figure 16. Comparison of the retrieved phase of vanilla SRSI and improved SRSI for large chirped Gaussian pulse with high order dispersion. (a) Simulated spectral profile the pulse. (b) Spectral profiles of the reference pulses generated by conjugate pulse with positive delay and zero delay. All spectral phases have subtracted the first-order phase term and set to zero at the center wavelength. (c) Retrieved spectral phase by improved SRSI. (d) Retrieved spectral phase by SRSI[25].
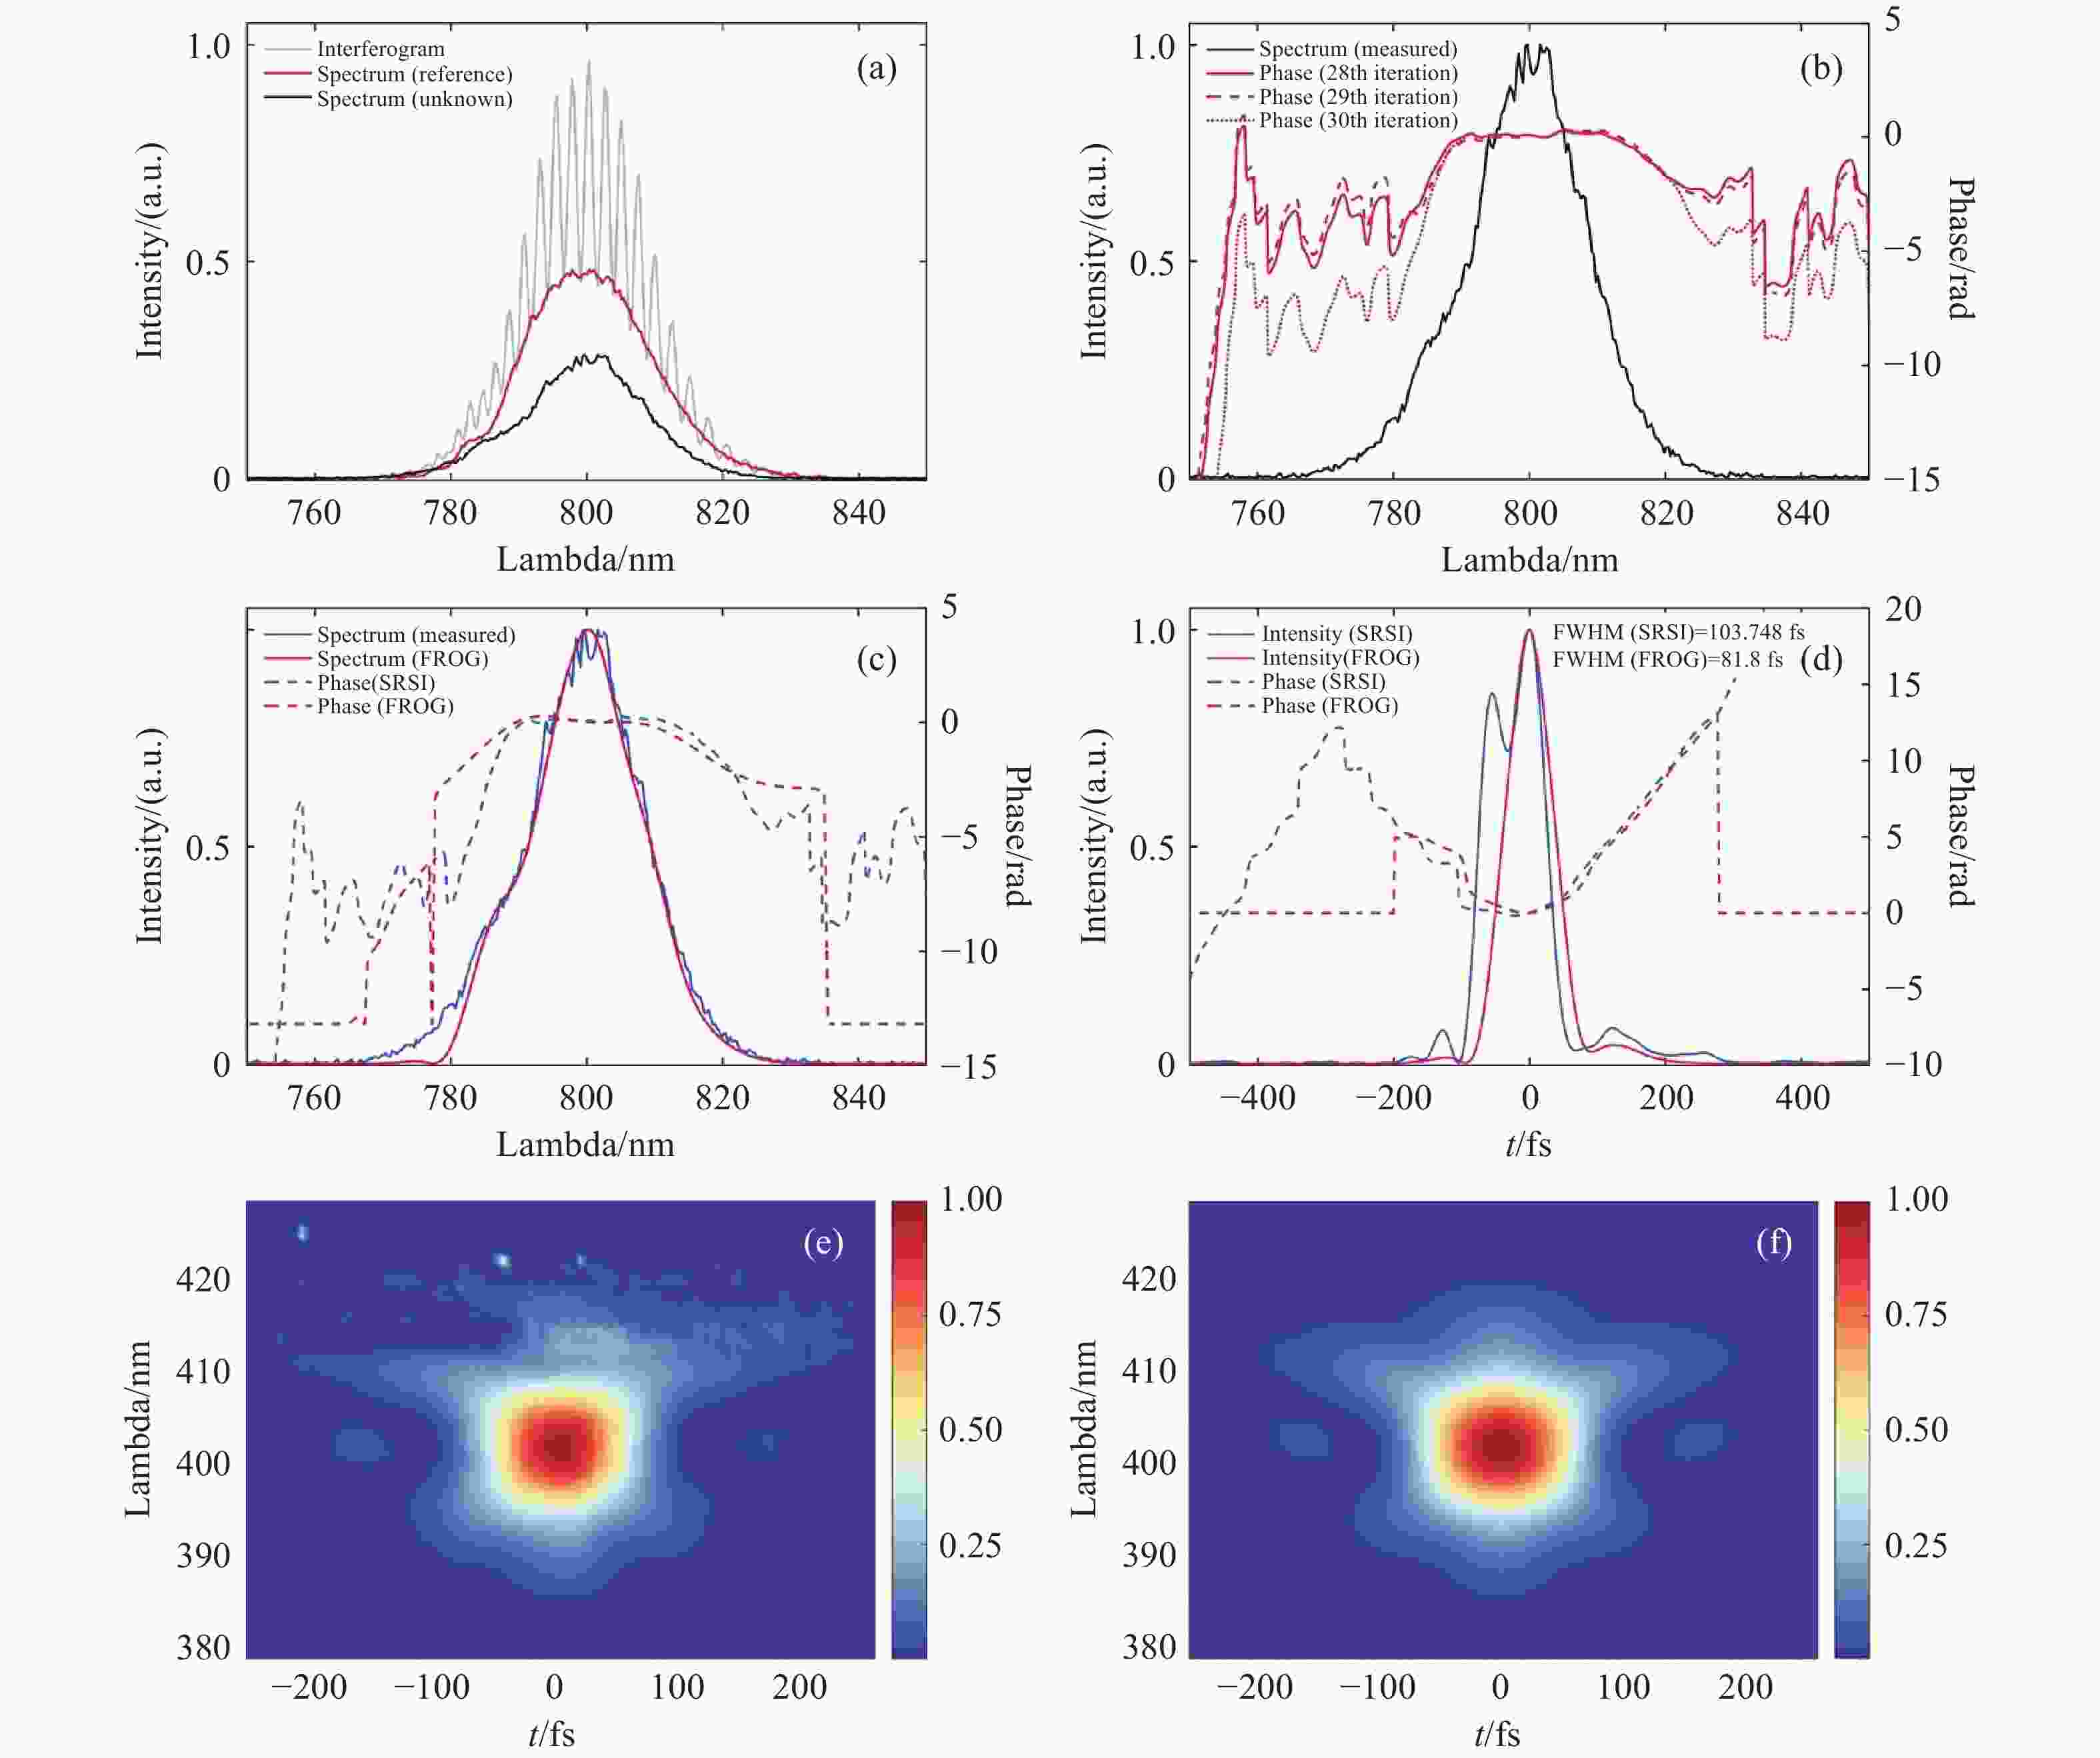
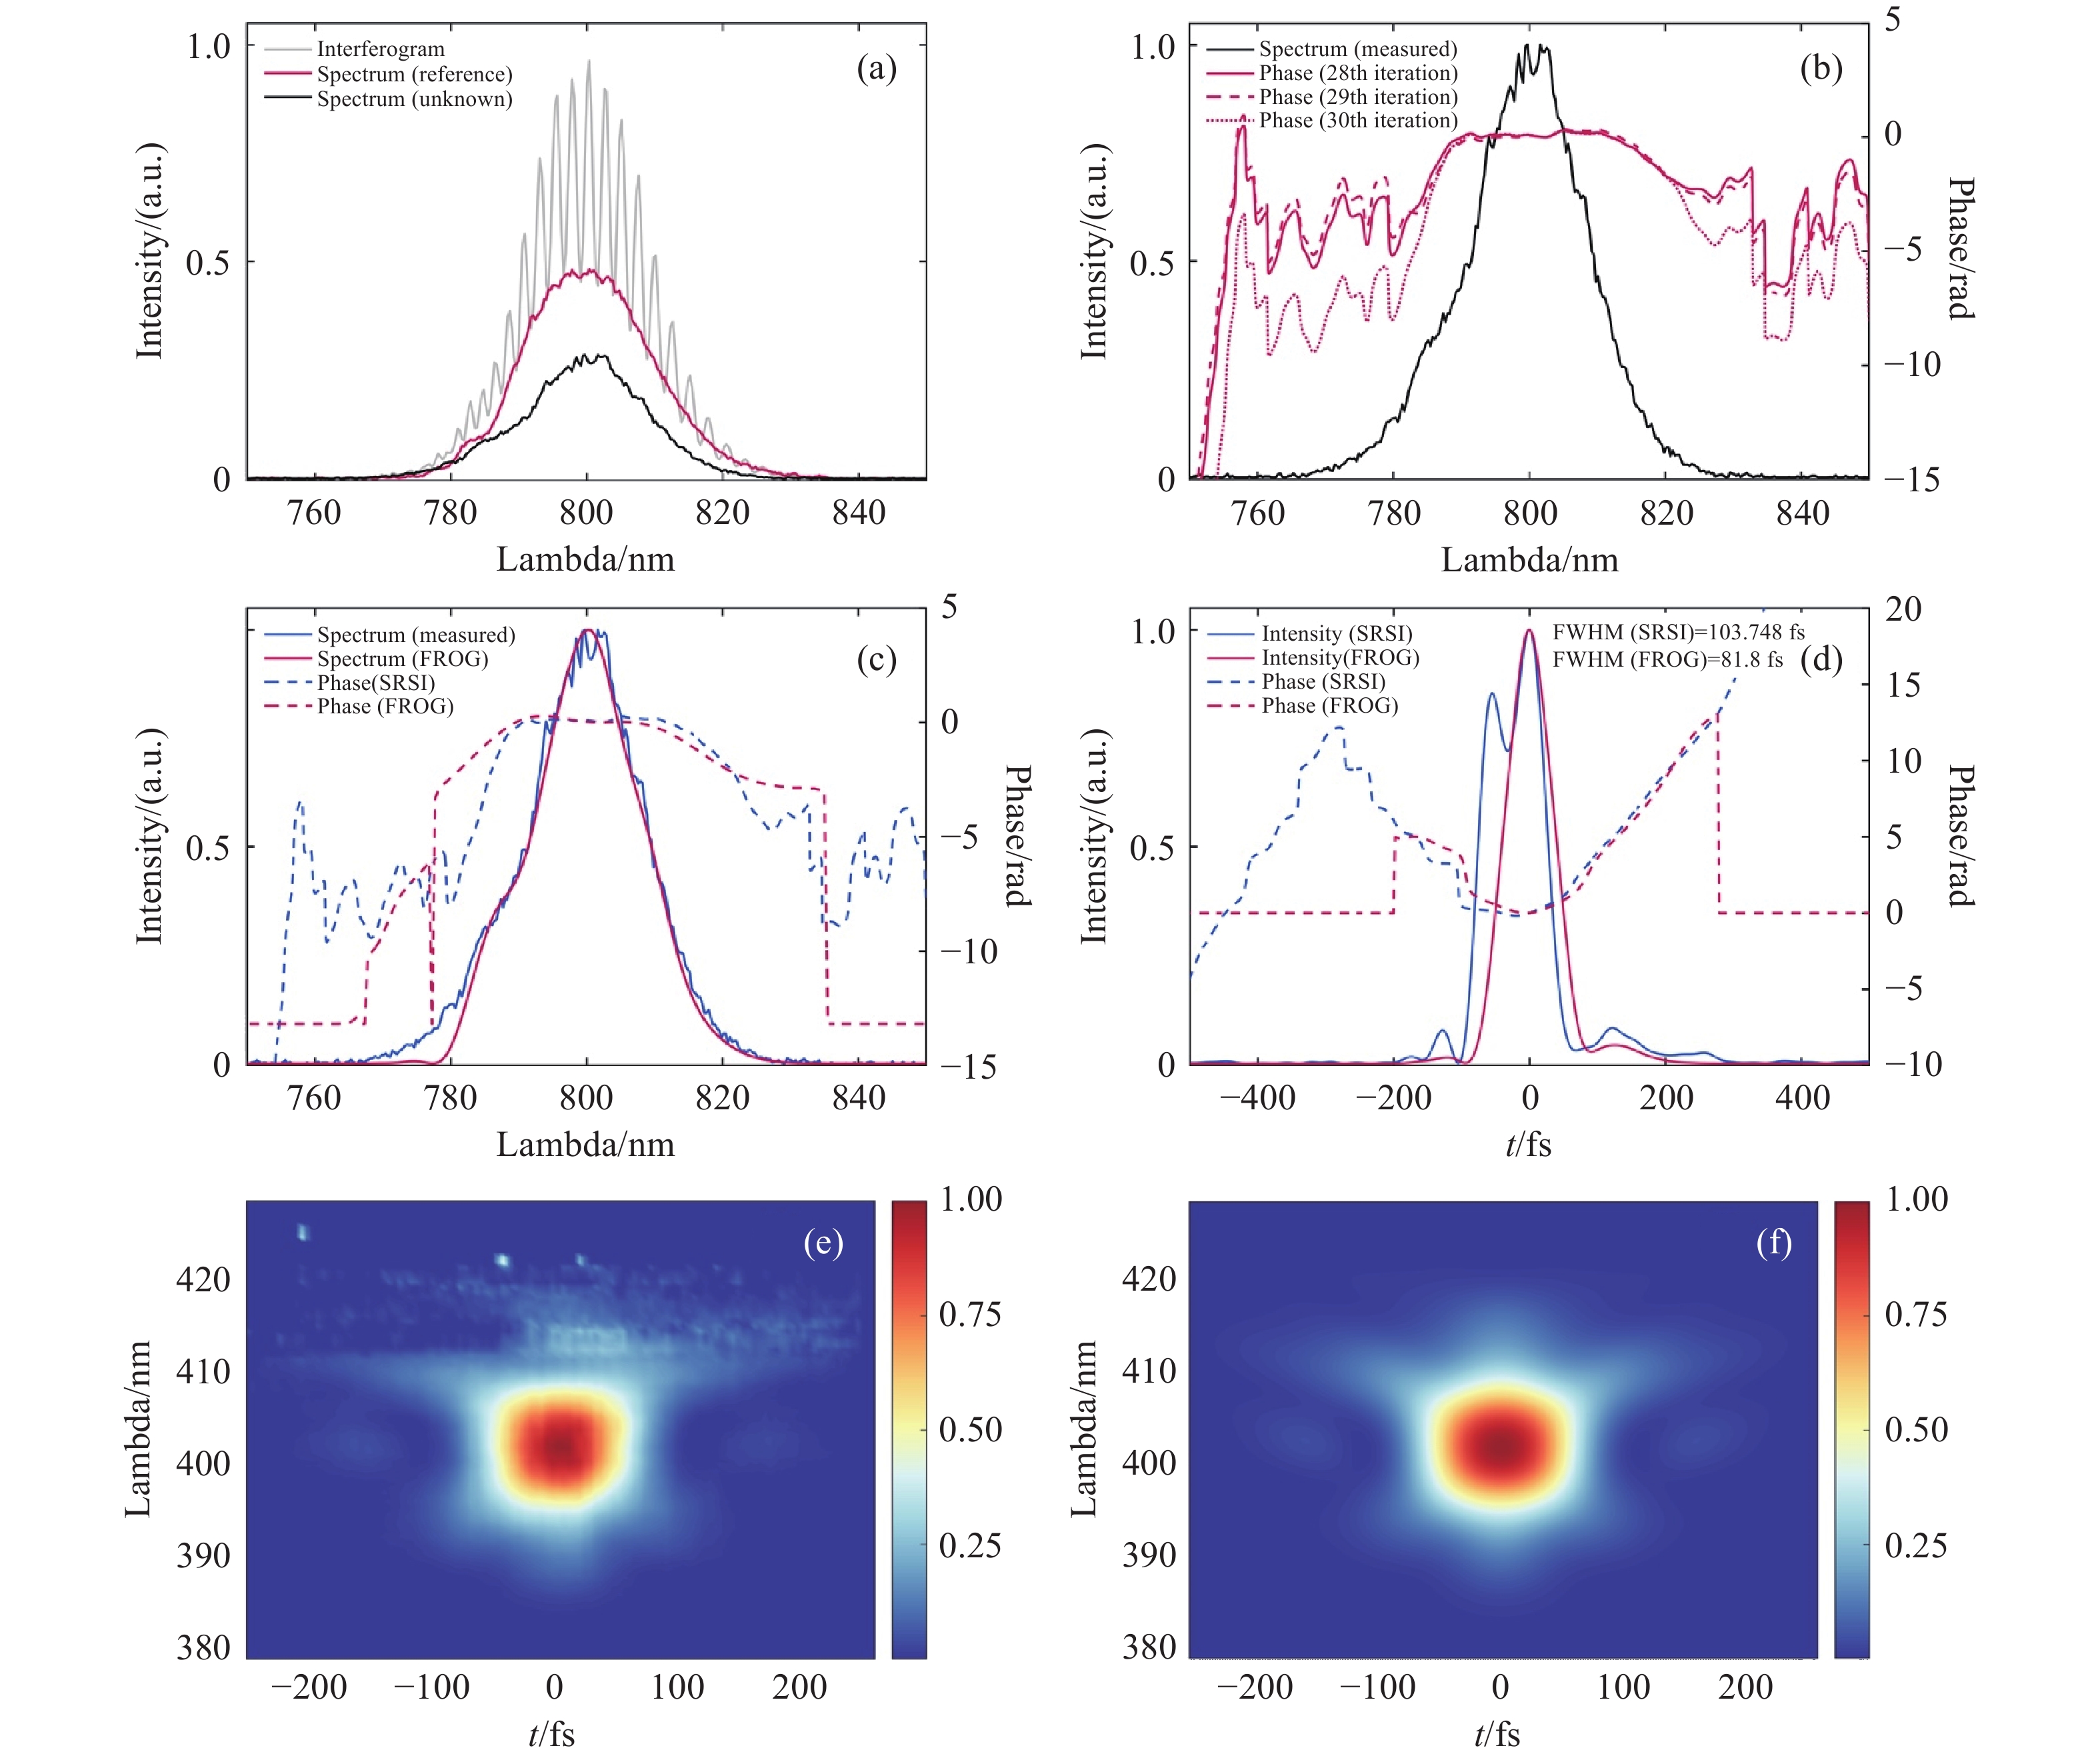
图 17 原始SRSI与FROG的测量结果对比。(a)测量得到的归一化光谱:干涉图、未知脉冲以及零延迟下产生的参考脉冲。(b)第28、29和30次迭代的频谱相位。(c)FROG测量和反演得到的光谱。原始SRSI和FROG反演得到的频谱相位。(d)原始SRSI和FROG反演得到的未知脉冲时域波形。(e,f)测量和反演得到的FROG轨迹图[25]。
Figure 17. Measurement results of vanilla SRSI and FROG. (a) Measured normalized spectra of interferogram, unknown pulse, and reference pulse generated with zero delay. (b) Spectral phases of 28th, 29th, and 30th iterations. (c) Measured and retrieved spectra by FROG. Spectral phases retrieved by vanilla SRSI and FROG. (d) Retrieved temporal profiles of unknown pulse by vanilla SRSI and FROG. (e, f) Measured and retrieved FROG traces[25].
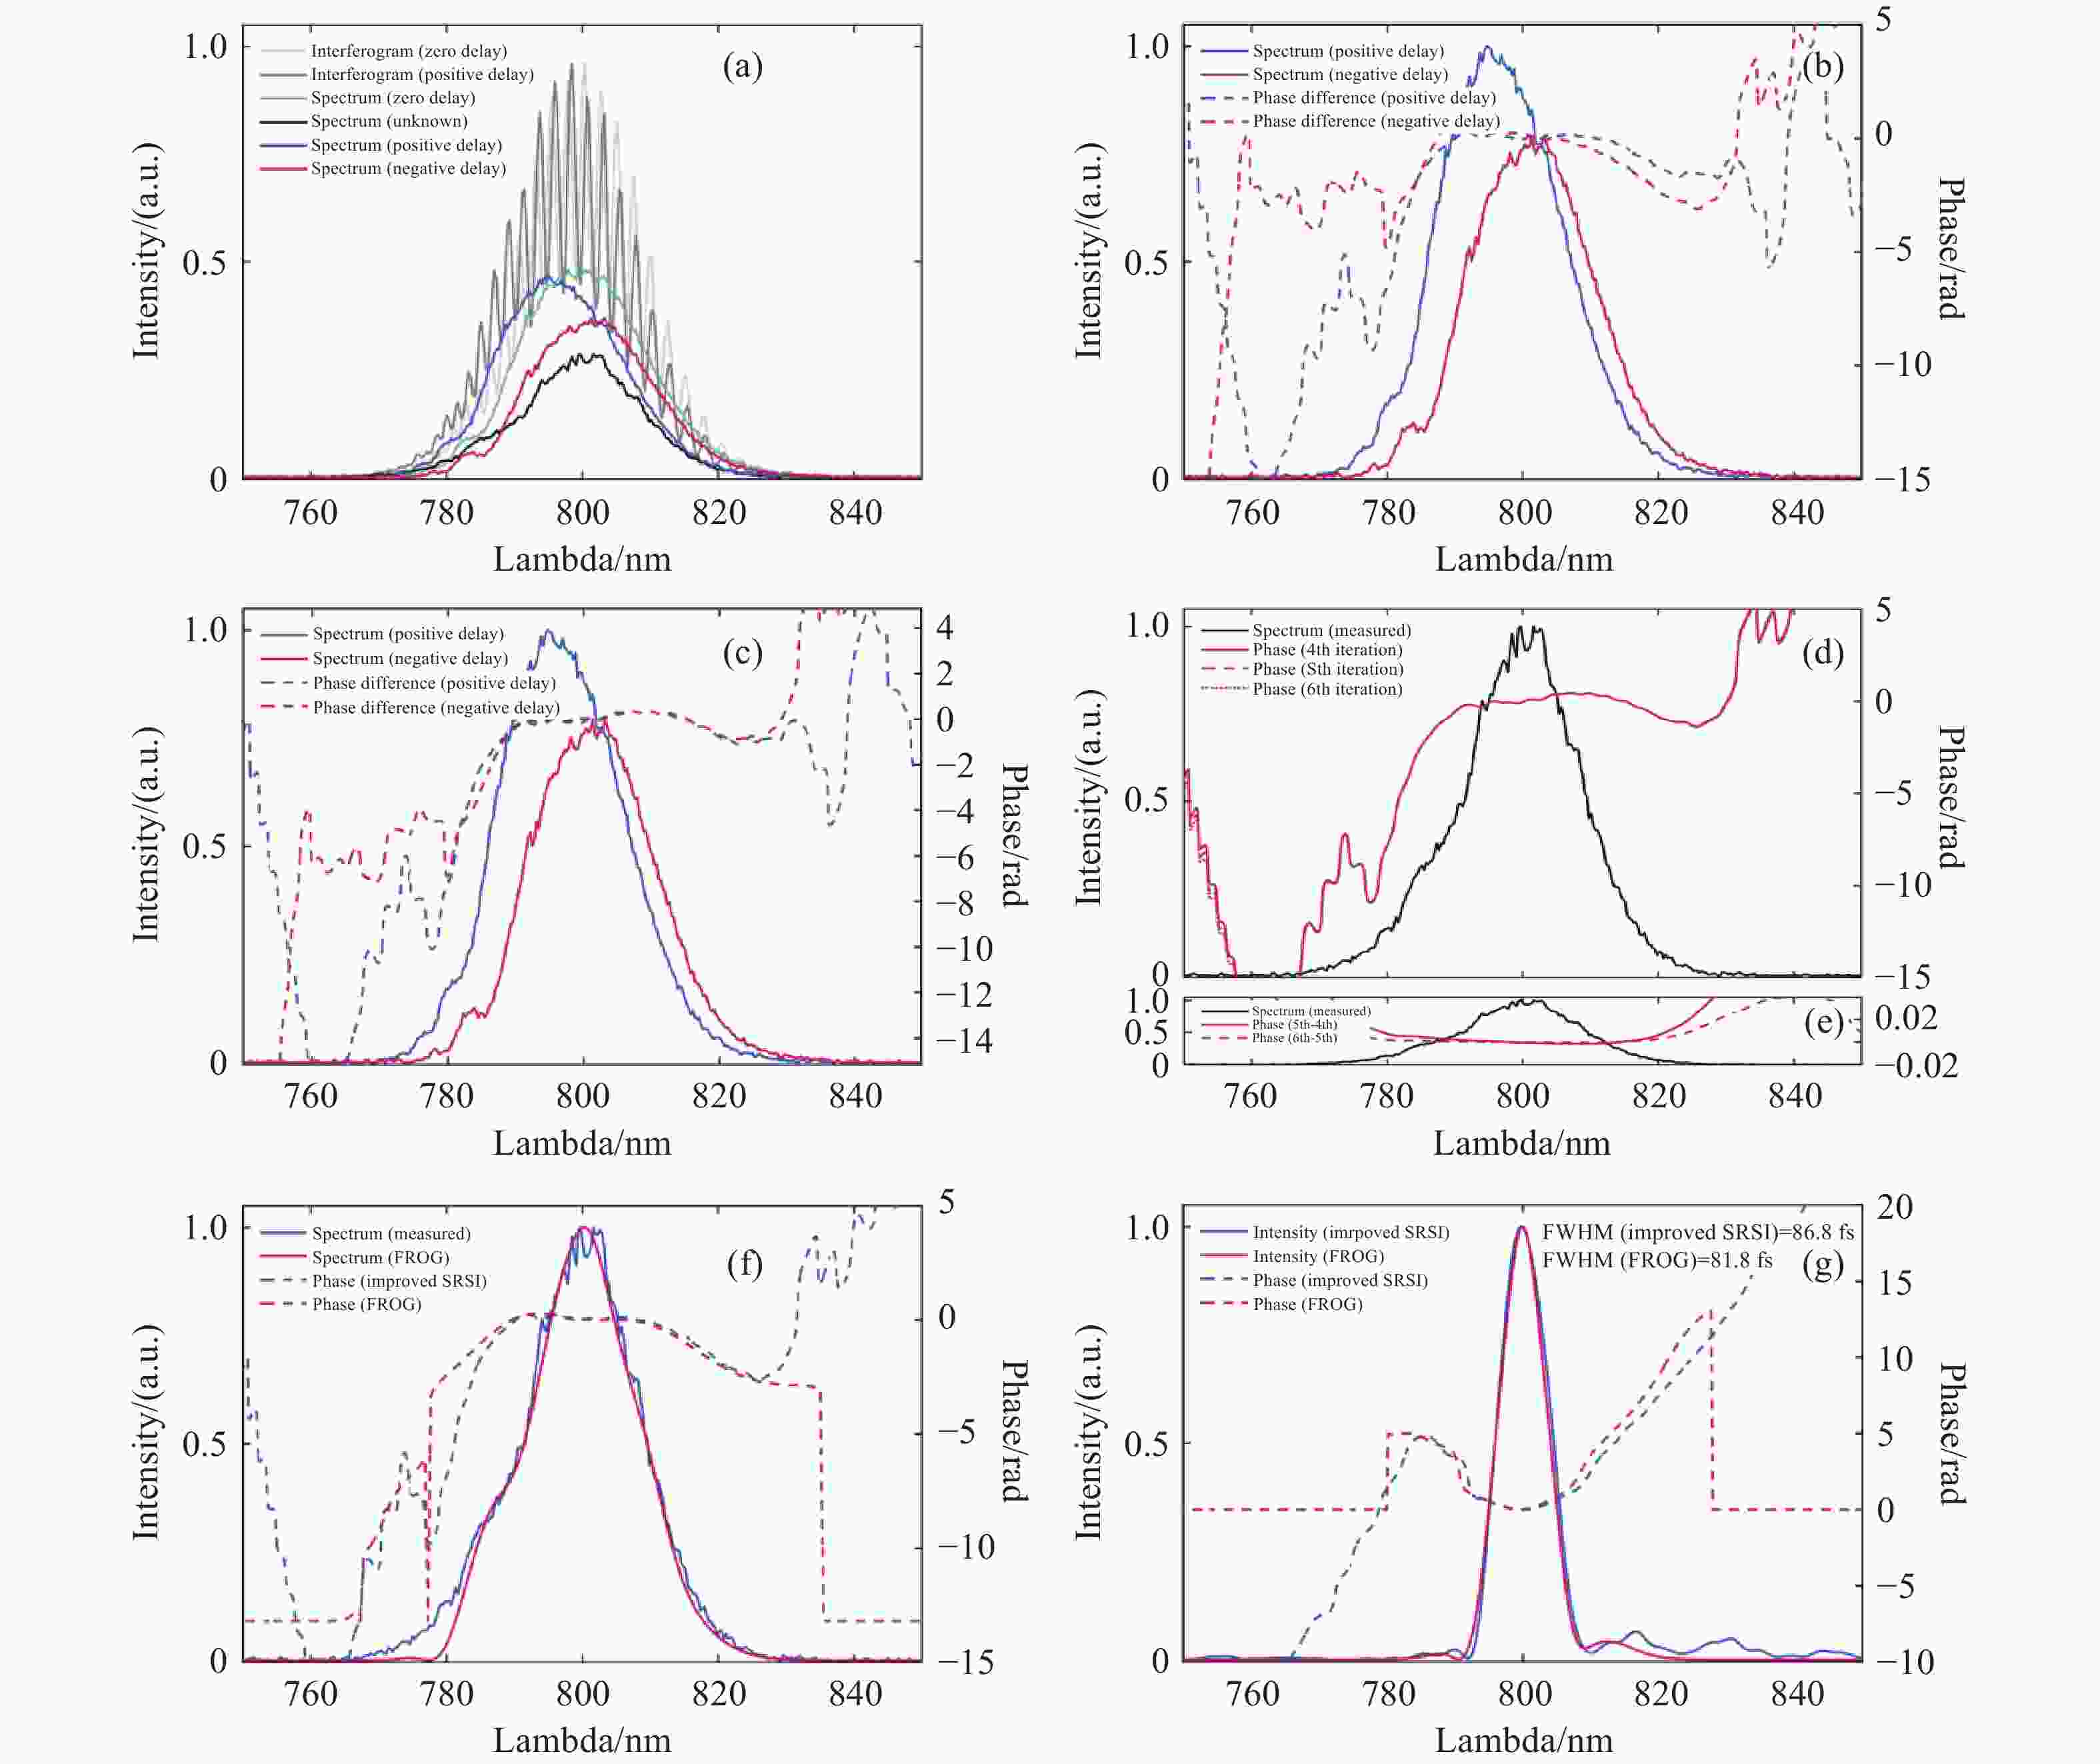
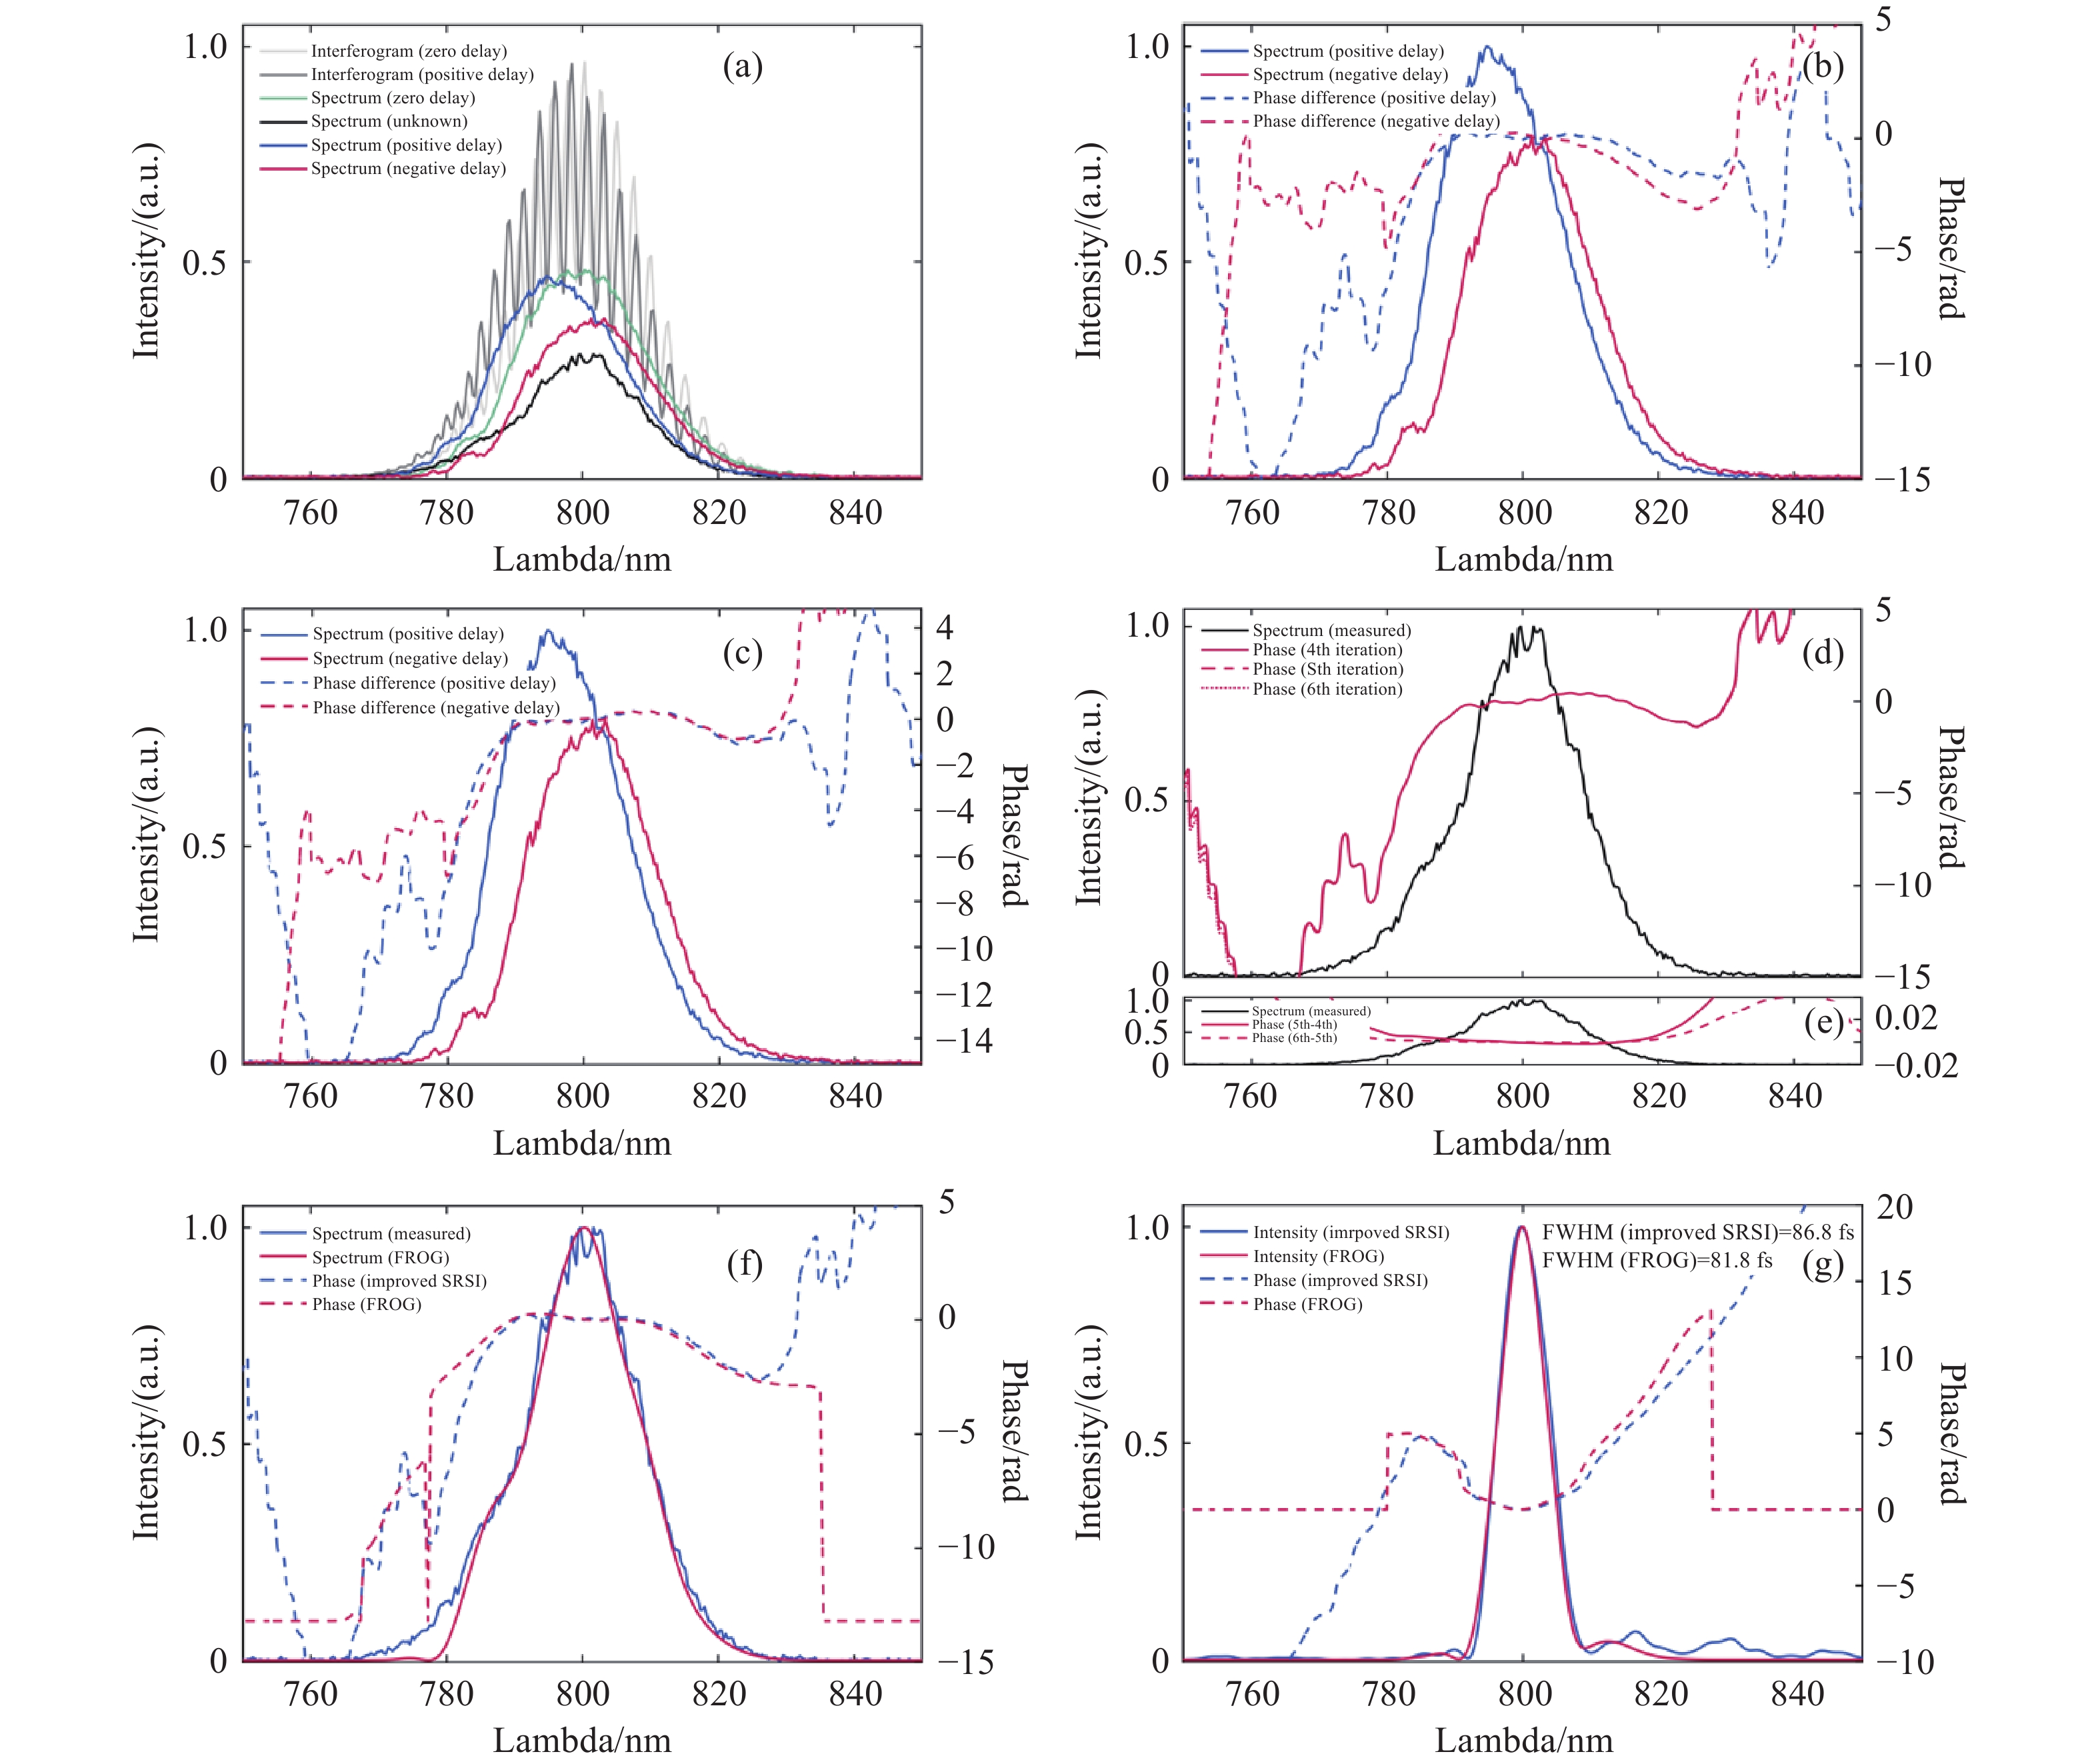
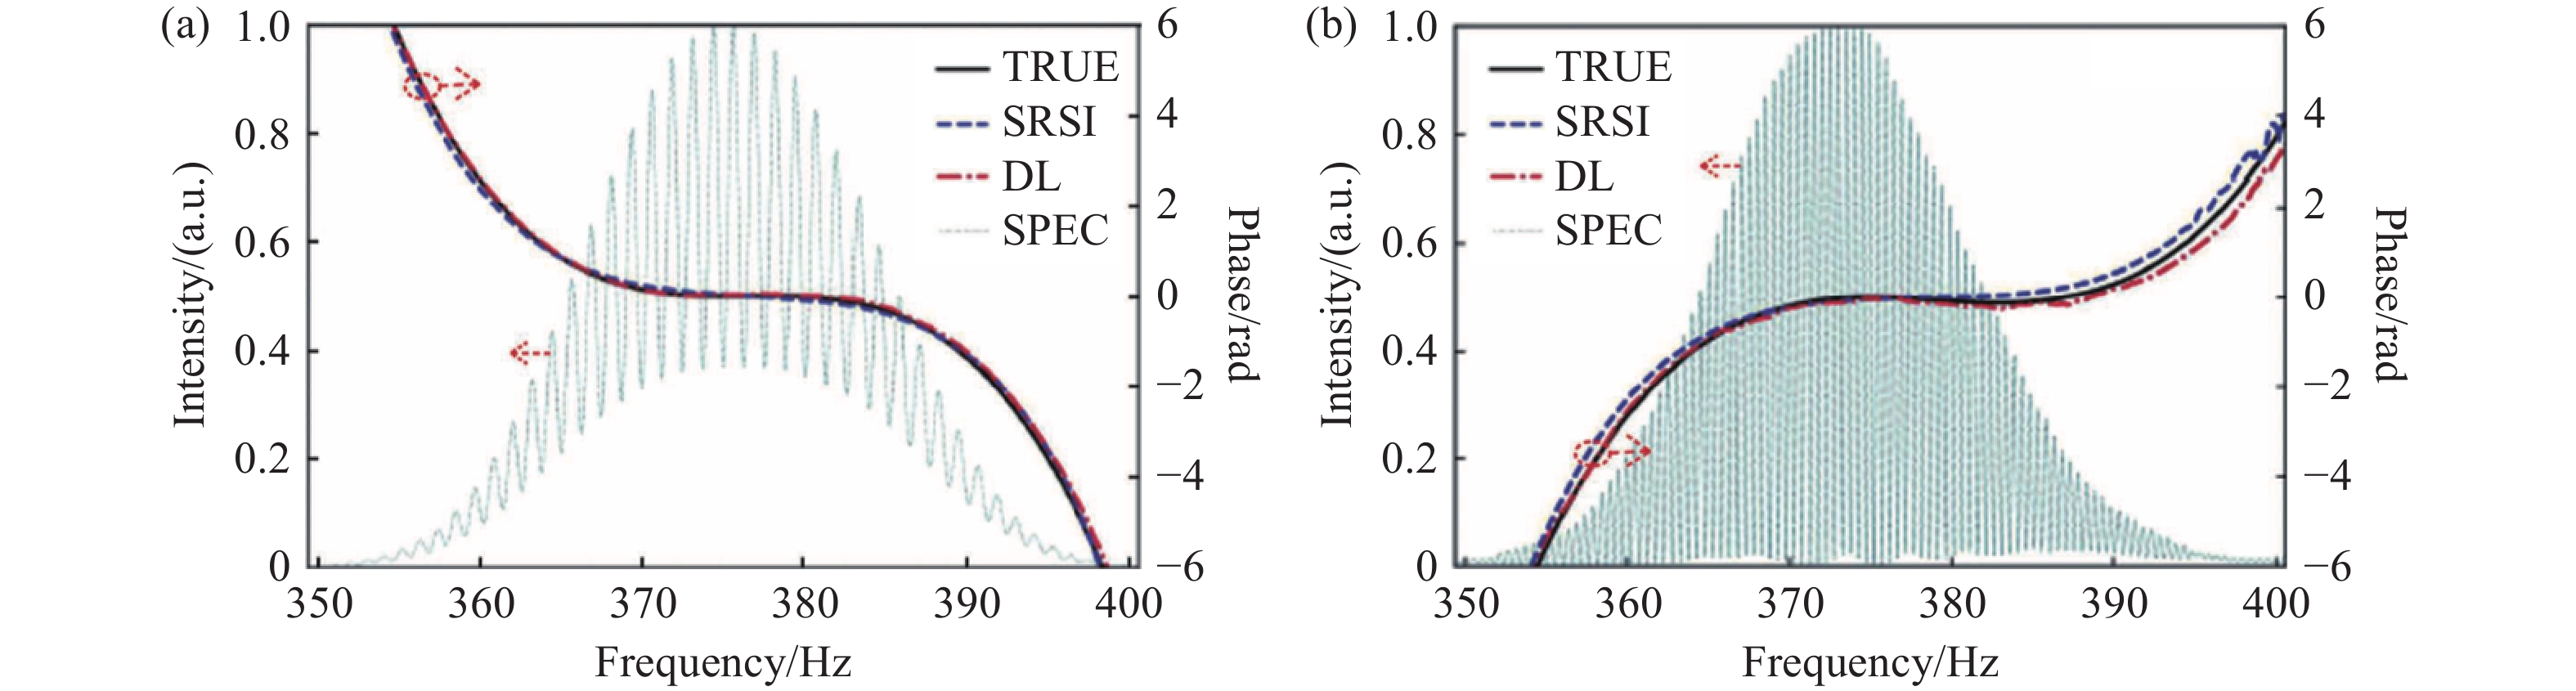
图 18 改进型SRSI的测量结果。(a)测量得到的归一化光谱:干涉图、未知脉冲和参考脉冲。(b)从负延迟和正延迟干涉图中提取的频谱相位。(c)扣除一阶和零阶分量后的频谱相位。(d)第4次(红线)、第5次(红色虚线)和第6次(红色点线)迭代的频谱相位。(e)第4次与第5次迭代(红线)以及第5次与第6次迭代(红色虚线)的频谱相位差。(f)FROG测量和反演得到的光谱。改进型SRSI和FROG反演得到的频谱相位。(g)改进型SRSI和FROG反演得到的时域波形[25]。
Figure 18. Measurement results by improved SRSI. (a) Measured normalized spectra of interferograms, unknown pulse, and reference pulses. (b) Spectral phases extracted from interferograms with negative and positive delay (c) Spectral phases after subtracted the first-order and zero-order component. (d) Spectral phases of 4th (red line), 5th (red dashed line), and 6th (red dotted line) iterations. (e) Spectral phase differences of the 4th and 5th iterations (red line), and the 5th and 6th iterations (red dashed line). (f) Measured and retrieved spectra by FROG. Spectral phases retrieved by improved SRSI and FROG. (g) Retrieved temporal profiles by improved SRSI and FROG[25].
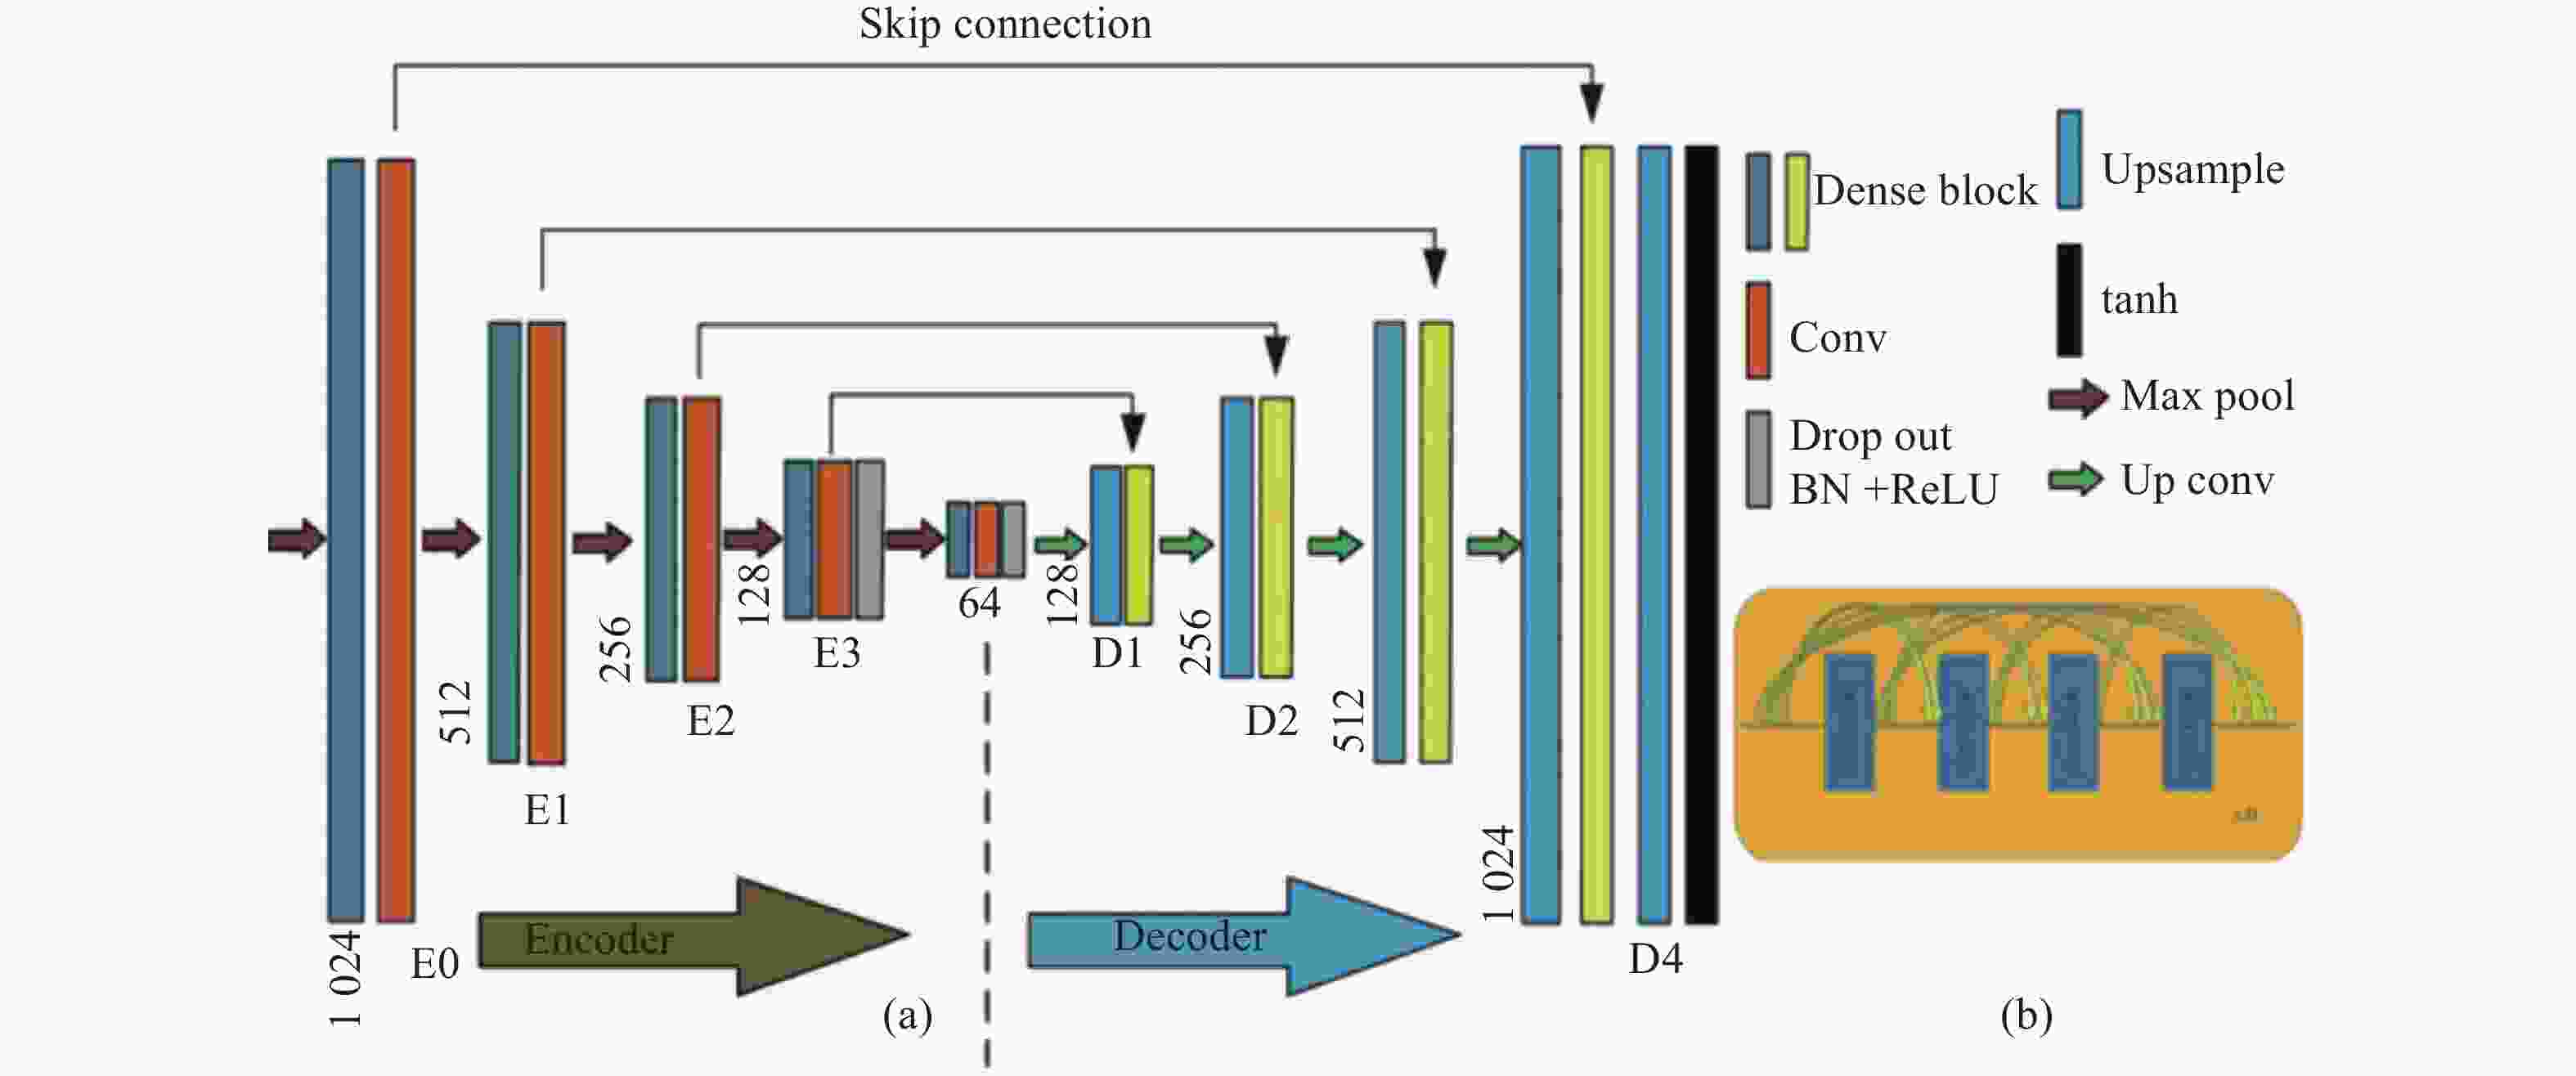
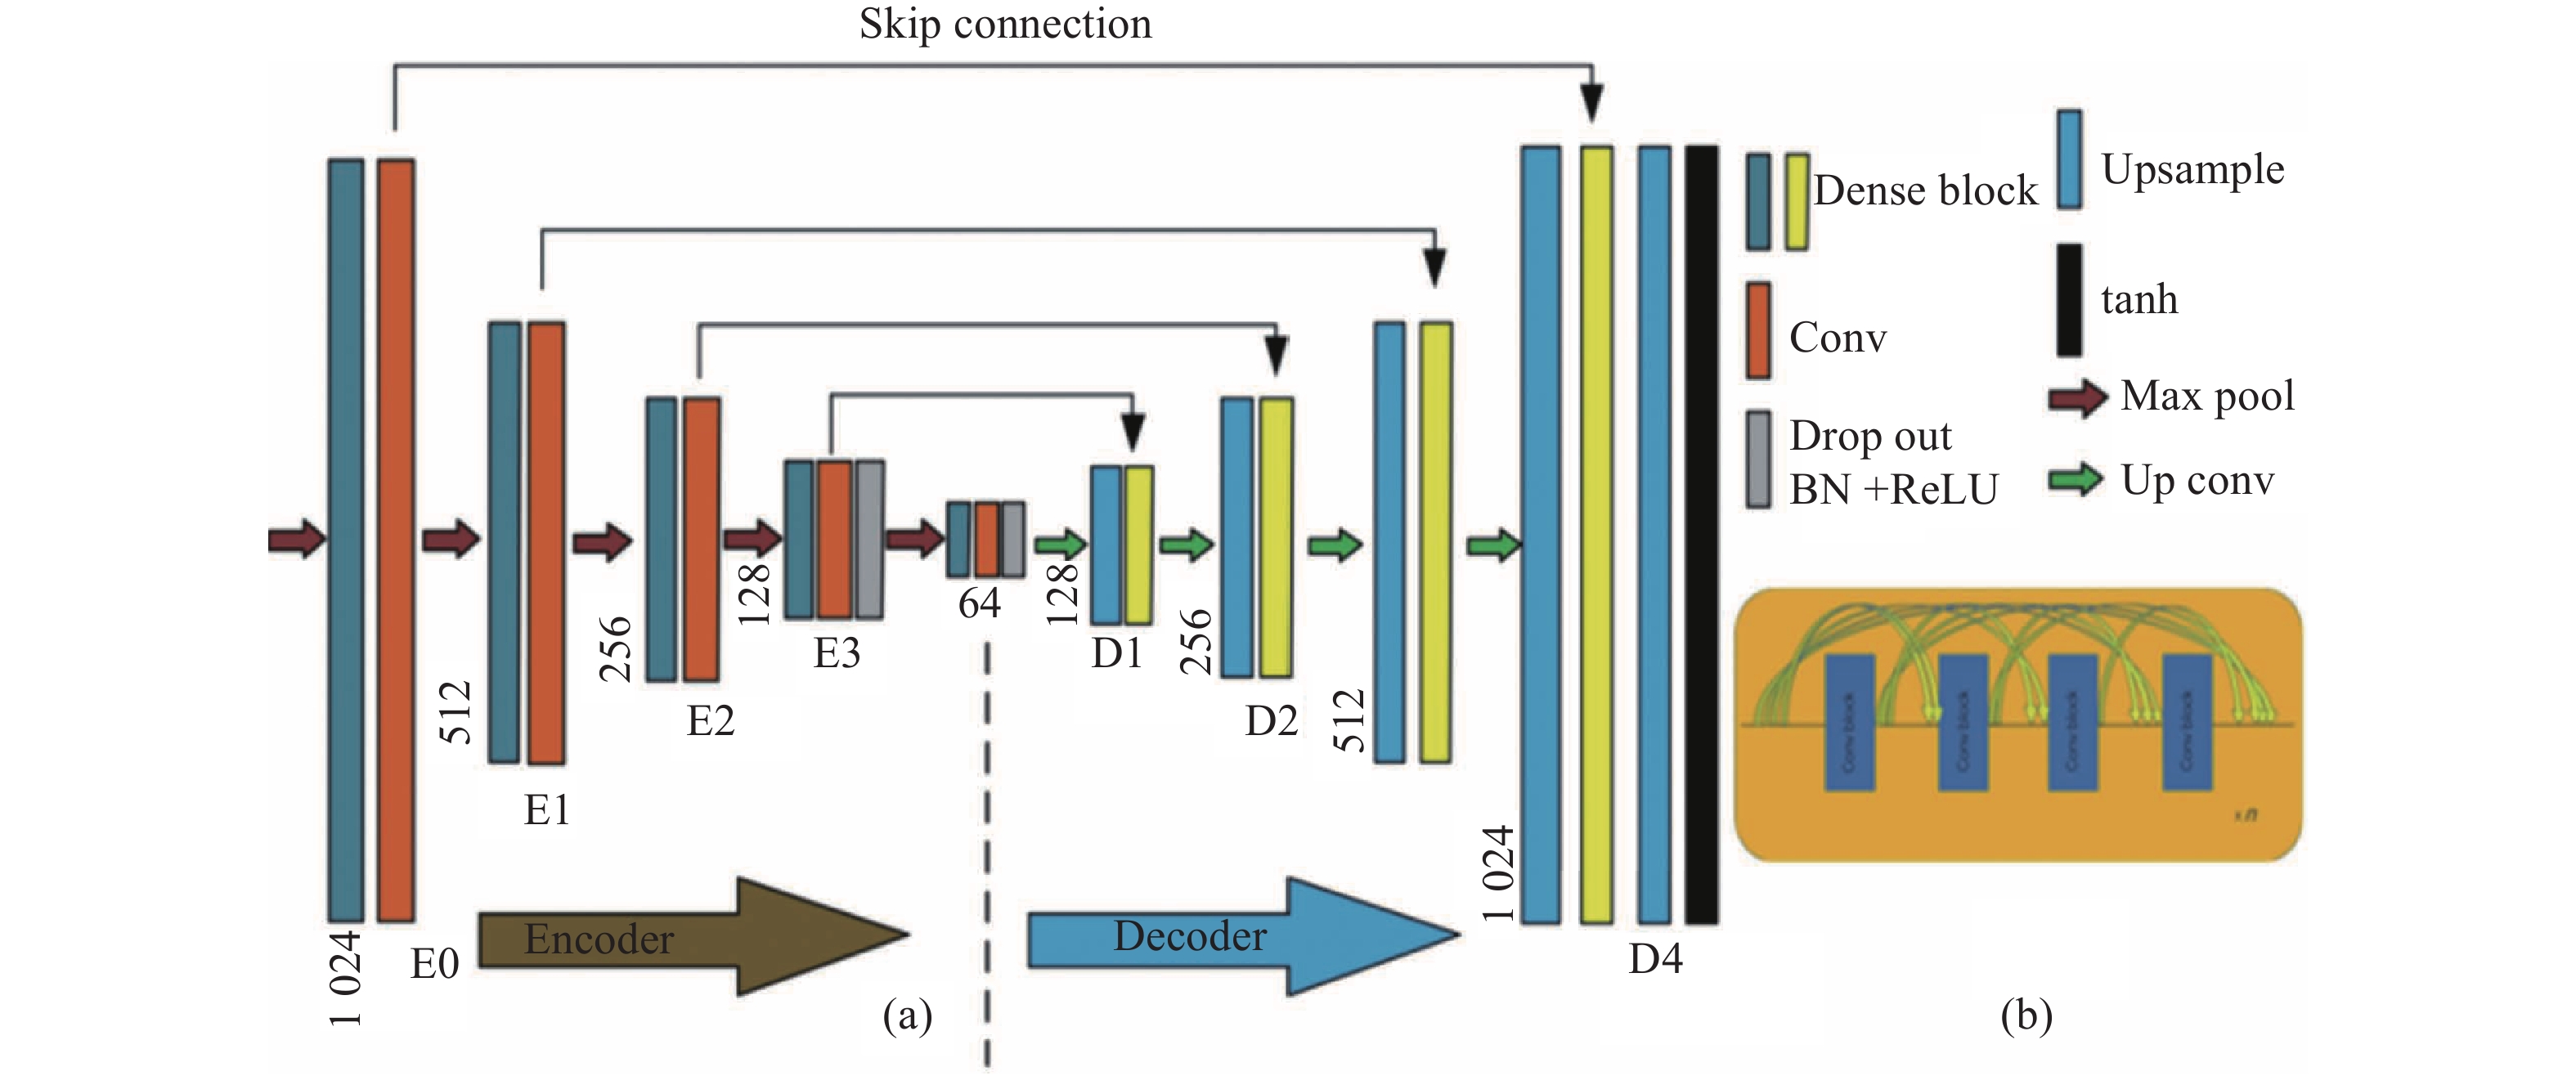
图 19 Dense-1D-U-Net神经网络。(a)神经网络整体结构;(b)稠密连接块结构
Figure 19. Dense-1D-U-Net neural network. (a) Overall network structure; (b) structure of dense block.
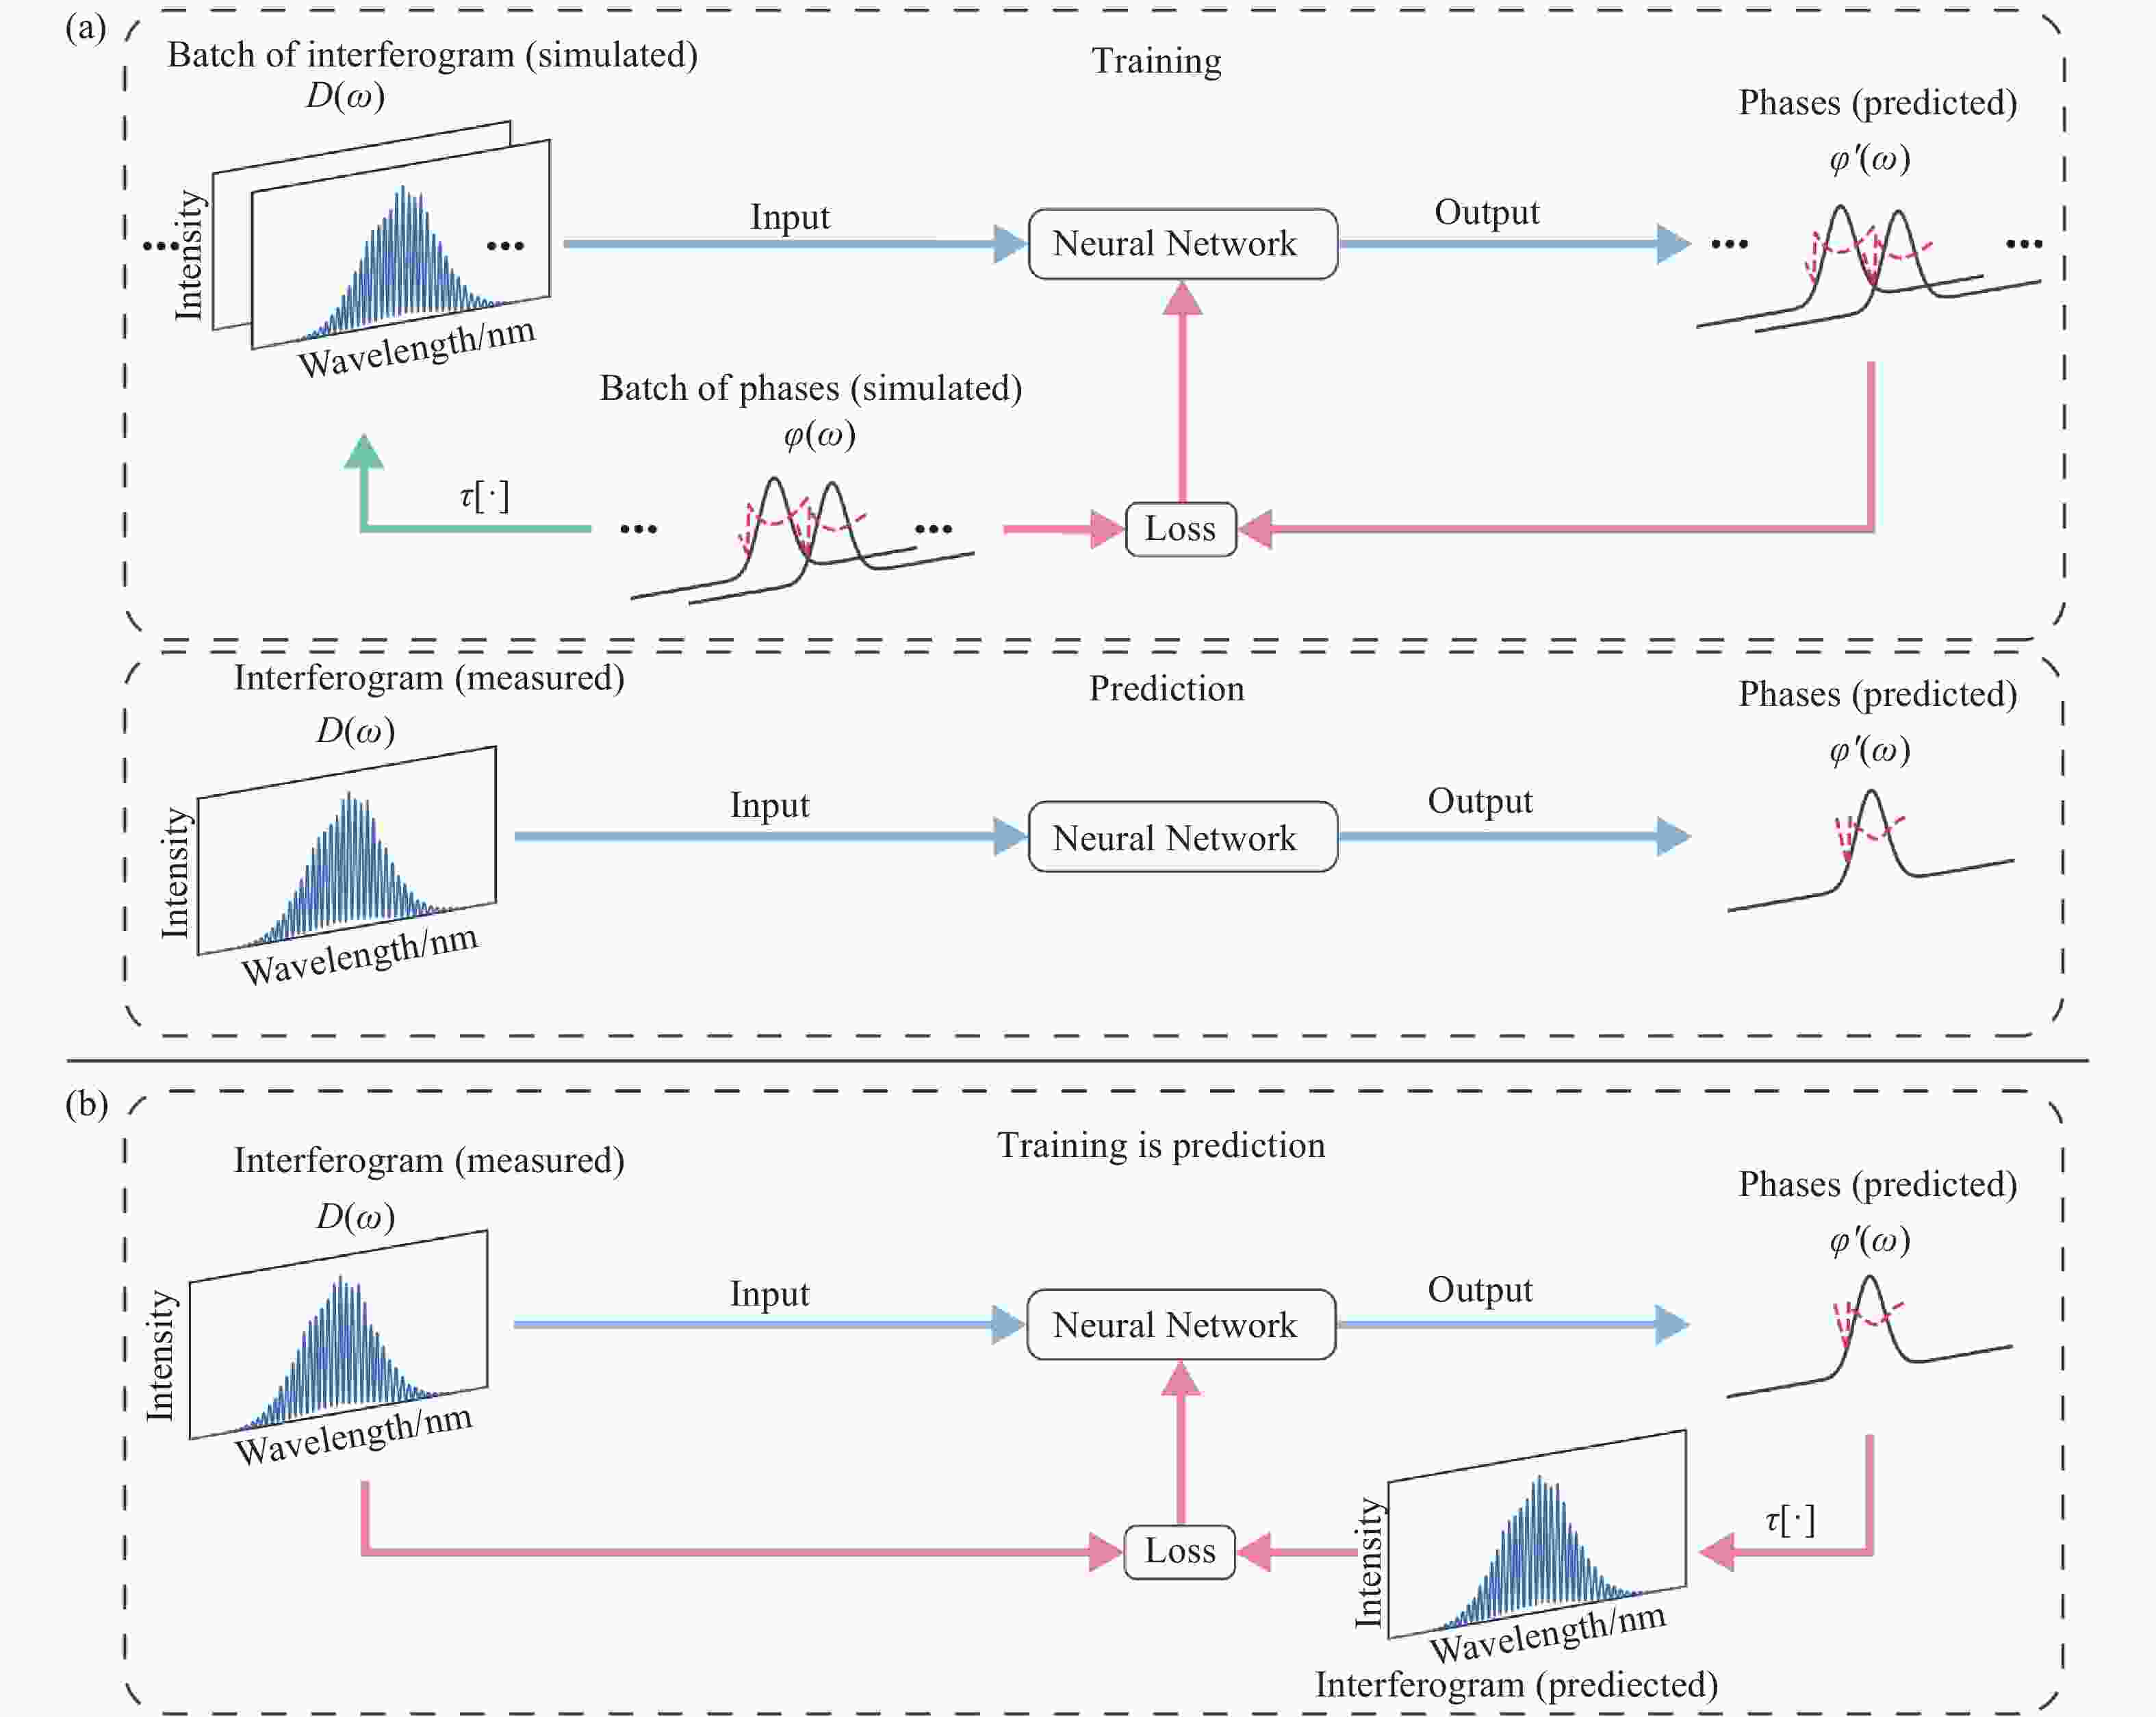
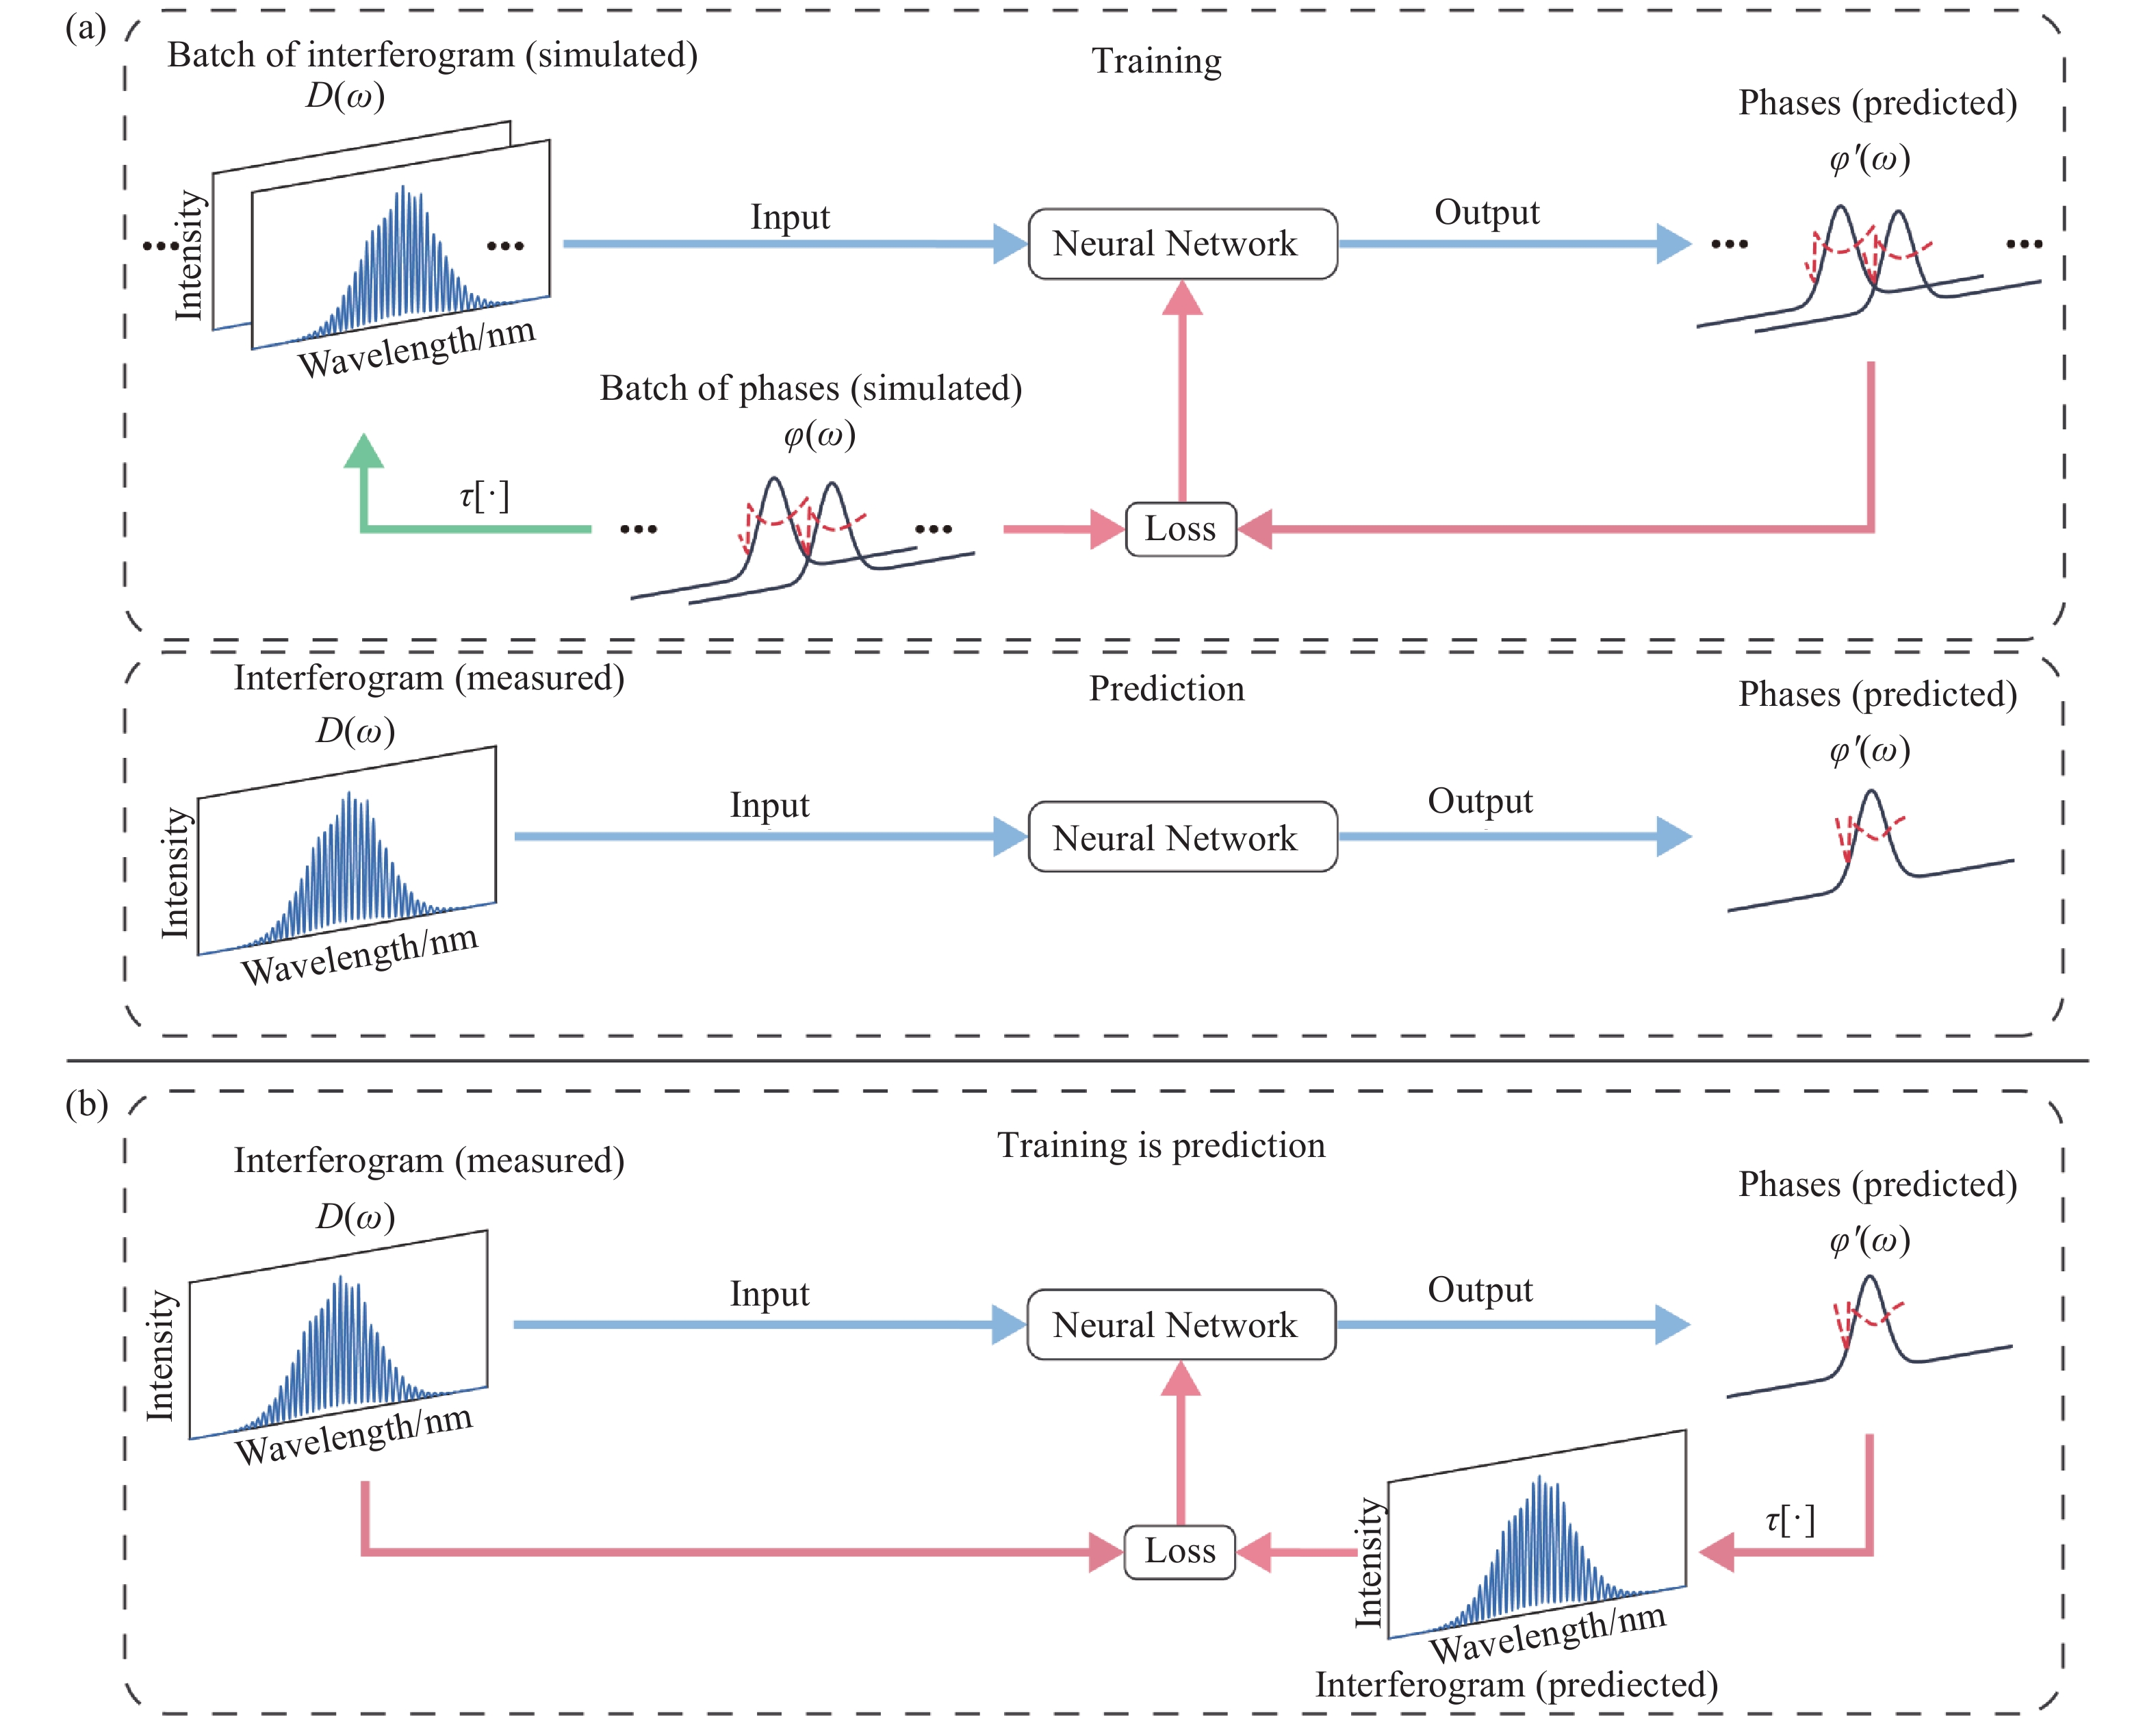
图 21 经典深度学习架构和无监督神经网络先验。(a)经典的监督学习包括独立的训练(在模拟数据上)和预测阶段。(b)提出的UNNP框架,将训练和预测整合为一步优化过程,直接使用测量的干涉图。
Figure 21. Architectures of classic deep learning and the Untrained Neural Network Prior. (a) Classic supervised learning involving distinct training (on simulated data) and prediction stages. (b) The proposed UNNP framework, where training and prediction are integrated into a single-step optimization process using the measured interferogram directly.
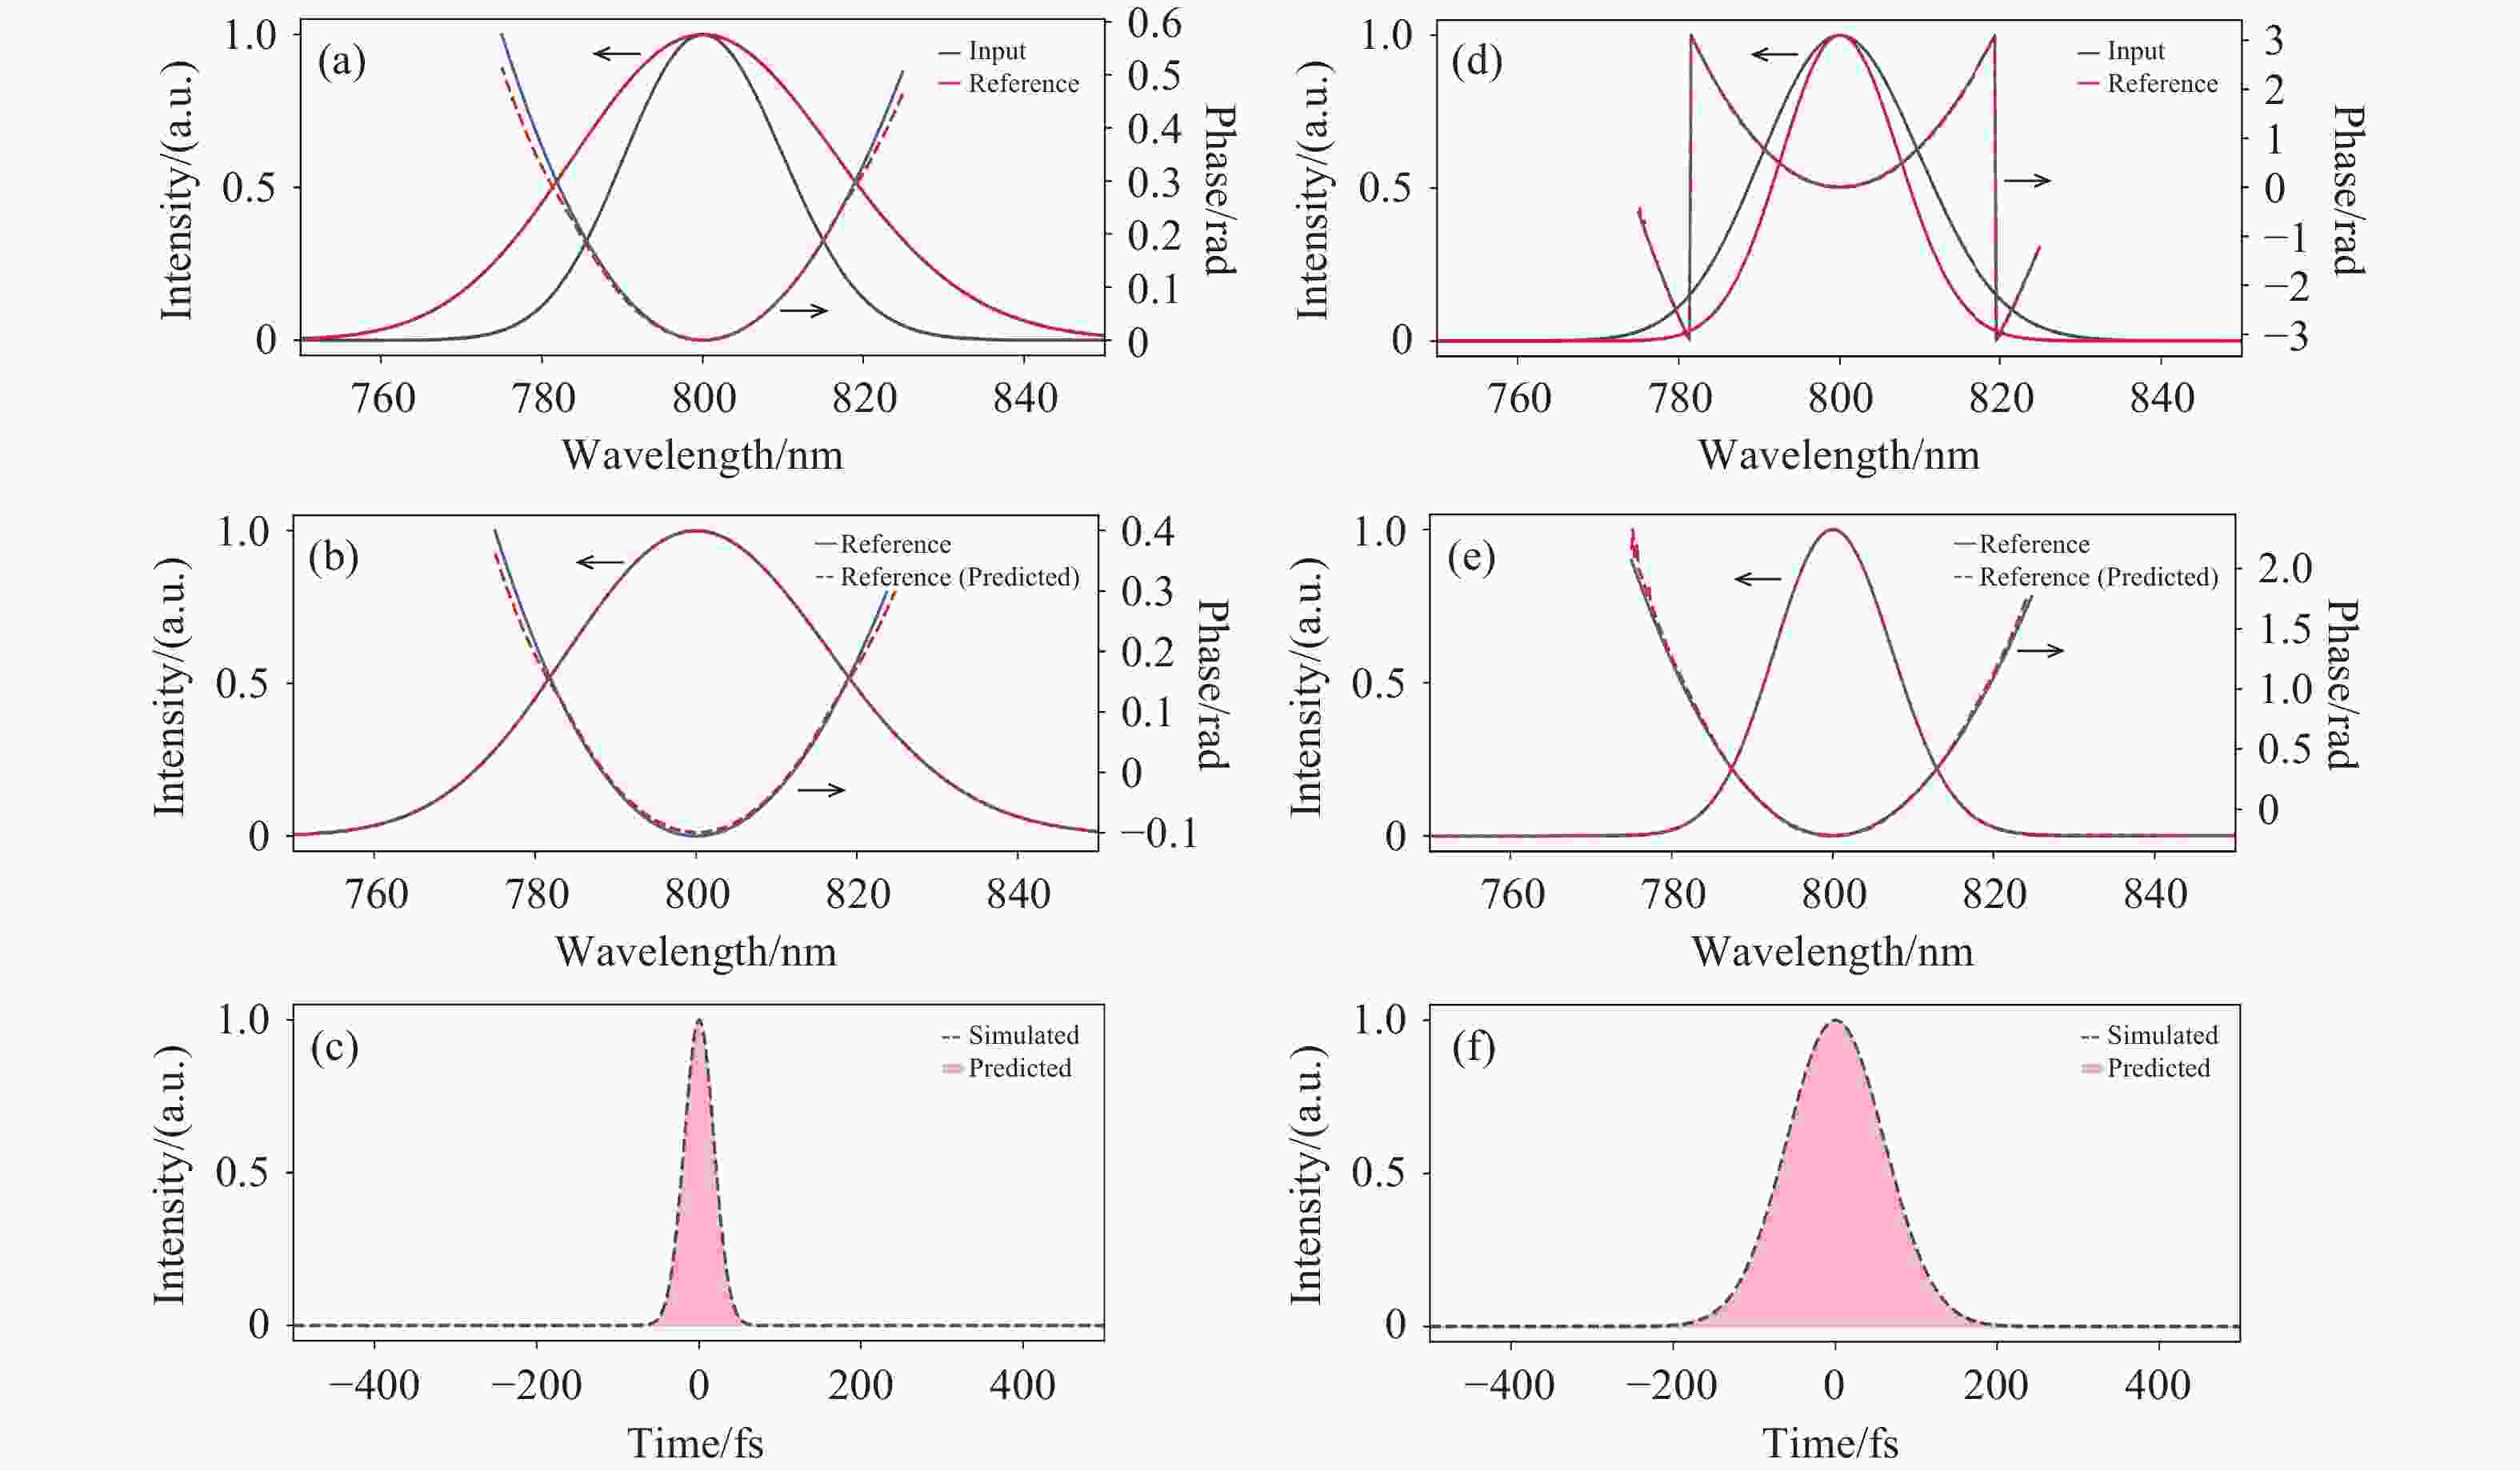
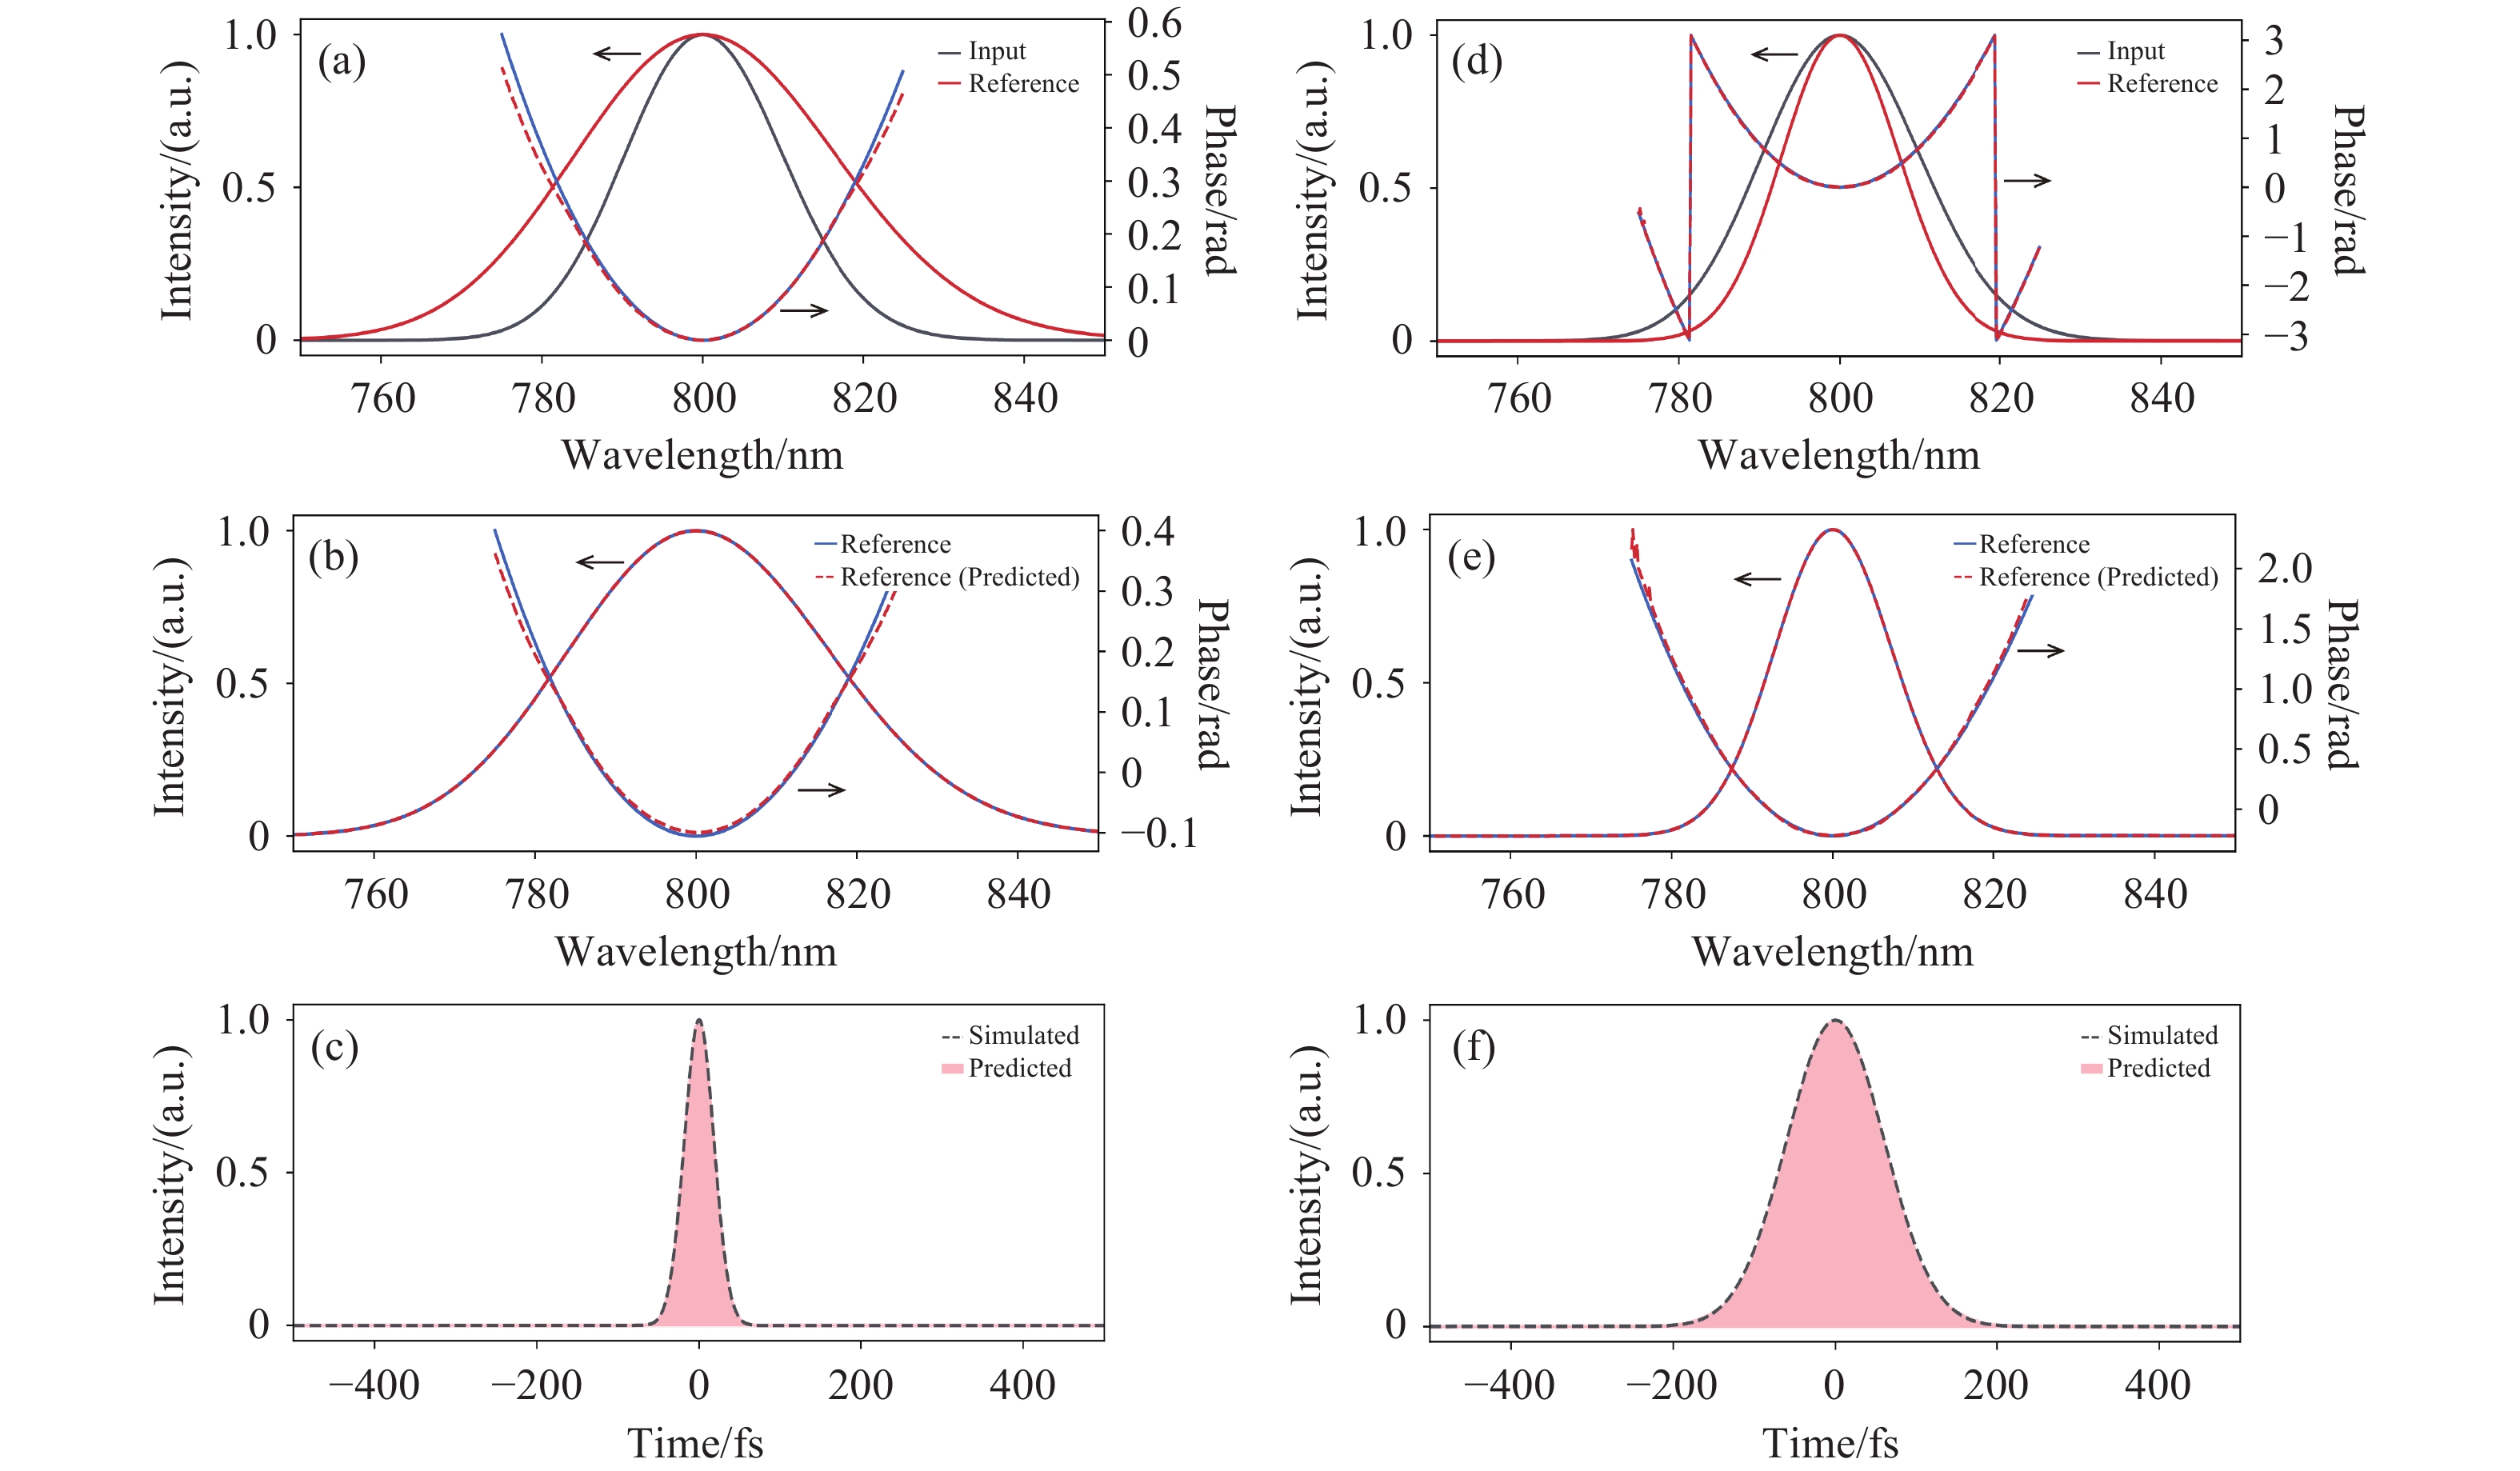
图 22 仿真结果验证,左列小啁啾下的仿真验证结果,右列为大啁啾仿真验证结果。(a)黑色实线为模拟脉冲的光谱,蓝色实线为模拟脉冲的相位。在这种小啁啾的情况,相应的参考脉冲的光谱(红色实线)宽于模拟脉冲光谱。红色虚线为UNNP重建的相位,与模拟的结果一致。(b)模拟的参考脉冲光谱与提取出的相位差(蓝色实线与虚线),重建的参考脉冲光谱与相位差(红色实线与虚线),两者一致。(c)模拟与重建的脉冲时域结构。(d)黑色实线为模拟脉冲的光谱,蓝色实线为模拟脉冲的相位。在这种大啁啾的情况,相应的参考脉冲的光谱(红色实线)明显窄于模拟脉冲光谱。红色虚线为UNNP重建的相位,与模拟的结果一致。(e)模拟的参考脉冲光谱与提取出的相位差(蓝色实线与虚线),重建的参考脉冲光谱与相位差(红色实线与虚线),两者一致。(f)模拟与重建的脉冲时域结构。
Figure 22. Simulation results verify that the left column shows simulation verification results under small chirp, and the right column shows those under large chirp. (a) The black solid line represents the spectrum of the simulated pulse, and the blue solid line represents the phase of the simulated pulse. In this case of small chirp, the corresponding reference pulse spectrum (red solid line) is wider than the simulated pulse spectrum. The red dashed line represents the reconstructed phase by UNNP, which is consistent with the simulated results. (b) The difference between the simulated reference pulse spectrum and the extracted phase (blue solid line and dashed line), and the difference between the reconstructed reference pulse spectrum and the phase (red solid line and dashed line), are consistent with each other. (c) The time-domain structure of the simulated and reconstructed pulses. (d) The black solid line represents the spectrum of the simulated pulse, and the blue solid line represents the phase of the simulated pulse. In this case of large chirp, the corresponding reference pulse spectrum (red solid line) is significantly narrower than the simulated pulse spectrum. The red dashed line represents the reconstructed phase by UNNP, which is consistent with the simulated results. (e) The difference between the simulated reference pulse spectrum and the extracted phase (blue solid line and dashed line), and the difference between the reconstructed reference pulse spectrum and the phase (red solid line and dashed line), are consistent with each other. (f) The time-domain structure of the simulated and reconstructed pulses.
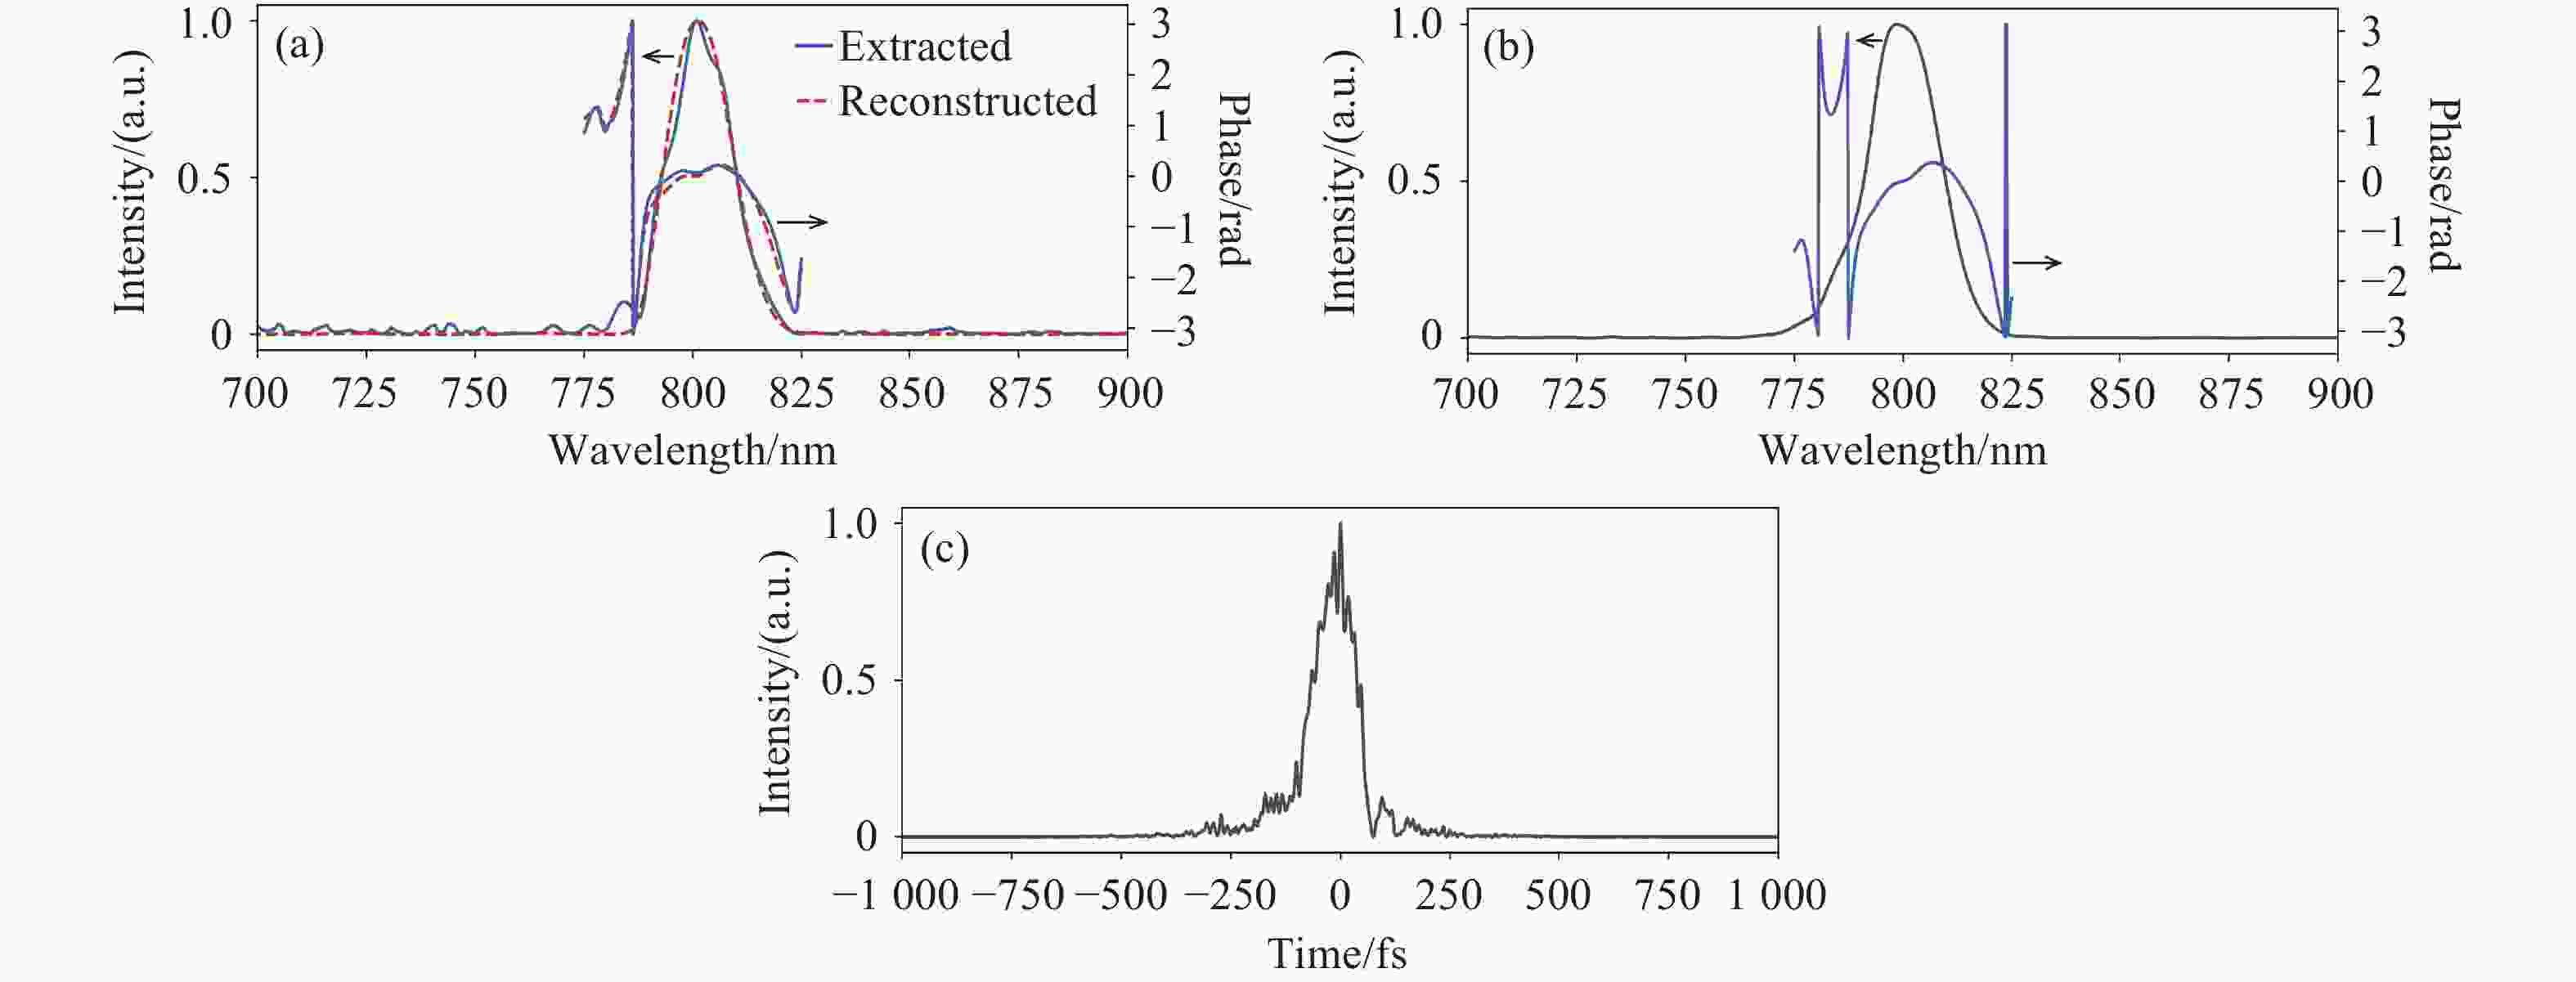
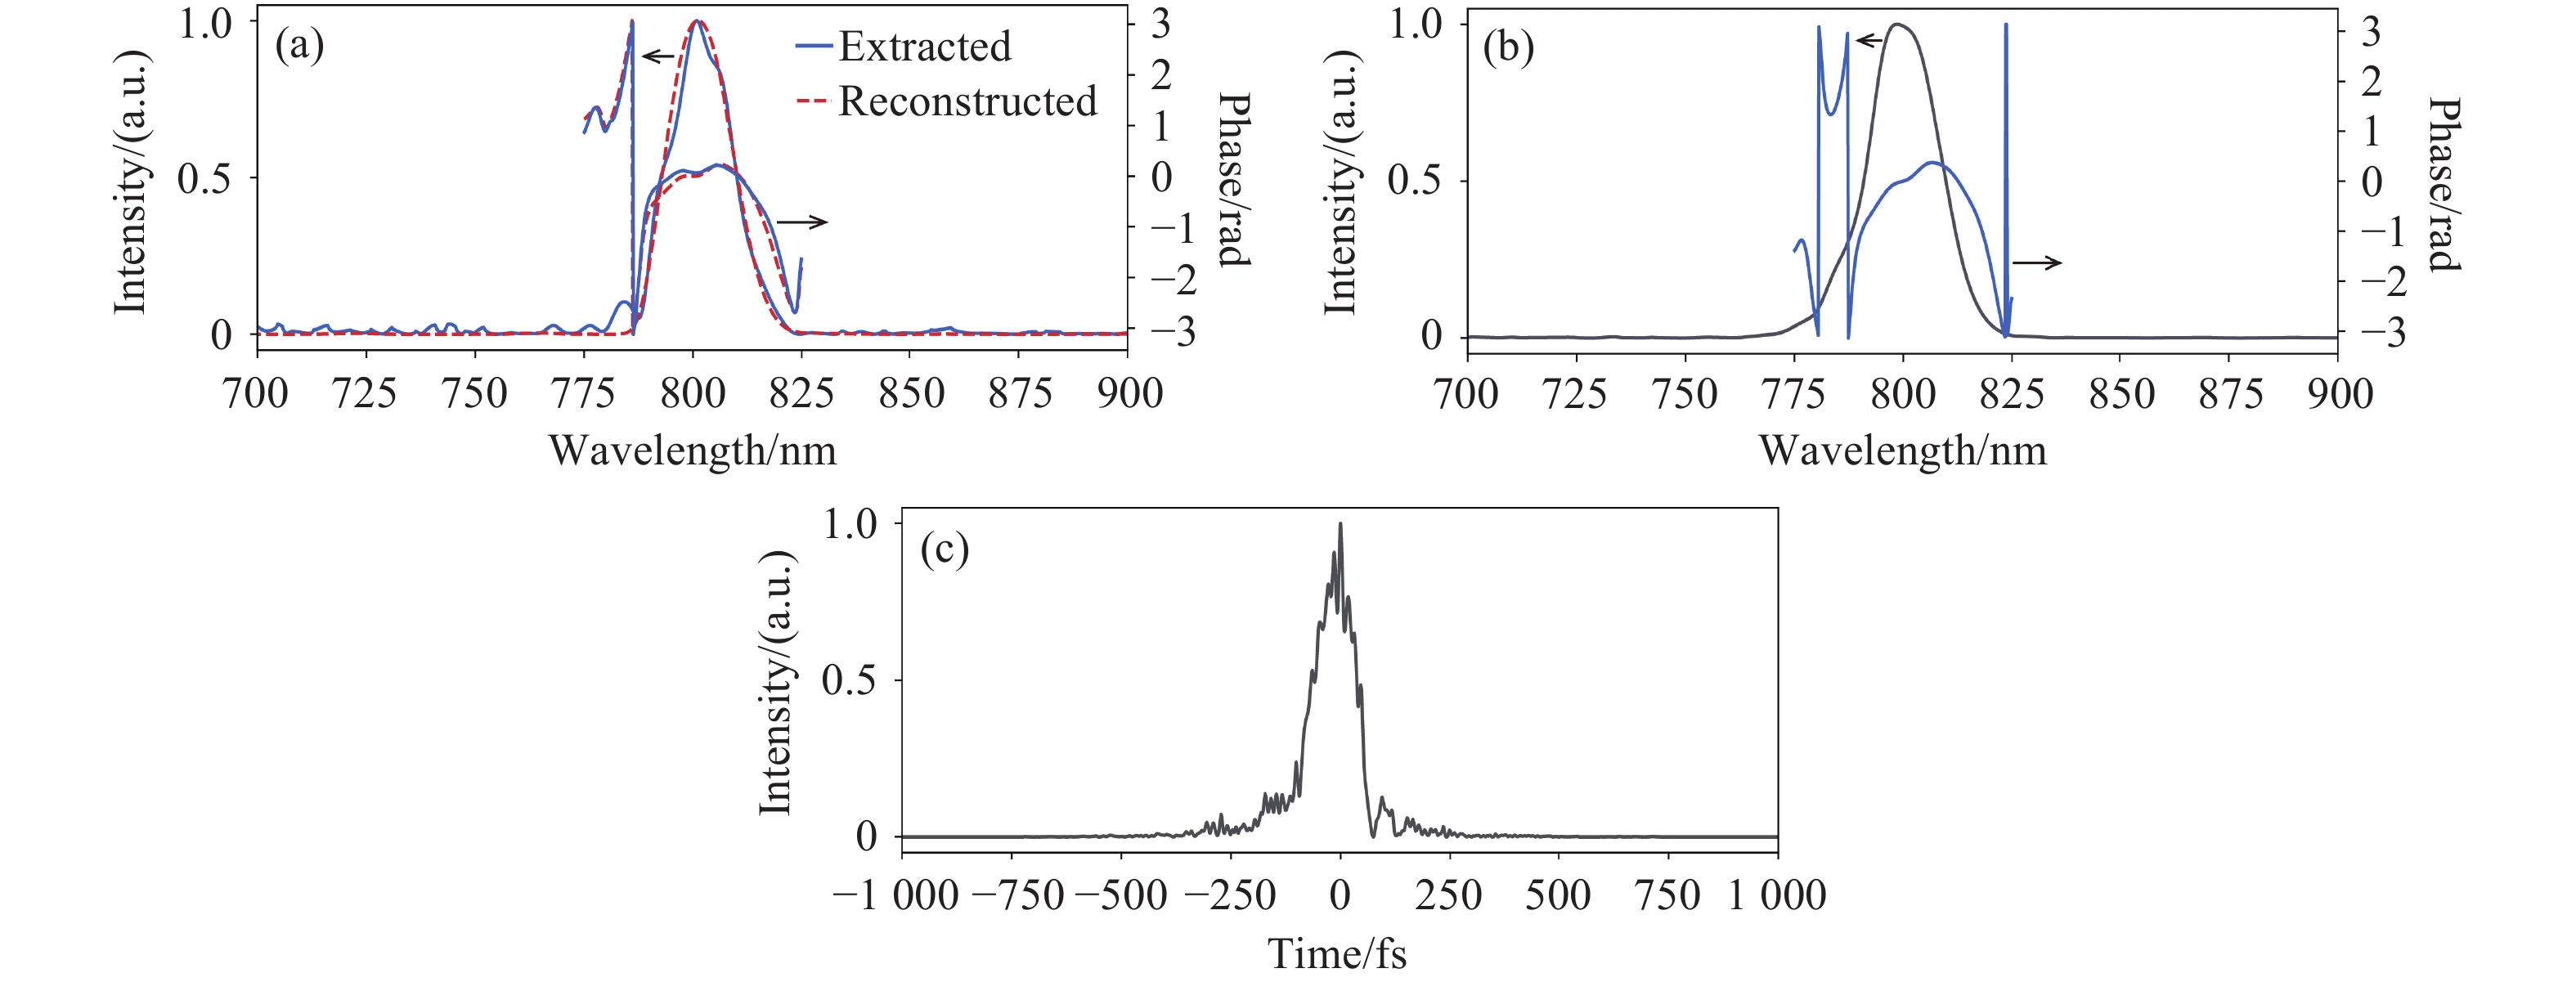
图 23 实验测量数据验证。(a)从干涉图中提取出的参考脉冲的光谱与相位差(蓝色实线),重建的参考脉冲的光谱与相位差(红色虚线)。(b)待测脉冲的光谱(黑色实线)与相位(蓝色实线)。(c)待测脉冲的时域结构。
Figure 23. Experimental measurement data validation. (a) The spectrum and phase difference of the reference pulse extracted from the interferogram (blue solid line) and the reconstructed reference pulse spectrum and phase difference (red dashed line). (b) The spectrum (black solid line) and phase (blue solid line) of the test pulse. (c) The time-domain structure of the test pulse.
XPW SD TG 灵敏度(多发) ~100 nJ ~ 1000 nJ~10 nJ 灵敏度(单发) ~1 µJ ~10 µJ ~0.1 µJ 优点 自相位匹配 无需偏振器件;
宽波段适应宽波段适应;
背景抑制;灵敏缺点 需要偏振器件 非自相位匹配 需要三路光  下载: 导出CSV
表 2 SRSI 各代光路方案核心参数对比
Table 2. Core Parameters Comparison of SRSI Generation Optical Path Schemes
方案 非线性介质 已验证能量(单发) 波段适用性 角色散 特点 XPW-SRSI LiF/BaF2晶体 0.1 μJ 受晶体、偏振片透明窗口限制 无 需偏振片;自相位匹配;共线光路 SD-SRSI 熔融石英 1 μJ 深紫外至中红外 有 非共线光路;角色散影响;无偏振片;宽波段 TG-SRSI 熔融石英 ~1.5 μJ 深紫外至中红外 无 无偏振片;自相位匹配;150 mm 抛物镜 Extended TG-SRSI 熔融石英 65 nJ 深紫外至中红外 无 无偏振片;自相位匹配;RMO(f=13.3 mm)紧聚焦结构 Compact TG-SRSI YAG 0.48 nJ 深紫外至中红外 无 无偏振片;自相位匹配;对称短焦抛物镜对(f=25.4 mm)
紧聚焦、紧凑;高灵敏度
下载: 导出CSV
数据集 脉冲光谱形状 延时 相位参数化方式 特点 1 固定理想高斯型 固定(~ 1000 fs)三阶 Taylor 展开(3 个随机系数) 基准,最简单 2 随机高斯曲线(中心波长、带宽随机) 随机(500– 1500 fs)三阶 Taylor 展开(含载波与幅值随机变化) 接近真实情况 3 随机高斯曲线 随机(500– 1500 fs)三阶 + 四阶 + 五阶 Taylor 展开 最复杂,含高阶色散
下载: 导出CSV
表 4 Dense-1D-U-Net与传统SRSI算法相位重建MSE对比[27]
Table 4. Comparison of Phase Reconstruction MSE between Dense-1D-UNet and Traditional SRSI Algorithms[27]
实验 相位复杂度 传统 SRSI MSE Dense-1D-U-Net MSE 精度提升 1 三阶(固定光谱/延迟) 0.01010 0.0004960 约 2 个数量级 2 三阶(随机光谱/延迟) 0.01010 0.0000848 约 2 个数量级 3 三至五阶(随机光谱/延迟) 0.00984 0.0008620 约 1 个数量级
下载: 导出CSV
表 5 SRSI算法性能综合对比
Table 5. Comprehensive Comparison of SRSI Algorithm Performance
性能指标 传统SRSI迭代算法 Dense-1D-U-Net(监督学习) UNNP(物理信息神经网络) 训练数据集需求 无 大规模仿真标注数据集 无(单次测量自优化) 推理速度 快(3–15次迭代) 极快(单次前向传播,毫秒量级) 较慢(每次独立优化,分钟量级) 含噪条件重建精度 一般(噪声随迭代累积) 受仿真-实验域差异限制 优(卷积网络隐式去噪) 大啁啾脉冲适用性 受限(需SRSI-SS扩展) 受训练分布上限制约 原理上不受限(逐次物理约束优化) 分布外泛化能力 不涉及(无训练依赖) 弱(分布外失效) 强(物理正向模型为唯一约束)
下载: 导出CSV
-
[1] MOUROU G A, TAJIMA T, BULANOV S V. Optics in the relativistic regime[J]. Reviews of Modern Physics, 2006, 78(2): 309-371. doi: 10.1103/RevModPhys.78.309 [2] GERSTNER E. Extreme light[J]. Nature, 2007, 446(7131): 16-18. [3] MOUROU G. Nobel lecture: extreme light physics and application[J]. Reviews of Modern Physics, 2019, 91(3): 030501. doi: 10.1103/RevModPhys.91.030501 [4] SALA K, KENNEY-WALLACE G, HALL G. CW autocorrelation measurements of picosecond laser pulses[J]. IEEE Journal of Quantum Electronics, 1980, 16(9): 990-996. doi: 10.1109/JQE.1980.1070606 [5] TREBINO R, KANE D J. Using phase retrieval to measure the intensity and phase of ultrashort pulses: frequency-resolved optical gating[J]. Journal of the Optical Society of America A, 1993, 10(5): 1101-1111. doi: 10.1364/JOSAA.10.001101 [6] IACONIS C, WALMSLEY I A. Spectral phase interferometry for direct electric-field reconstruction of ultrashort optical pulses[J]. Optics Letters, 1998, 23(10): 792-794. doi: 10.1364/OL.23.000792 [7] DELONG K W, FITTINGHOFF D N, TREBINO R, et al. Pulse retrieval in frequency-resolved optical gating based on the method of generalized projections[J]. Optics Letters, 1994, 19(24): 2152-2154. doi: 10.1364/OL.19.002152 [8] DELONG K W, TREBINO R. Improved ultrashort pulse-retrieval algorithm for frequency-resolved optical gating[J]. Journal of the Optical Society of America A, 1994, 11(9): 2429-2437. doi: 10.1364/JOSAA.11.002429 [9] ANDERSON M E, MONMAYRANT A, GORZA S P, et al. SPIDER: A decade of measuring ultrashort pulses[J]. Laser Physics Letters, 2008, 5(4): 259-266. doi: 10.1002/lapl.200710129 [10] OKSENHENDLER T, COUDREAU S, FORGET N, et al. Self-referenced spectral interferometry[J]. Applied Physics B, 2010, 99(1-2): 7-12. doi: 10.1007/s00340-010-3916-y [11] MINKOVSKI N, PETROV G I, SALTIEL S M, et al. Nonlinear polarization rotation and orthogonal polarization generation experienced in a single-beam configuration[J]. Journal of the Optical Society of America B, 2004, 21(9): 1659-1664. doi: 10.1364/JOSAB.21.001659 [12] MOULET A, GRABIELLE S, CORNAGGIA C, et al. Single-shot, high-dynamic-range measurement of sub-15 fs pulses by self-referenced spectral interferometry[J]. Optics Letters, 2010, 35(22): 3856-3858. doi: 10.1364/OL.35.003856 [13] GRABIELLE S, MOULET A, FORGET N, et al. Self-referenced spectral interferometry cross-checked with SPIDER on sub-15fs pulses[J]. Nuclear Instruments and Methods in Physics Research Section A: Accelerators, Spectrometers, Detectors and Associated Equipment, 2011, 653(1): 121-125. doi: 10.1016/j.nima.2011.01.007 [14] LIU J, JIANG Y L, KOBAYASHI T, et al. Self-referenced spectral interferometry based on self-diffraction effect[J]. Journal of the Optical Society of America B, 2012, 29(1): 29-34. doi: 10.1364/JOSAB.29.000029 [15] LIU J, LI F J, JIANG Y L, et al. Transient-grating self-referenced spectral interferometry for infrared femtosecond pulse characterization[J]. Optics Letters, 2012, 37(23): 4829-4831. doi: 10.1364/OL.37.004829 [16] LEPETIT L, CHÉRIAUX G, JOFFRE M. Linear techniques of phase measurement by femtosecond spectral interferometry for applications in spectroscopy[J]. Journal of the Optical Society of America B, 1995, 12(12): 2467-2474. doi: 10.1364/josab.12.002467 [17] JULLIEN A, CANOVA L, ALBERT O, et al. Spectral broadening and pulse duration reduction during cross-polarized wave generation: influence of the quadratic spectral phase[J]. Applied Physics B, 2007, 87(4): 595-601. doi: 10.1007/s00340-007-2685-8 [18] SHEN X, WANG P, LIU J, et al. Self-referenced spectral interferometry for femtosecond pulse characterization[J]. Applied Sciences, 2017, 7(4): 407. doi: 10.3390/app7040407 [19] OKSENHENDLER T. Self-referenced spectral interferometry theory[J]. arXiv: 1204.4949v1, 2012. (查阅网上资料, 不确定文献类型, 请确认). [20] TREBINO R. Frequency-Resolved Optical Gating: The Measurement of Ultrashort Laser Pulses[M]. New York: Springer, 2000. [21] ECKBRETH A C. BOXCARS: crossed‐beam phase‐matched CARS generation in gases[J]. Applied Physics Letters, 1978, 32(7): 421-423. doi: 10.1063/1.90070 [22] SHEN X, LIU J, LI F J, et al. Extended transient-grating self-referenced spectral interferometry for sub-100 nJ femtosecond pulse characterization[J]. Chinese Optics Letters, 2015, 13(8): 081901. doi: 10.3788/COL201513.081901 [23] MOLLA A R, TARAFDER A, MUKHERJEE S, et al. Transparent Nd3+-doped bismuth titanate glass-ceramic nanocomposites: fabrication and properties[J]. Optical Materials Express, 2014, 4(4): 843-863. doi: 10.1364/OME.4.000843 [24] SHEN X, WANG P, LIU J, et al. Compact transient-grating self-referenced spectral interferometry for sub-nanojoule femtosecond pulse characterization[J]. Applied Optics, 2017, 56(3): 582-586. doi: 10.1364/AO.56.000582 [25] XU Y L, SHEN X, WANG P, et al. Improved self-referenced spectral interferometry for large chirped pulses[J]. Proceedings of SPIE, 2023, 12760: 127600D. doi: 10.1117/12.2687067 [26] SI ZH, SHEN X, ZHU J X, et al. All-reflective self-referenced spectral interferometry for single-shot measurement of few-cycle femtosecond pulses in a broadband spectral range[J]. Chinese Optics Letters, 2020, 18(2): 021202. doi: 10.3788/COL202018.021202 [27] 况琪, 申雄, 徐艺林, 等. Dense-1D-U-Net: 用于自参考光谱干涉飞秒脉冲相位测量[J]. 中国激光, 2022, 49(9): 0904002. doi: 10.3788/CJL202249.0904002KUANG Q, SHEN X, XU Y L, et al. Dense-1D-U-Net: encoder-decoder networks for self-referenced spectral interferometry[J]. Chinese Journal of Lasers, 2022, 49(9): 0904002. (in Chinese). doi: 10.3788/CJL202249.0904002 [28] RONNEBERGER O, FISCHER P, BROX T. U-Net: convolutional networks for biomedical image segmentation[C]. Proceedings of the 18th International Conference on Medical Image Computing and Computer-Assisted Intervention – MICCAI 2015, Springer, 2015: 234-241. [29] HUANG G, LIU ZH, VAN DER MAATEN L, et al. Densely connected convolutional networks[C]. Proceedings of 2017 IEEE Conference on Computer Vision and Pattern Recognition, IEEE, 2017: 2261-2269. [30] QAYYUM A, ILAHI I, SHAMSHAD F, et al. Untrained neural network priors for inverse imaging problems: a survey[J]. IEEE Transactions on Pattern Analysis and Machine Intelligence, 2023, 45(5): 6511-6536. doi: 10.36227/techrxiv.14208215.v1 [31] CIPOLLA R, GAL Y, KENDALL A. Multi-task learning using uncertainty to weigh losses for scene geometry and semantics[C]. Proceedings of 2018 IEEE/CVF Conference on Computer Vision and Pattern Recognition, IEEE, 2018: 7482-7491. [32] GULYÁS OLDAL L, CSIZMADIA T, YE P, et al. Double-pulse characterization by self-referenced spectral interferometry[J]. Applied Physics Letters, 2019, 115(5): 051106. doi: 10.1063/1.5089959 [33] OKSENHENDLER T, BOCK S, GEBHARDT R, et al. Spatiotemporal characterization of pulse pedestals by imaging two-dimensional self-referenced spectral interferometry[J]. High Power Laser Science and Engineering, 2025, 13: e93. [34] XU Y L, SHEN X, CHEN R J, et al. Single-shot spatiotemporal characterization of ultrashort lasers based on spectral interferometry with fiber array[J]. Communications Physics, 2026, 9(1): 151. doi: 10.1038/s42005-026-02581-z -

 下载:
下载:







计量
- 文章访问数: 90
- HTML全文浏览量: 25
- PDF下载量: 4
- 被引次数: 0
