


Algorithmic study of total petroleum hydrocarbons in contaminated soil by three-dimensional excitation-emission matrix fluorescence spectroscopy
doi: 10.37188/CO.2019-0216
-
摘要: 混合石油烃污染土壤中准确的种类识别和含量检测有助于土壤石油烃污染总量的检测。石油烃是多种化合物的混合,而三维激发发射荧光光谱技术含有大量的荧光光谱信息,故被用于快速定性和定量检测土壤石油烃污染,但该技术仍面临着石油烃组分的准确识别以及土壤背景干扰引起的定量分析问题。本文研究了土壤石油烃污染物的三维荧光光谱复杂基质和散射效应校正方法,最大程度地保留了光谱信息。为了提高土壤石油烃定性识别和含量检测精度,本文以机油、润滑油和柴油为例,采用平行因子和交替三线性分解法对不同类型混合土壤石油烃污染进行定性和定量分析。实验结果表明,与平行因子法对土壤混合石油烃污染的检测结果相比,交替三线性分解法将土壤混合石油烃污染的平均回收率由85%提高至95%,说明交替三线性分解法能更好地分离相似荧光光谱,对土壤中石油成分和总含量的检测更有效,其可为土壤石油烃污染风险评估提供快速检测方法。Abstract: Assessment of Total Petroleum Hydrocarbons (TPHs) from contaminated soils demands reliable measurement to analyze the types and contents of mixed petroleum hydrocarbons in soils. Three-dimensional excitation-emission matrix (3DEEM) fluorescence spectroscopy has been demonstrated as a powerful technology for rapidly analyzing mixed petroleum hydrocarbons by identifying its abundant spectral information. However, detection precision in soil still demands improvement. This study investigates the correction methods of 3DEEM fluorescence spectra to correct the complicated matrix and scattering effects of soils. To improve the analytical accuracy, parallel factor analysis (PARAFAC) and the Alternating Trilinear Decomposition method (ATLD) were used to qualitatively and quantitatively analyze mixed petroleum contaminated soils. The methods were used to assess three commonly observed petroleum hydrocarbons: machine oil, lubricating oil, and diesel oil. Compared with the results of PARAFAC, the average recoveries of ATLD increased from 85% to 95%, implying that ATLD can effectively distinguish between similar fluorescence spectra and is more effective in the detection of the components and total content of petroleum in soil. This work can have applications of risk assessment and remediation techniques.
-

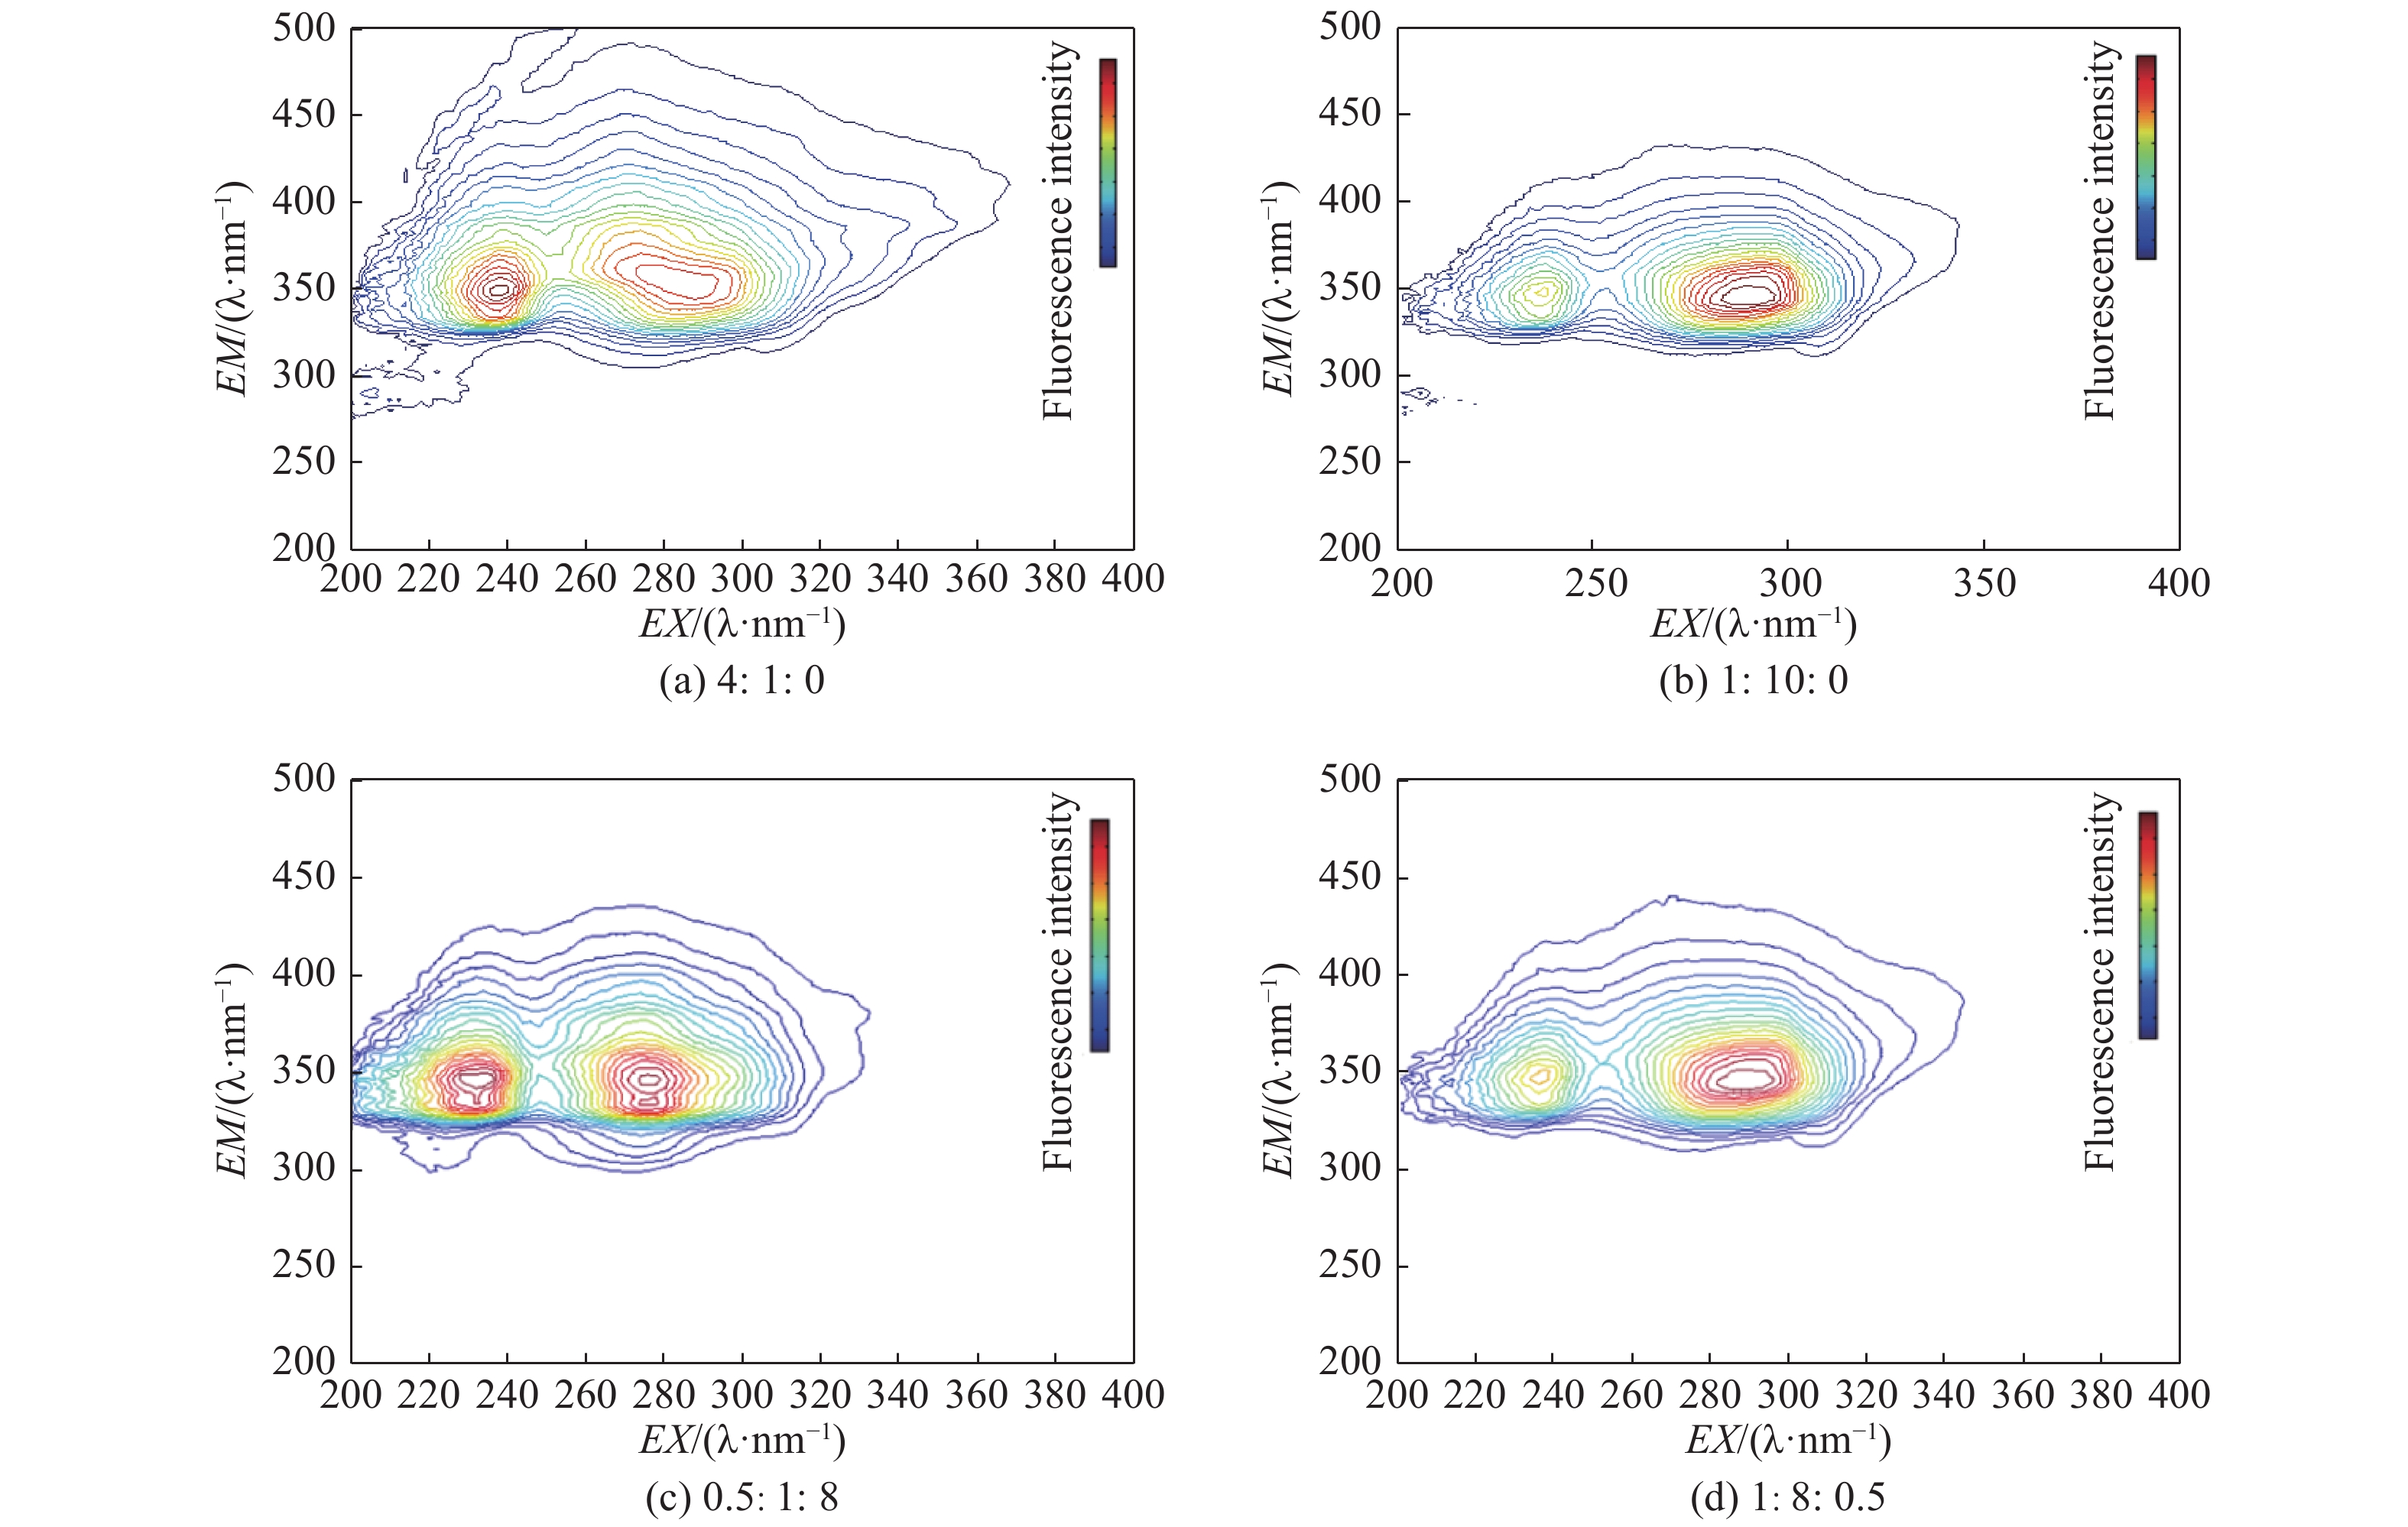
Figure 3. 3DEEM fluorescence spectra of mixed oil in soil (Machine oil:Lubricating oil:Diesel oil)

Figure 4. The core consistency diagnosis results for mixtures of two petroleum hydrocarbons. (a) N = 2; (b) N = 3

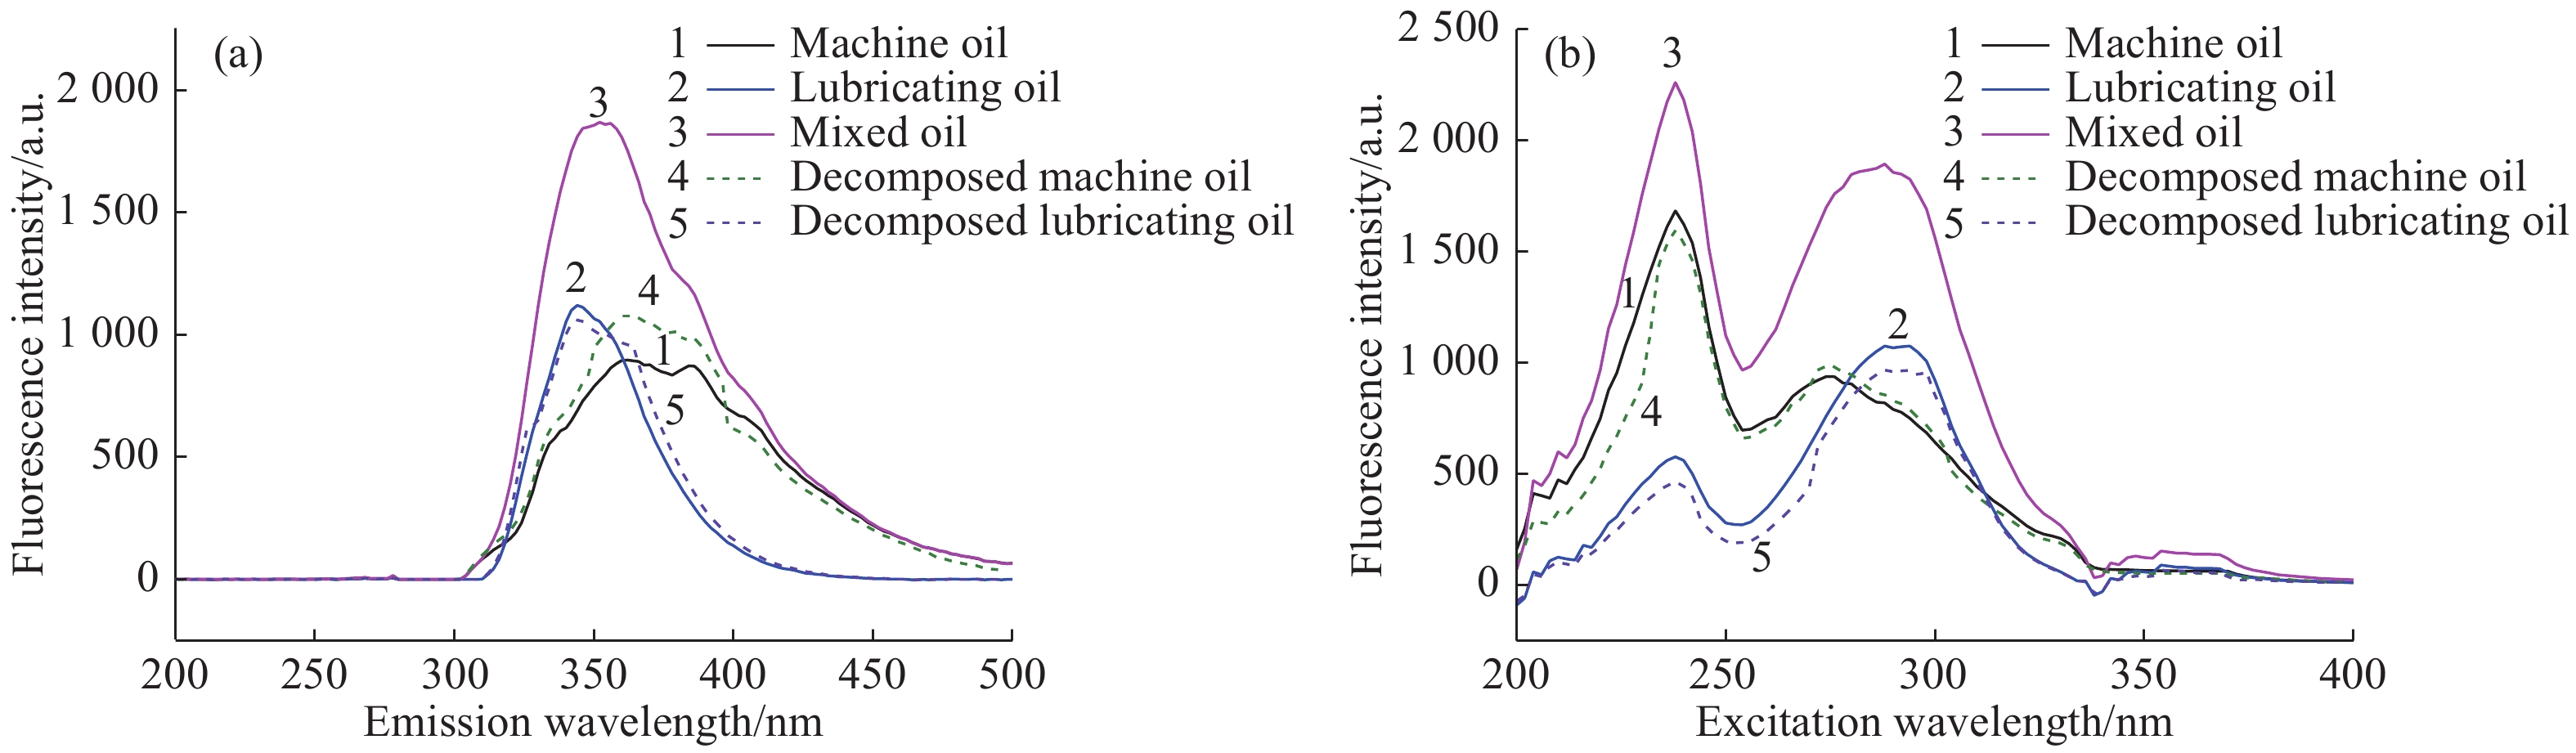
Figure 5. Classifying the mixture of two petroleum hydrocarbons by PARAFAC. (a) Classification of emission spectra; (b) classification of excitation spectra

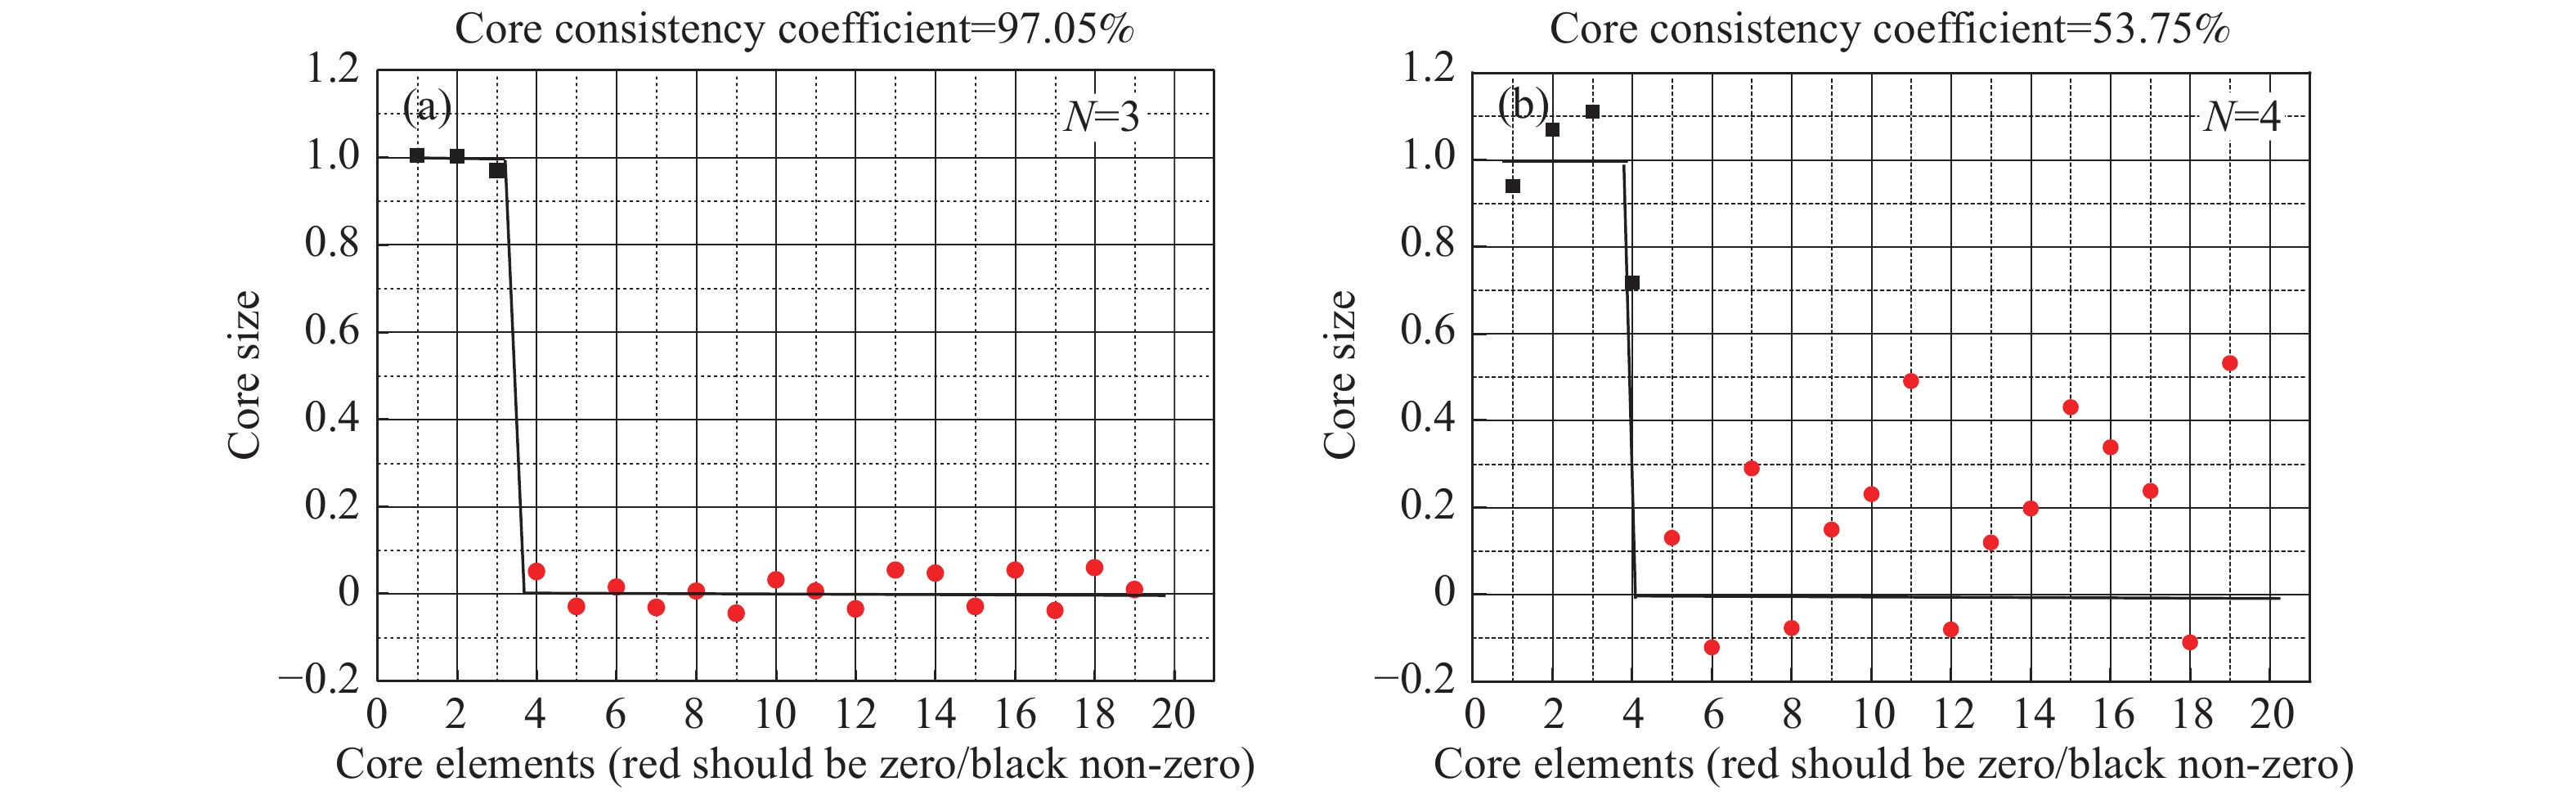
Figure 6. The core consistency diagnosis results for mixtures of three petroleum hydrocarbons. (a) N = 3; (b) N = 4
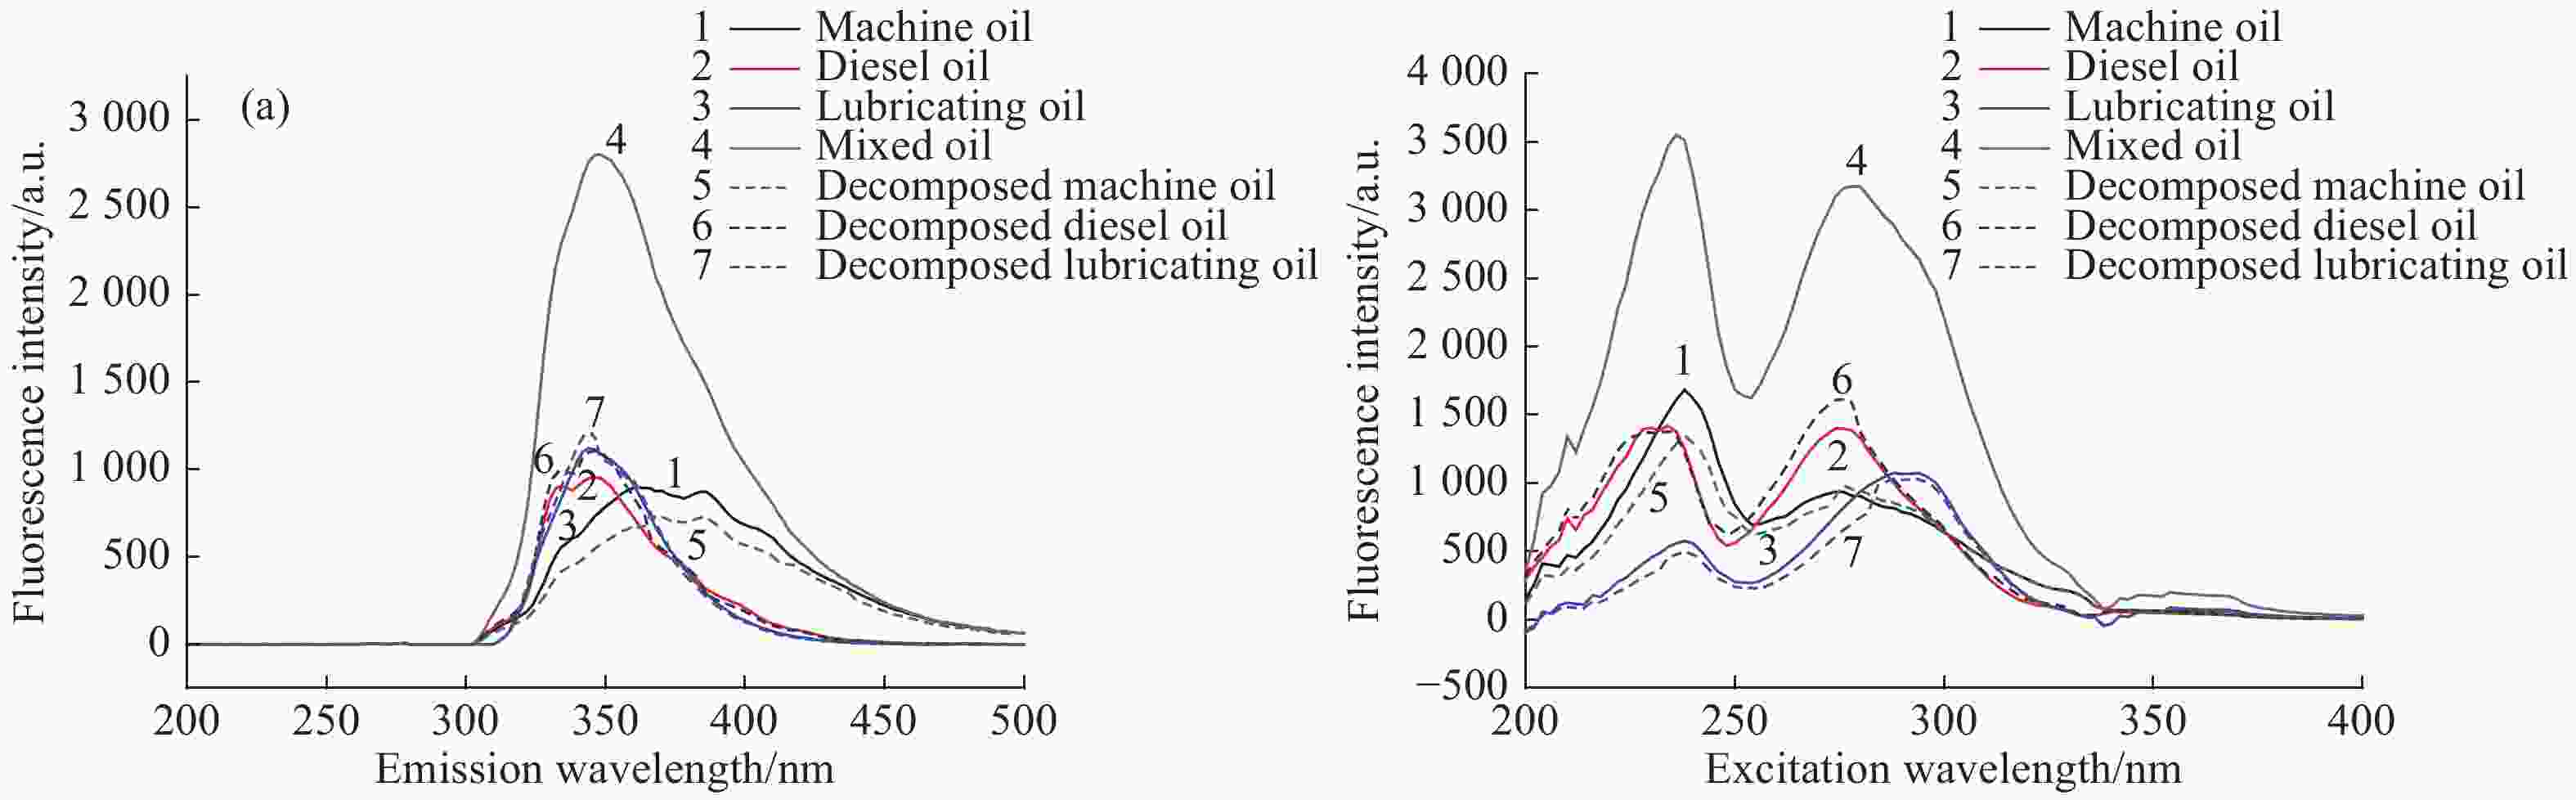
Figure 7. Classifying the mixture of three petroleum hydrocarbons by PARAFAC. (a) Classification of emission spectra; (b) classification of excitation spectra
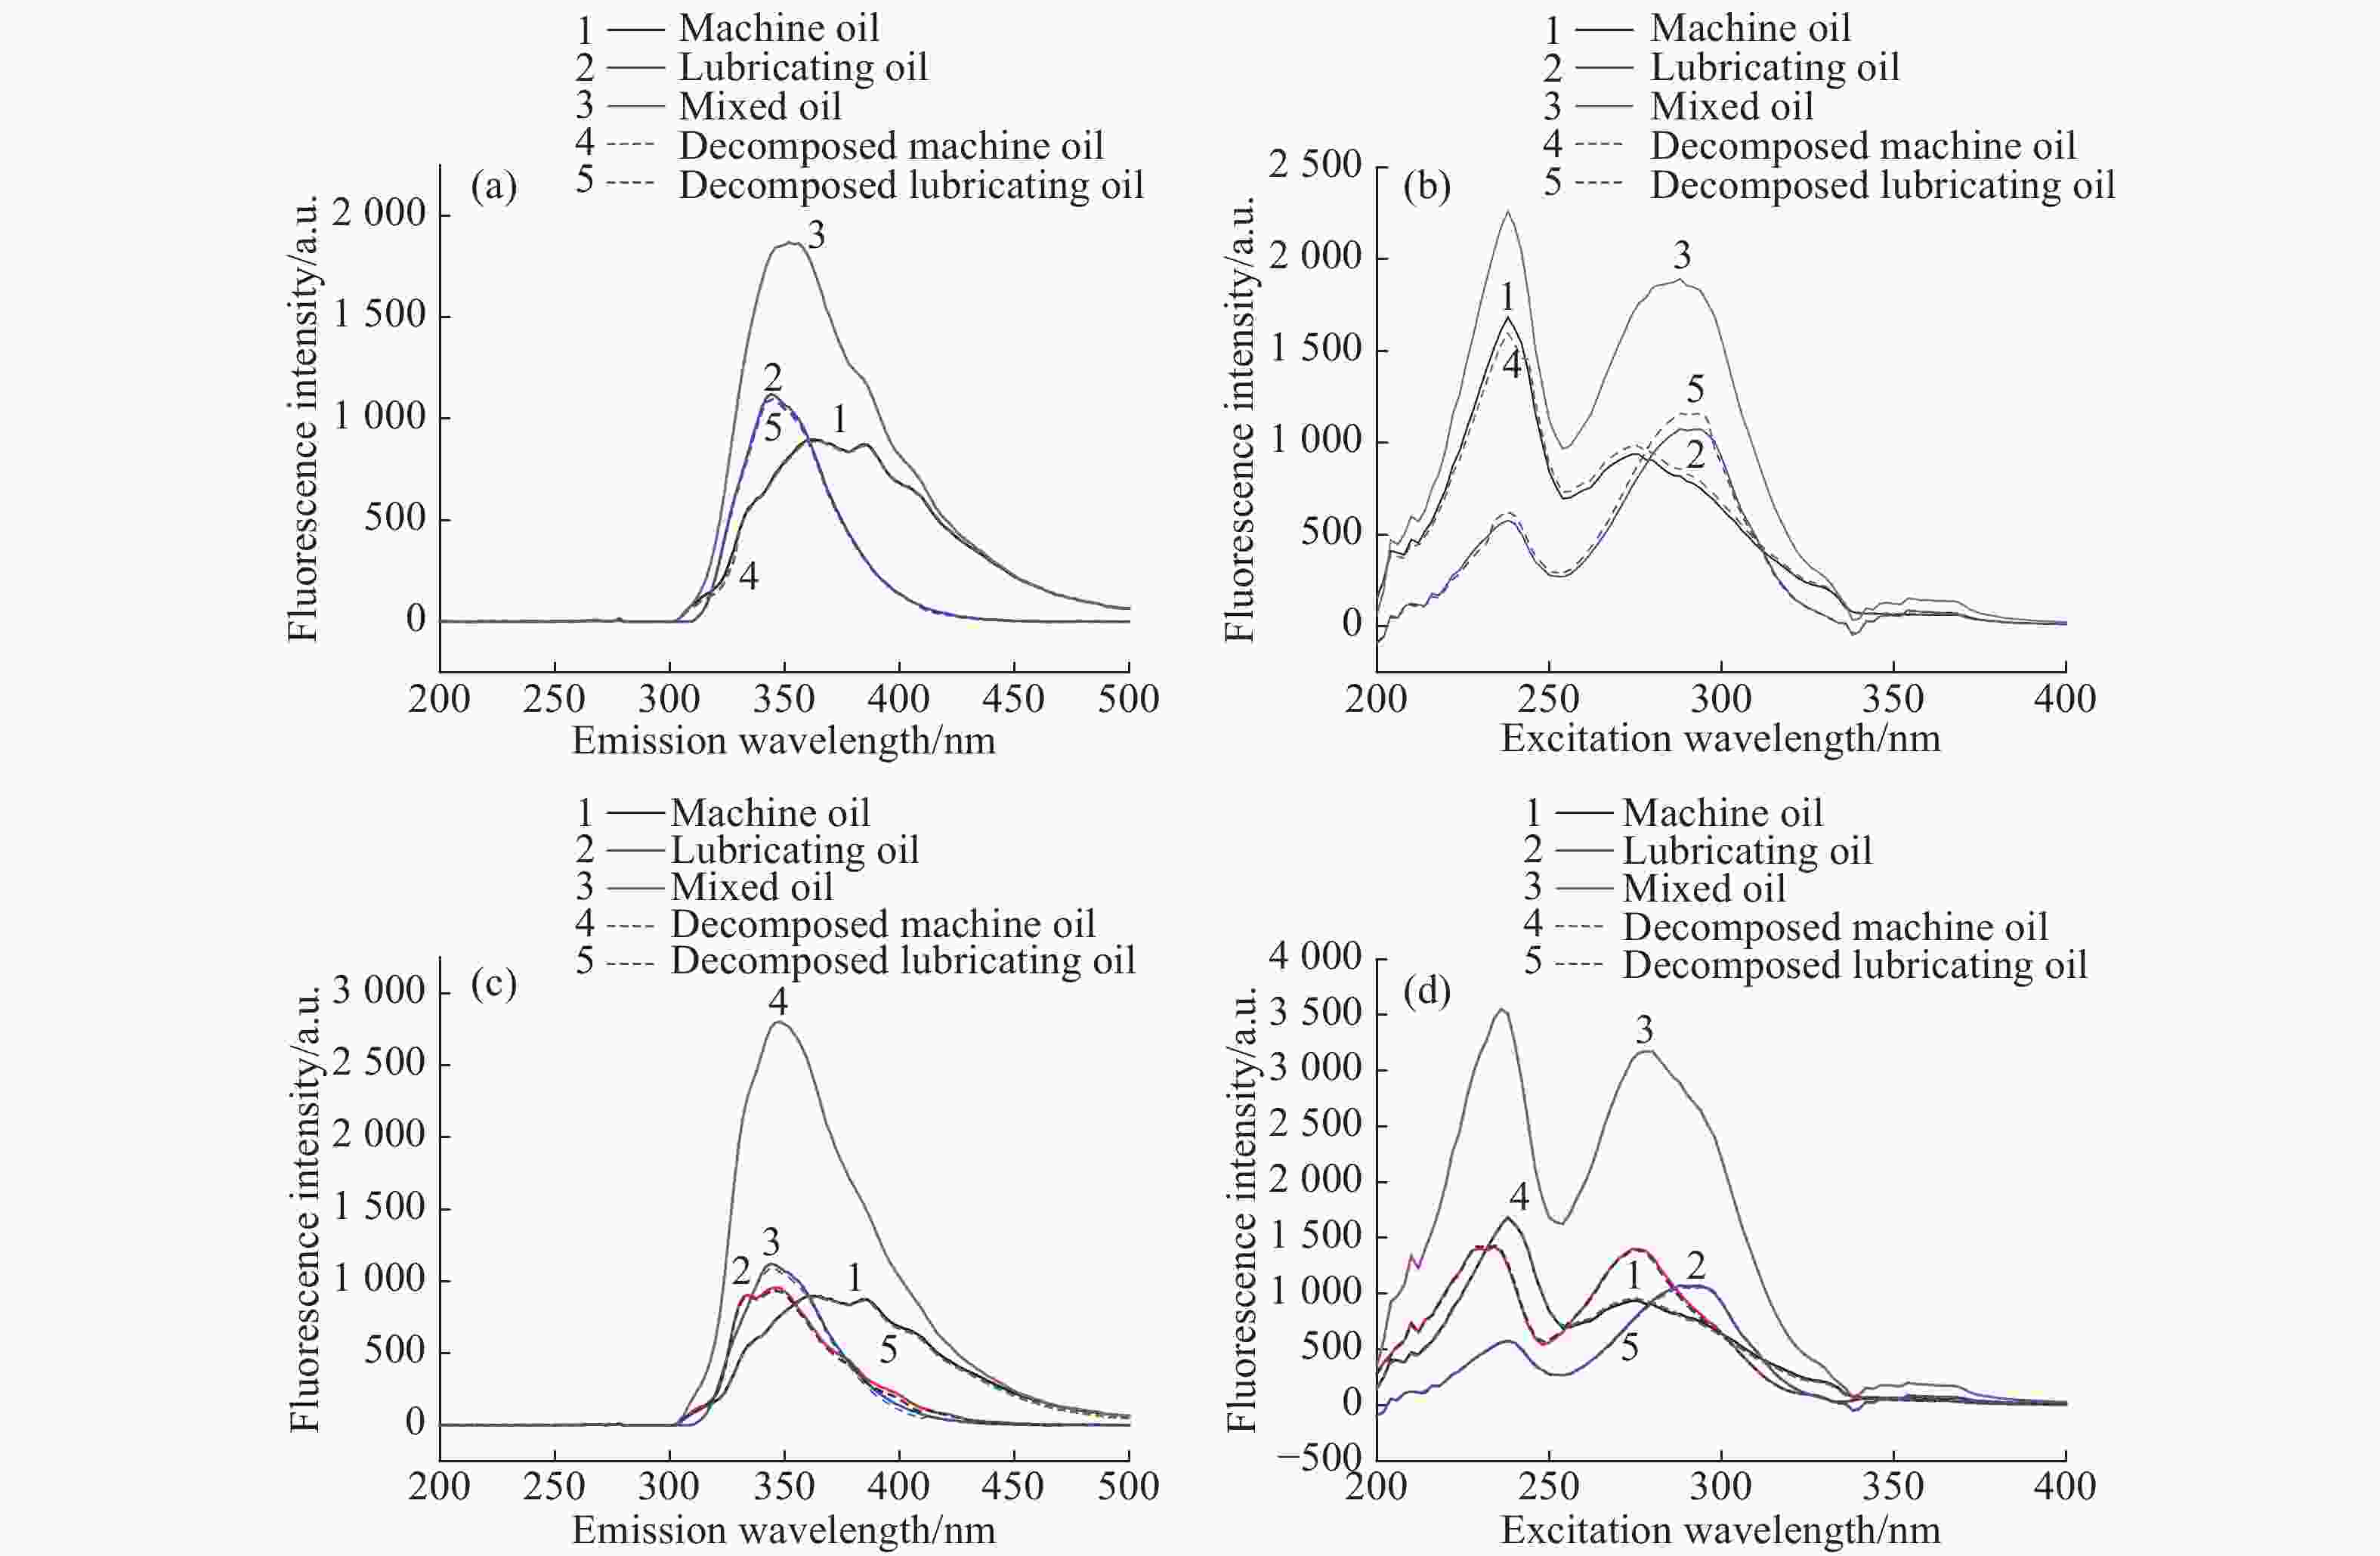
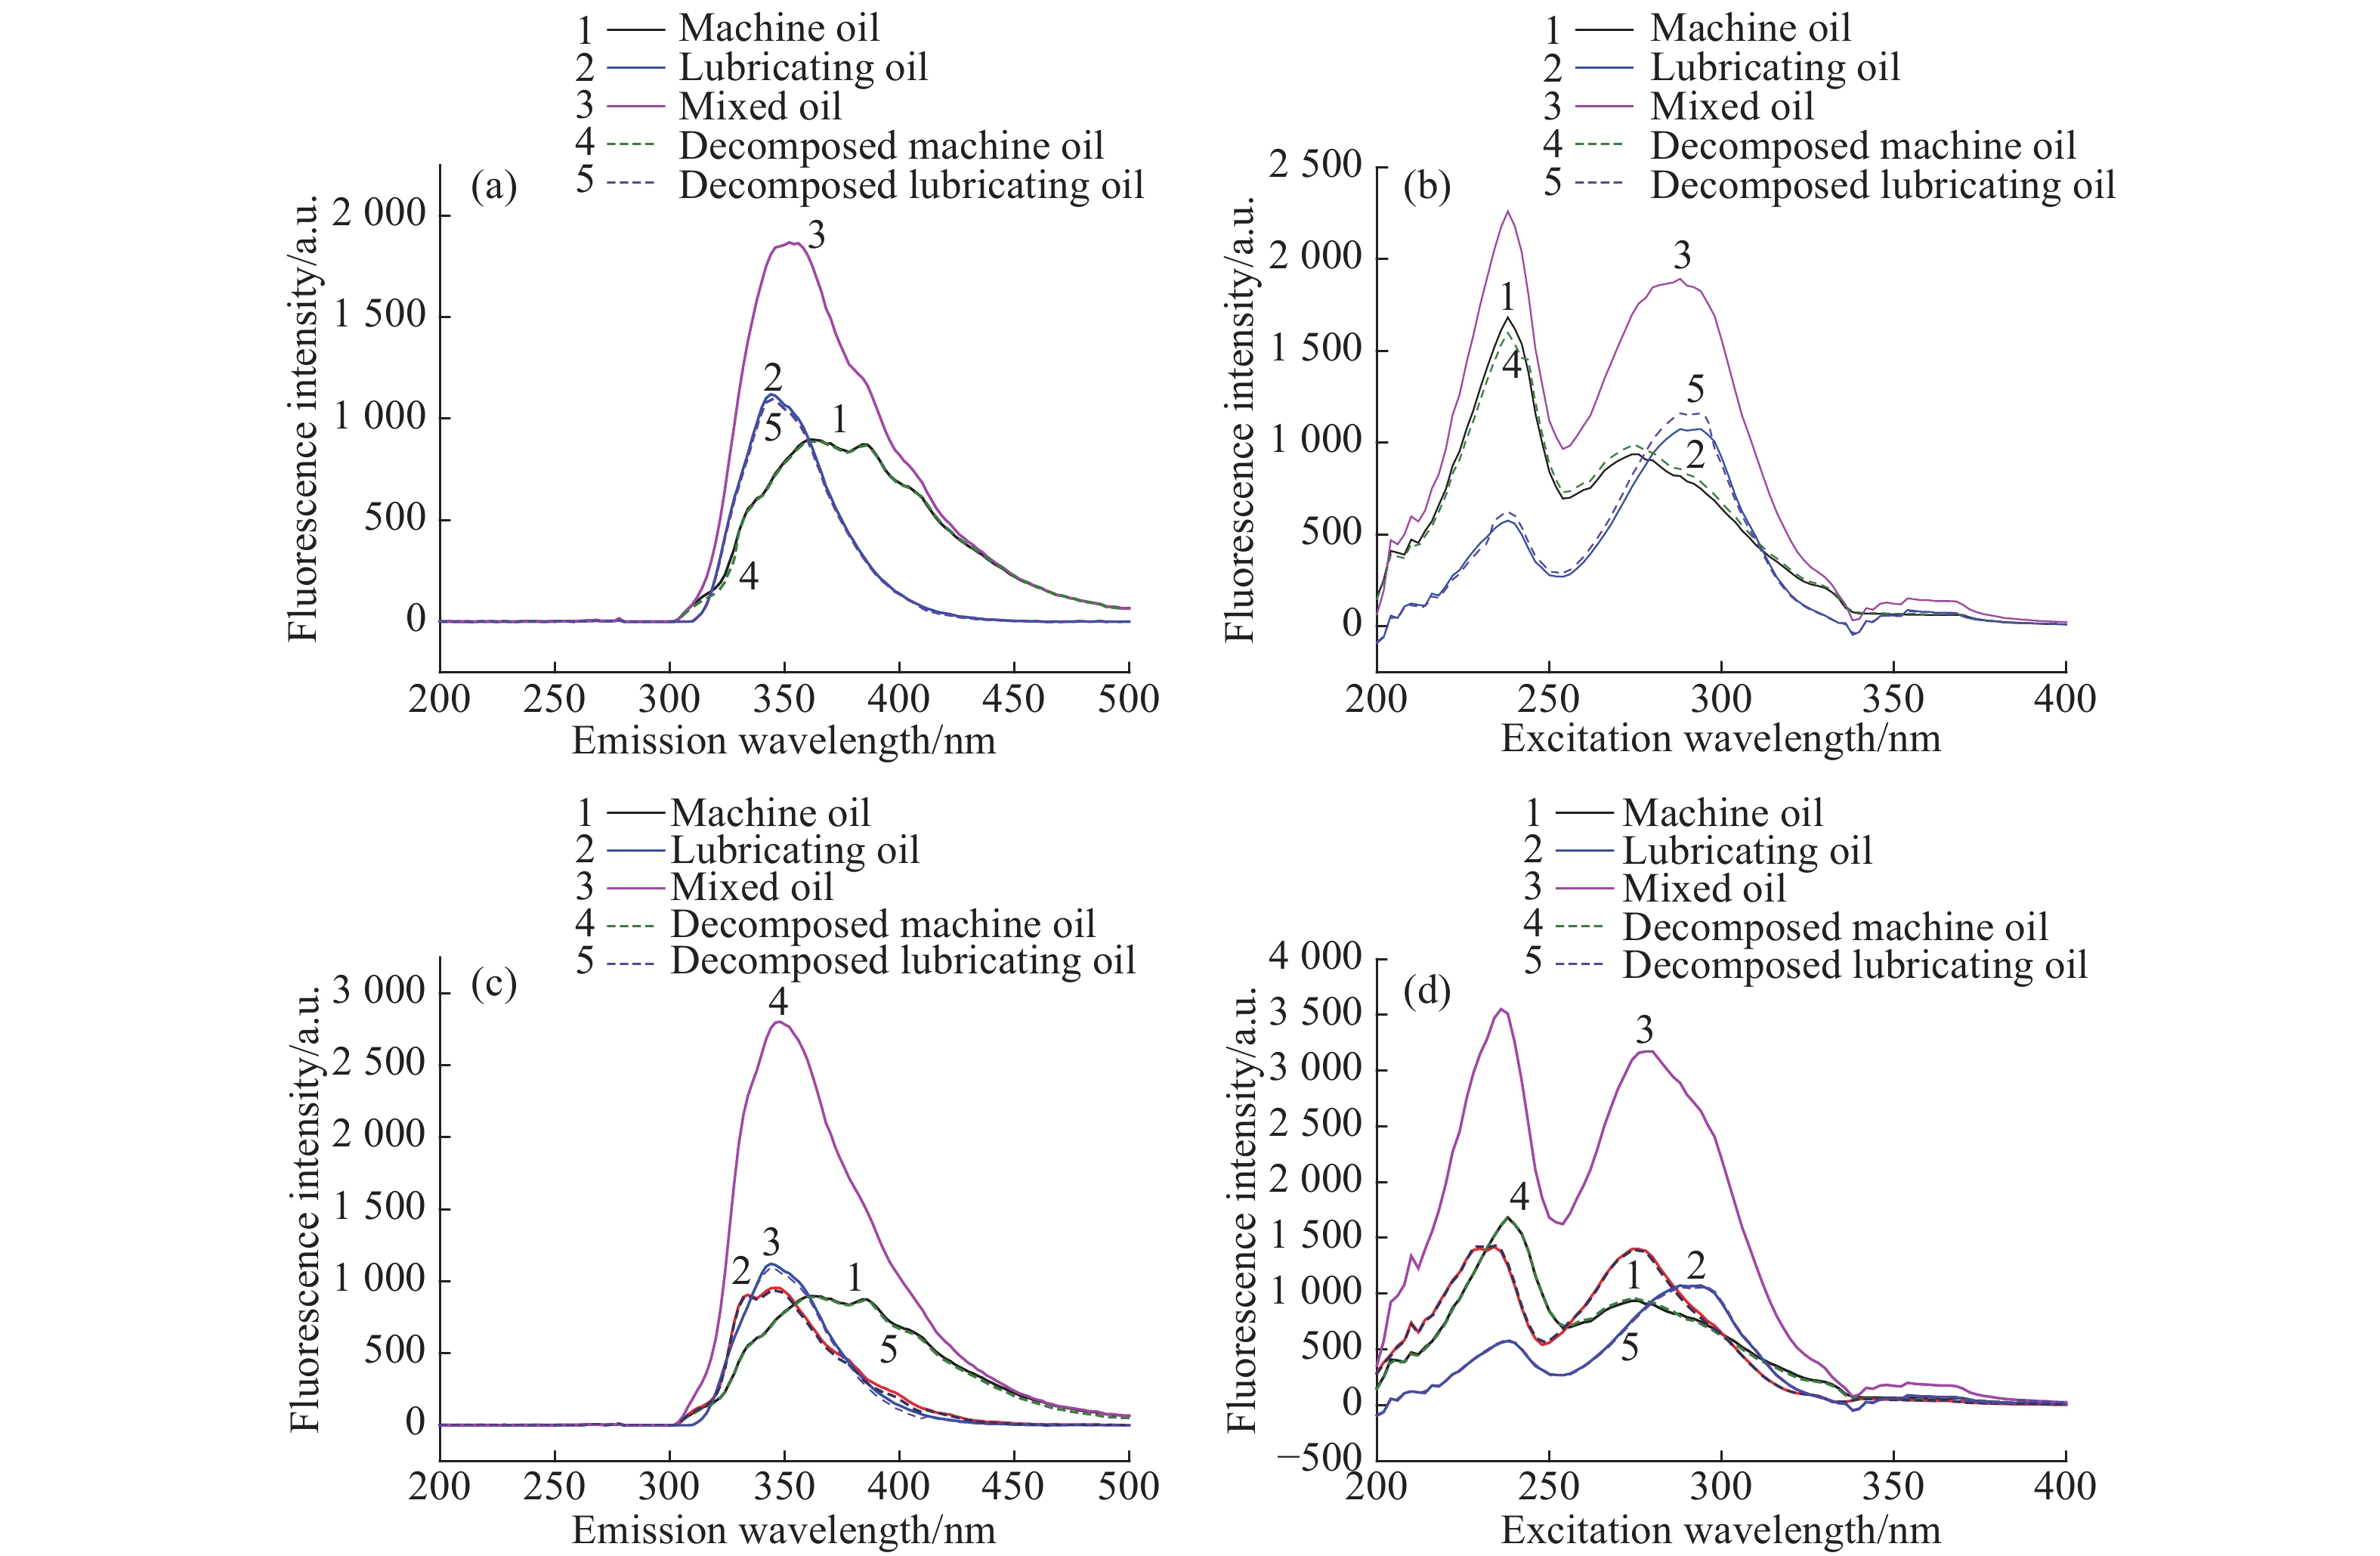
Figure 8. Classifying the mixtures of petroleum hydrocarbons by ATLD. (a) Classification of emission spectra and (b) classification of excitation spectra for the mixture of two; (c) classification of emission spectra and (d) classification of excitation spectra for the mixture of three
Table 1. Contents of mixed petroleum in the configured soil samples(%)
(a) The soil samples with the mixture of two types of petroleum calibration set Machine oil lubricating oil Test set Machine oil lubricating oil 1# 0.11 0.21 17# 0.42 0.41 2# 0.32 0.50 18# 0.61 0.72 3# 0.51 0.52 19# 1.00 1.02 4# 0.52 0.21 20# 0.41 0.23 5# 0.22 0.79 21# 0.64 0.43 6# 0.83 0.52 22# 1.02 5.03 7# 0.82 1.54 23# 2.01 0.52 8# 1.33 2.60 24# 1.50 1.12 9# 1.51 1.12 25# 1.01 10.2 10# 3.14 5.81 26# 2.12 2.41 11# 5.02 4.08 27# 2.52 4.11 12# 3.44 4.47 28# 4.23 3.52 13# 6.78 2.10 29# 6.54 1.12 14# 2.93 5.52 30# 4.61 1.72 15# 7.82 4.22 31# 7.32 2.23 16# 4.13 7.88 32# 8.11 1.12 (b) The soil samples with the mixture of three types of petroleum calibration set Machine oil lubricating oil Diesel oil Test set Machine oil lubricating oil Diesel oil 33# 0.10 0.11 0.13 49# 0.42 0.44 0.43 34# 0.22 0.21 0.24 50# 0.71 0.51 0.62 35# 0.52 0.54 0.49 51# 0.63 0.48 0.32 36# 0.21 0.12 0.54 52# 0.22 1.31 0.42 37# 0.52 0.51 0.11 53# 0.43 1.83 0.62 38# 0.72 0.64 0.72 54# 0.51 1.02 8.01 39# 1.12 4.23 0.84 55# 1.04 8.00 0.52 40# 0.82 0.24 0.49 56# 1.02 1.01 1.01 41# 3.02 4.45 1.03 57# 1.51 0.78 1.18 42# 0.51 5.22 1.47 58# 2.42 5.19 2.11 43# 4.94 0.79 2.33 59# 4.21 1.31 1.51 44# 3.04 3.0 2.45 60# 4.41 2.98 0.64 45# 1.10 1.8 4.41 61# 2.13 0.84 5.20 46# 4.12 2.0 3.30 62# 2.04 0.82 6.41 47# 1.04 0.8 5.51 63# 2.81 0.54 6.05 48# 2.14 1.12 6.70 64# 8.01 0.51 1.03  下载: 导出CSV
Table 2. The coordinates of peak positions in three petroleum hydrocarbons
Types Left area (EX, EM) Right area (EX, EM) Diesel oil (232,334) (288,334) Lubricating oil (236,336) (290,348) Machine oil (238,346) (270,372)
下载: 导出CSV
Table 3. The predicted results of two types of petroleum mixture using PARAFAC
Sample Predicted(%) Recoveries(%) Machine oil Lubricating oil TPHs Machine oil Lubricating oil TPHs 17# 0.35 0.35 0.70 82.38 85.85 84.10 18# 0.52 0.60 1.12 85.74 83.61 84.59 19# 0.87 0.98 1.85 87.00 96.08 91.58 20# 0.34 0.19 0.53 83.90 83.91 83.91 21# 0.54 0.42 0.96 84.06 96.88 89.21 22# 0.82 4.41 5.23 80.00 87.59 86.31 23# 1.82 0.54 2.36 90.30 103.77 93.07 24# 1.26 0.90 2.16 84.00 80.71 82.60 25# 0.92 9.29 10.21 91.29 91.08 91.10 26# 1.70 1.84 3.54 80.38 76.35 78.23 27# 2.24 3.08 5.32 88.97 74.94 80.27 28# 3.11 3.04 6.15 73.52 86.42 79.38 29# 6.09 1.05 7.14 93.12 94.11 93.26 30# 4.13 1.49 5.62 89.61 86.86 88.86 31# 6.11 1.80 7.91 83.50 80.54 82.81 32# 6.75 0.93 7.68 83.24 83.39 83.26 Average recoveries (%) 85.06±4.80 87.01±7.52 85.78±4.70
下载: 导出CSV
Table 4. The predicted results of three types of petroleum mixture using PARAFAC
Sample Predicted(%) Recoveries(%) Machine oil Lubricating oil Diesel oil TPHs Machine oil Lubricating oil Diesel oil TPHs 49# 0.35 0.42 0.38 1.151 83.81 95.45 88.14 89.22 50# 0.58 0.49 0.53 1.61 81.83 96.86 86.13 87.45 51# 0.53 0.42 0.26 1.21 83.97 86.67 81.25 84.27 52# 0.21 1.12 0.35 1.67 93.64 85.34 82.38 85.64 53# 0.37 1.56 0.48 2.41 85.12 85.36 78.06 83.75 54# 0.47 0.86 6.92 8.24 91.18 83.92 86.37 86.36 55# 0.99 6.50 0.45 7.94 95.00 81.25 87.31 83.08 56# 0.85 0.74 0.88 2.47 83.73 72.87 87.23 81.28 57# 1.65 0.71 0.94 3.29 108.94 90.51 79.63 94.83 58# 1.97 4.44 1.95 8.36 81.26 85.53 92.54 85.99 59# 3.50 1.01 1.51 6.02 83.16 77.33 100.00 85.69 60# 4.23 2.12 0.57 6.92 96.00 71.14 88.76 86.20 61# 1.55 0.76 4.78 7.09 72.72 90.24 92.00 86.79 62# 1.70 0.83 5.40 7.94 83.43 101.59 84.32 85.65 63# 2.53 0.49 4.97 7.99 90.18 90.30 82.09 84.98 64# 6.70 0.40 0.81 7.91 83.61 78.43 78.64 82.80 Average recoveries (%) 87.35±8.03 85.80±8.14 85.92±5.60 85.87±2.97
下载: 导出CSV
Table 5. The predicted results of two types of petroleum mixtures using ATLD
Sample Predicted(%) Recoveries(%) Machine oil Lubricating oil TPHs Machine oil Lubricating oil TPHs 17# 0.41 0.39 0.80 97.62 95.12 96.39 18# 0.59 0.69 1.28 96.72 95.83 96.24 19# 0.99 0.98 1.97 99.00 96.08 97.52 20# 0.39 0.22 0.61 95.12 95.65 95.31 21# 0.61 0.41 1.02 95.31 95.35 95.33 22# 0.98 4.95 5.93 96.08 98.41 98.02 23# 1.89 0.51 2.40 94.03 98.08 94.86 24# 1.48 1.1 2.58 98.67 98.21 98.47 25# 0.98 9.48 10.46 97.03 92.94 93.31 26# 2.05 2.36 4.41 96.70 97.93 97.35 27# 2.43 4.05 6.48 96.43 98.54 97.74 28# 4.16 3.48 7.64 98.35 98.86 98.58 29# 6.45 1.11 7.56 98.62 99.11 98.69 30# 4.53 1.68 6.21 98.26 97.67 98.10 31# 7.26 2.19 9.45 99.18 98.21 98.95 32# 8.09 1.11 9.20 99.75 99.11 99.67 Average recoveries (%) 97.30±1.59 97.19±1.74 97.16±1.70
下载: 导出CSV
Table 6. The predicted results of three types of petroleum mixtures using ATLD
Sample Predicted(%) Recoveries(%) Machine oil Lubricating oil Diesel oil TPHs Machine oil Lubricating oil Diesel oil TPHs 49# 0.39 0.41 0.41 1.151 92.86 93.18 95.35 93.80 50# 0.69 0.46 0.59 1.61 97.18 90.20 95.16 94.57 51# 0.59 0.47 0.29 1.21 93.65 97.92 90.63 94.41 52# 0.21 1.24 0.39 1.67 95.45 94.66 92.86 94.36 53# 0.39 1.75 0.59 2.41 90.70 95.63 95.16 94.79 54# 0.49 0.98 7.89 8.24 96.08 96.08 98.50 98.11 55# 0.99 7.49 0.51 7.94 95.19 93.62 98.08 94.04 56# 1.01 0.98 0.99 2.47 99.02 97.03 98.02 98.03 57# 1.44 0.75 1.13 3.29 95.36 96.15 95.76 95.68 58# 2.38 5.14 1.99 8.36 98.35 99.04 94.31 97.84 59# 4.01 1.24 1.5 6.02 95.25 94.66 99.34 96.02 60# 4.13 2.89 0.59 6.92 93.65 96.98 92.19 94.77 61# 2.09 0.79 5.11 7.09 98.12 94.05 98.27 97.80 62# 1.96 0.78 6.39 7.94 96.08 95.12 99.69 98.49 63# 2.69 0.5 5.69 7.99 95.73 92.59 94.05 94.47 64# 7.69 0.49 0.99 7.91 96.00 96.08 96.12 96.02 Average recoveries (%) 95.54±2.00 95.19±2.05 95.84±2.50 95.82±1.58
下载: 导出CSV
-
[1] PIETROSKI J P, WHITE J R, DELAUNE R D, et al. Fresh and weathered crude oil effects on potential denitrification rates of coastal marsh soil[J]. Chemosphere, 2015, 134: 120-126. doi: 10.1016/j.chemosphere.2015.03.056 [2] GAO Y, DAI L K, ZHU H D, et al. Quantitative analysis of main components of natural gas based on raman spectroscopy[J]. Chinese Journal of Analytical Chemistry, 2019, 47(1): 67-76. (in Chinese) [3] CAO J J, SUN Q R, LI W H, et al. Fluorescence properties of magnoflorine and its application in analysis of traditional chinese medicine[J]. Chinese Journal of Analytical Chemistry, 2019, 47(6): 950-956. (in Chinese) [4] RAMADASS K, MEGHARAJ M, VENKATESWARLU K, et al. Bioavailability of weathered hydrocarbons in engine oil-contaminated soil: Impact of bioaugmentation mediated by Pseudomonas spp. on bioremediation[J]. Science of the Total Environment, 2018, 636: 968-974. doi: 10.1016/j.scitotenv.2018.04.379 [5] SIM A, CHO Y, KIM D, et al. Molecular-level characterization of crude oil compounds combining reversed-phase high-performance liquid chromatography with off-line high-resolution mass spectrometry[J]. Fuel, 2015, 140: 717-723. doi: 10.1016/j.fuel.2014.10.019 [6] POLLO B J, ALEXANDRINO G L, AUGUSTO F, et al. The impact of comprehensive two-dimensional gas chromatography on oil & gas analysis: Recent advances and applications in petroleum industry[J]. TrAC Trends in Analytical Chemistry, 2018, 105: 202-217. doi: 10.1016/j.trac.2018.05.007 [7] SHIMAMOTO G G, TUBINO M. Alternative methods to quantify biodiesel in standard diesel-biodiesel blends and samples adulterated with vegetable oil through UV–Visible spectroscopy[J]. Fuel, 2016, 186: 199-203. doi: 10.1016/j.fuel.2016.08.076 [8] FORINA M, OLIVERI P, BAGNASCO L, et al. Artificial nose, NIR and UV–visible spectroscopy for the characterisation of the PDO Chianti Classico olive oil[J]. Talanta, 2015, 144: 1070-1078. doi: 10.1016/j.talanta.2015.07.067 [9] SONG B R, ZHEN M N, LIU X M, et al. Real-time fluorescence quantitative polymerase chain reaction for anaerobic degradation genes masD and bamA in petroleum hyadrocarbons[J]. Chinese Journal of Analytical Chemistry, 2019, 47(2): 207-213. (in Chinese) [10] LI B N, WANG H X, ZHAO Q J, et al. Rapid detection of authenticity and adulteration of walnut oil by FTIR and fluorescence spectroscopy: A comparative study[J]. Food Chemistry, 2015, 181: 25-30. doi: 10.1016/j.foodchem.2015.02.079 [11] DENG W, QING X D, CHEN M, et al. Chemometrics-assisted three-dimensional room temperature phosphorescence for apid quantitative determination of acenaphthene contents in air-pollution samples[J]. Chinese Journal of Analytical Chemistry, 2018, 46(9): 1438-1445. (in Chinese) [12] XU J L, WANG J, WANG C, et al. Effective oxidation of crude oil in soils by consuming less hydroxyl radical with target iron[J]. Chemical Engineering Journal, 2020, 380: 122414. doi: 10.1016/j.cej.2019.122414 [13] LEMKE M, FERNÁNDEZ-TRUJILLO R, LÖHMANNSRÖBENC H G. In-situ LIF analysis of biological and petroleum-based hydraulic oils on soil[J]. Sensors, 2005, 5(1): 61-69. doi: 10.3390/s5010061 [14] SINSKI J F, COMPTON B S, PERKINS B S, et al. Utilizing three-dimensional fluorescence's red-shift cascade effect to monitor mycobacterium PRY-1 degradation of aged petroleum[J]. Applied Spectroscopy, 2004, 58(1): 91-95. doi: 10.1366/000370204322729513 [15] FERRETTO N, TEDETTI M, GUIGUE C, et al. Identification and quantification of known polycyclic aromatic hydrocarbons and pesticides in complex mixtures using fluorescence excitation–emission matrices and parallel factor analysis[J]. Chemosphere, 2014, 107: 344-353. doi: 10.1016/j.chemosphere.2013.12.087 [16] YIN J, LIU J Z, CHEN T, et al. Influence of melanoidins on acidogenic fermentation of food waste to produce volatility fatty acids[J]. Bioresource Technology, 2019, 284: 121-127. doi: 10.1016/j.biortech.2019.03.078 [17] MA ZH F, YANG Y, LIAN X Y, et al. Identification of nitrate sources in groundwater using a stable isotope and 3DEEM in a landfill in Northeast China[J]. Science of the Total Environment, 2016, 563-564: 593-599. doi: 10.1016/j.scitotenv.2016.04.117 [18] CHRISTENSEN J H, HANSEN A B, MORTENSEN J, et al. Characterization and matching of oil samples using fluorescence spectroscopy and parallel factor analysis[J]. Analytical Chemistry, 2005, 77(7): 2210-2217. doi: 10.1021/ac048213k [19] LIU Y, WANG T T, YANG J. Evaluating the quality of mine water using hierarchical fuzzy theory and fluorescence regional integration[J]. Mine Water and the Environment, 2019, 38(2): 243-251. doi: 10.1007/s10230-018-0567-4 [20] ZHANG SH R, WU H L, CHEN Y, et al. An investigation on hydrogen bonding between 3-methylindole and ethanol using trilinear decomposition of fluorescence excitation–emission matrices[J]. Chemometrics and Intelligent Laboratory Systems, 2013, 121: 9-14. doi: 10.1016/j.chemolab.2012.11.014 -

 下载:
下载:


计量
- 文章访问数: 3230
- HTML全文浏览量: 1184
- PDF下载量: 98
- 被引次数: 0
