


-
摘要: 作为一种新型快速的物质成分分析技术,激光诱导击穿光谱(Laser-Induced Breakdown Spectroscopy, LIBS)已经在越来越多的工业领域中被证明具有巨大的应用潜力。然而,由于野外作业或工业现场检测环境嘈杂恶劣,对仪器设备的尺寸和抗恶劣环境的能力提出了更高的要求。近年来,新型激光器的发展进一步促进了LIBS仪器化的进程,使得其逐渐从实验室迈向工业应用,同时也使得LIBS系统逐渐趋于仪器化、专业化、便携化。本文综述了便携式LIBS的发展历程,对各种激光光源(小型Nd:YAG固体激光器、二极管泵浦固体激光器、微片激光器、光纤激光器以及光纤传能的方案)应用于便携式LIBS系统的最新研究进展进行了综述和分类讨论,探讨了当前便携式LIBS存在的基本问题,并对其未来发展趋势进行了展望。Abstract:As a new rapid element analysis technique, Laser-Induced Breakdown Spectroscopy (LIBS) has proven iteself to have great potential for applications in increasingly numerous industrial fields. However, due to harsh outdoor and industrial environments, newer and higher requirements are being demanded of the LIBS system, such as the size of its instruments and the ability to resist a harsh environment. The rapid development of new laser technology promotes instrumentation for LIBS, allowing it to gradually step outside the laboratory and into the industry, and allows the LIBS system to gradually move towards instrumentation, miniaturization and portability.In this paper, the development of a portable LIBS that was developed in recent years was reviewed. The application and latest research progress of different kinds of laser source (small lamp pumped solid-state laser, diode pump solid-state laser and micro laser, fiber laser) applied to the portable LIBS system were summarized and discussed, providing insight into both the fiber optic LIBS (FO-LIBS) and the handheld LIBS. In addition, the basic problems of current portable LIBS and the prospects of its future were proposed and discussed.
-
Key words:
- laser-induced breakdown spectroscopy /
- portable /
- laser /
- element detection
-
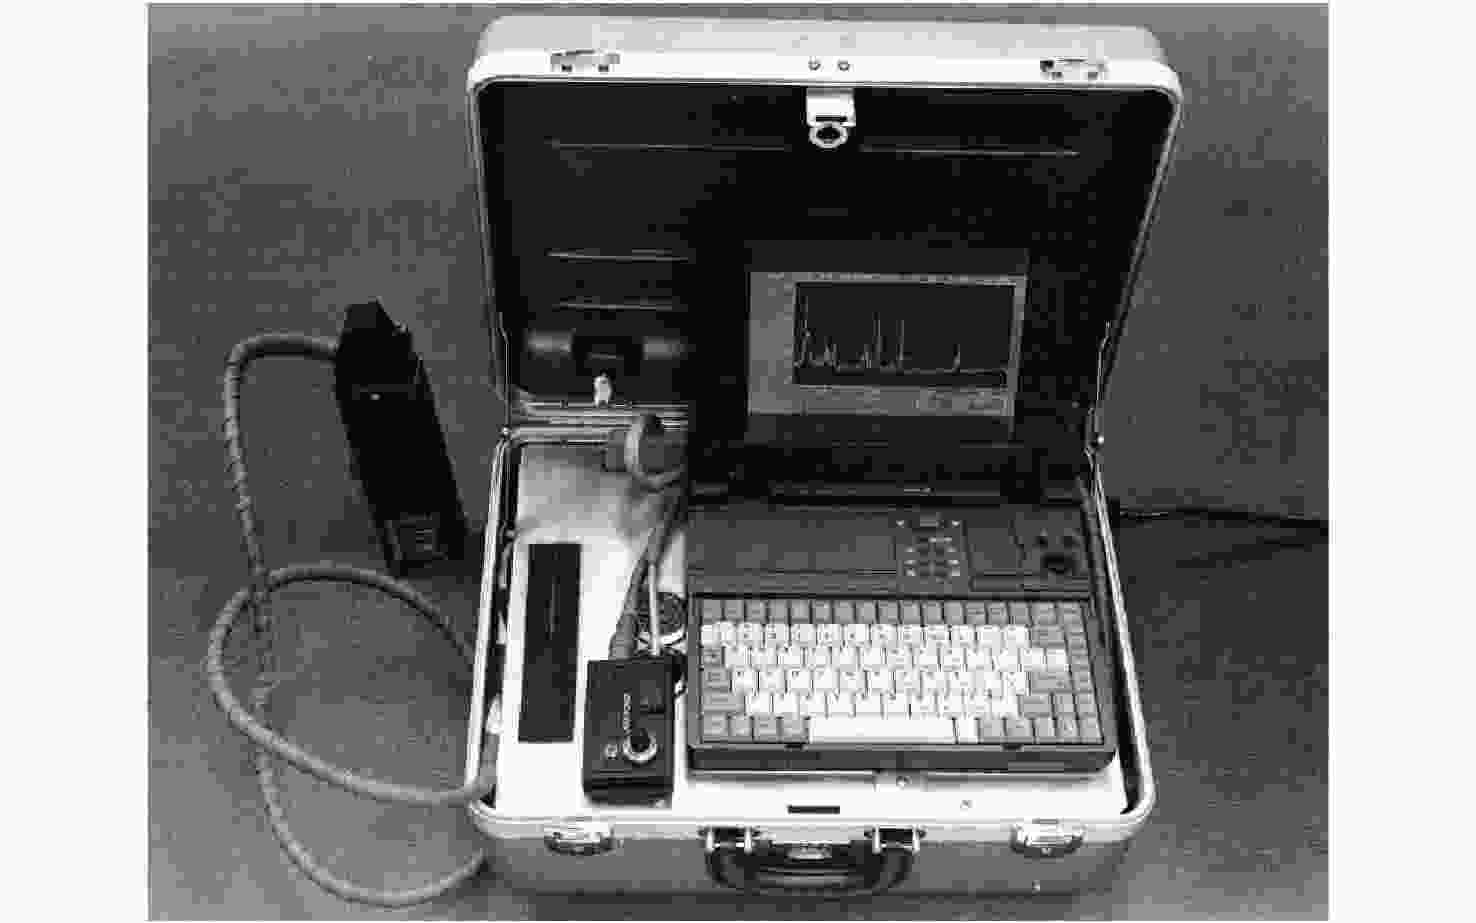
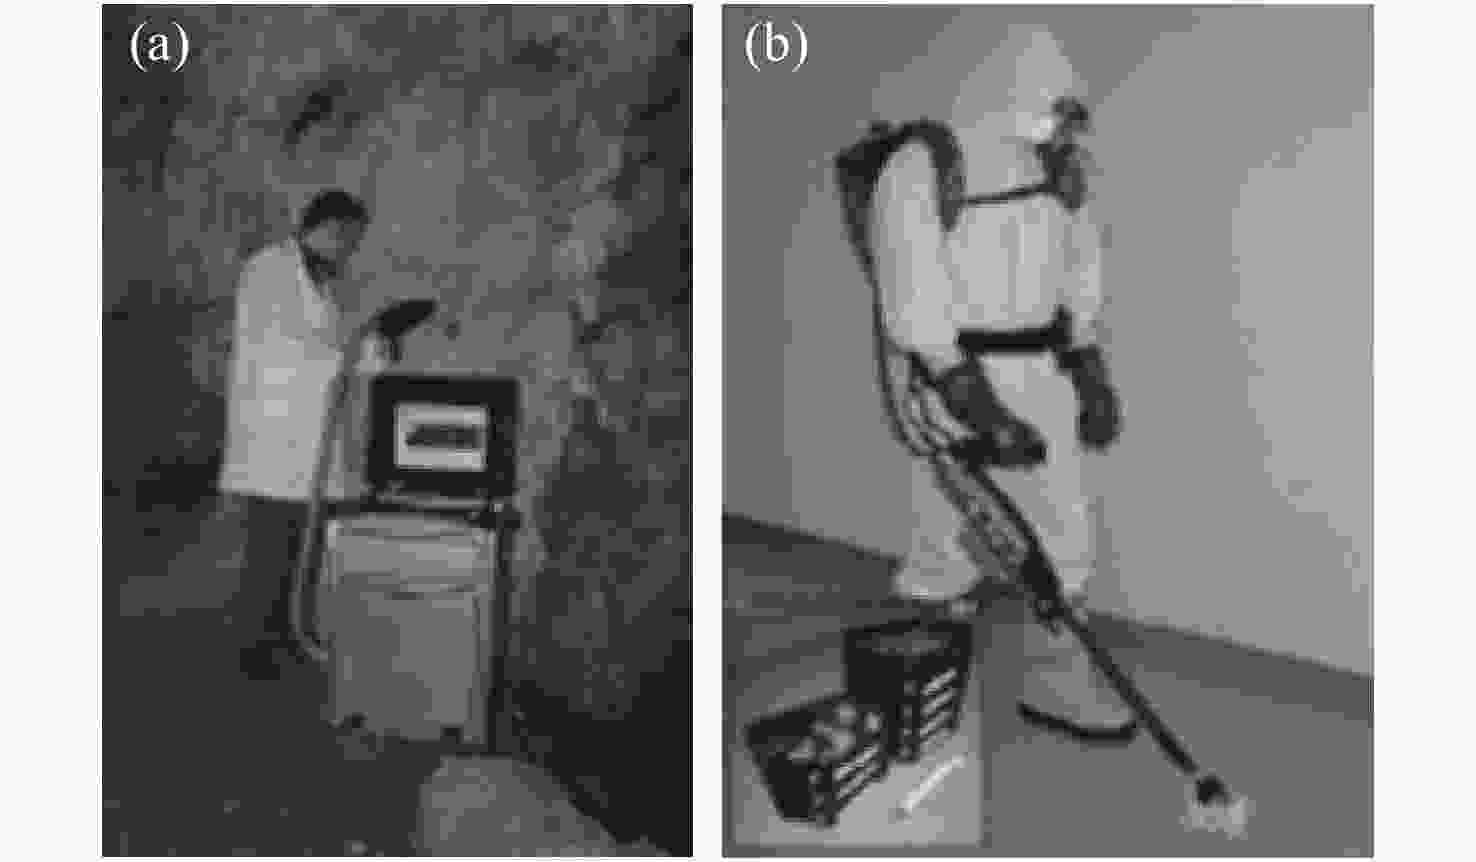
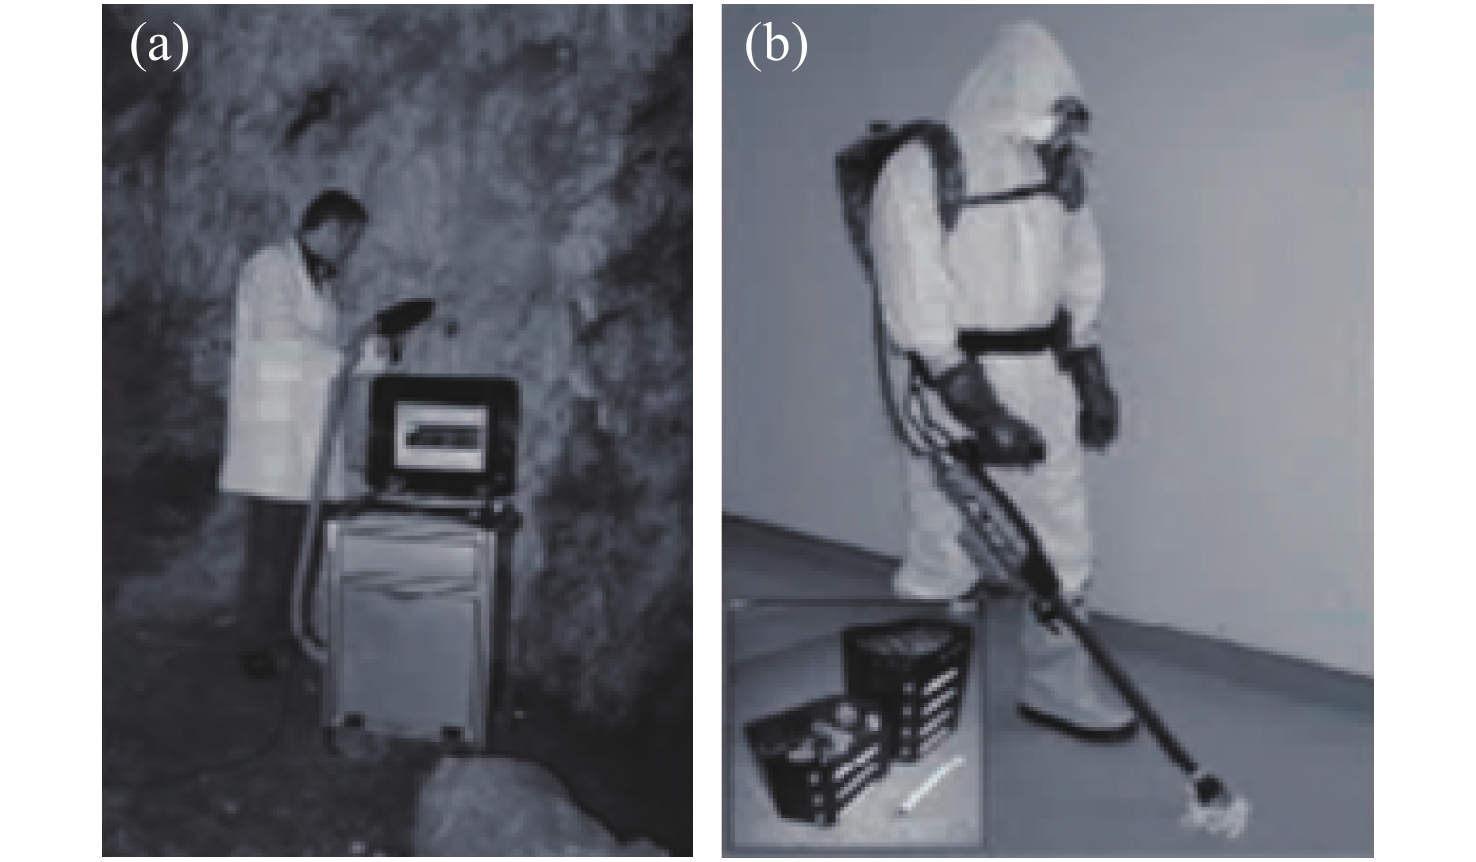
图 3 Laserna等人研发的两种便携式LIBS设备:(a)箱式(Nd: YAG, 1064 nm, 50 mJ/pulse, 6.5 ns)[26], (b)背包式 (Nd: YAG, 1064 nm, 50 mJ/pulse, 10 ns)[27]
Figure 3. Two types of portable LIBS equipment developed by Laserna et al. : (a) a box type (Nd: YAG, 1064 nm, 50 mJ/pulse, 6.5 ns)[26], (b) a backpack type (Nd: YAG, 1064 nm, 50 mJ/pulse, 10 ns)[27]
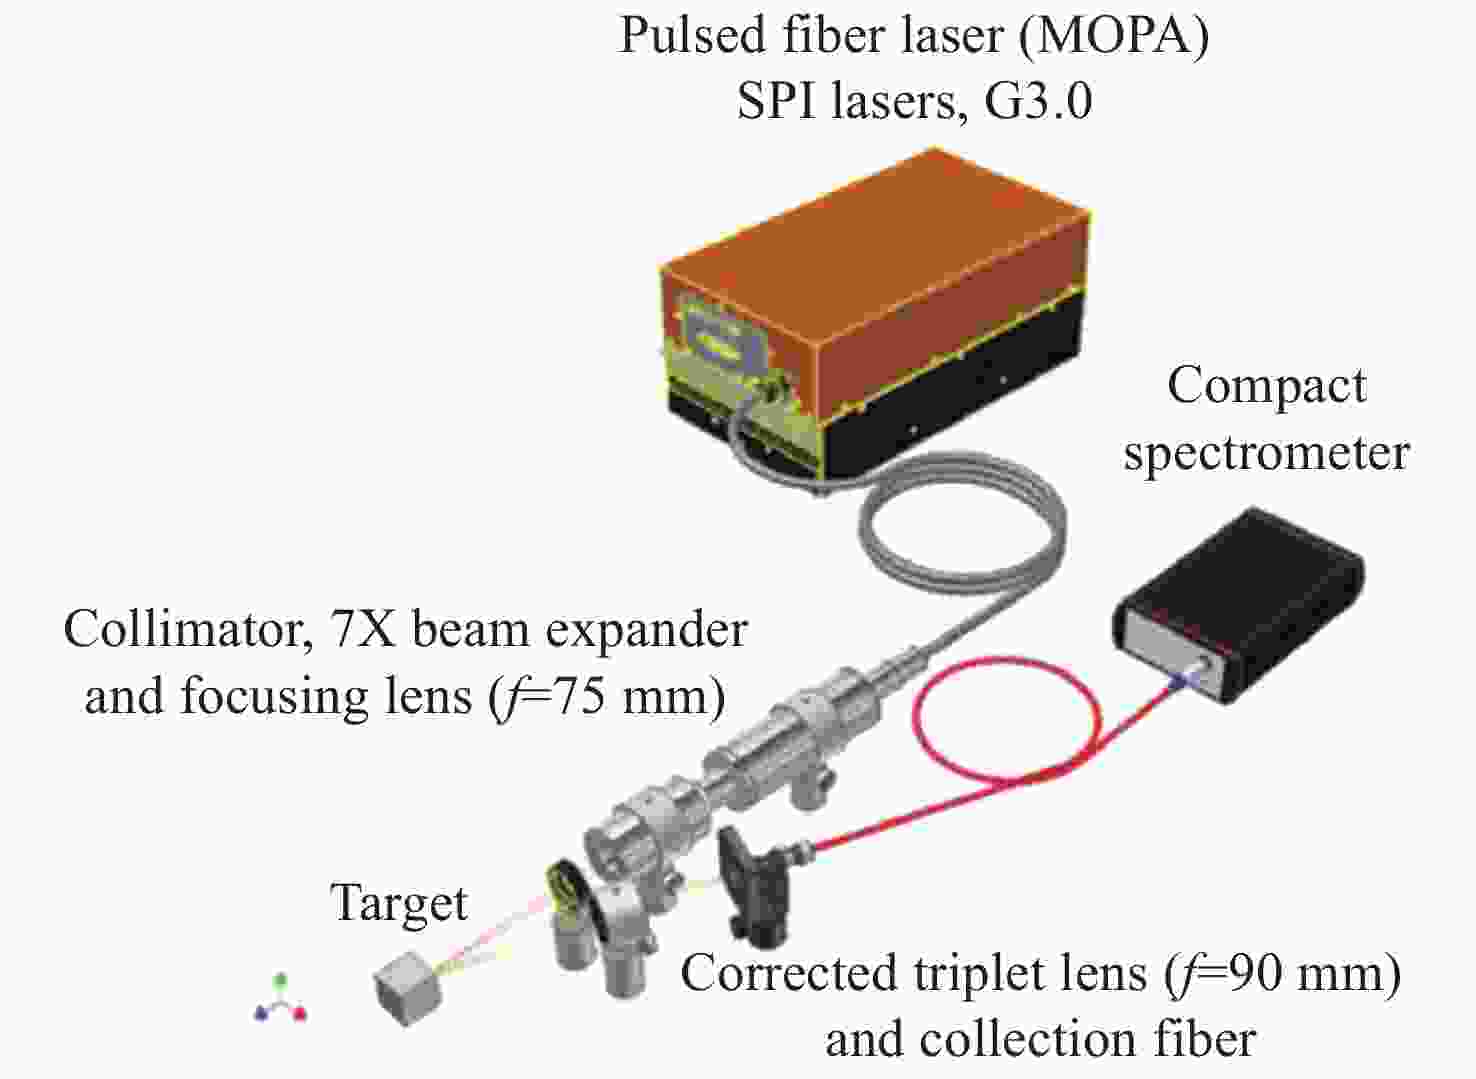

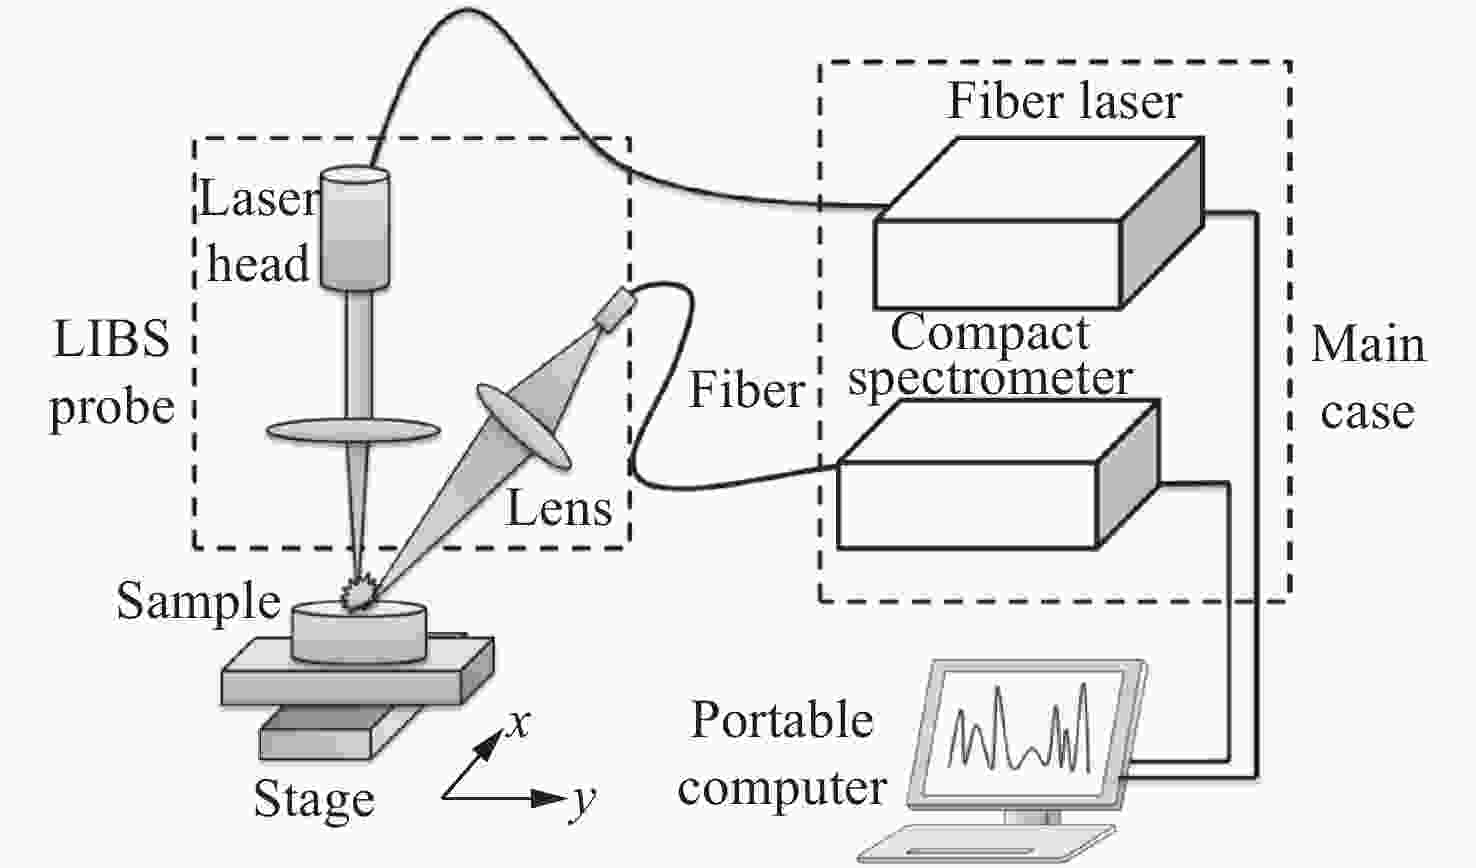

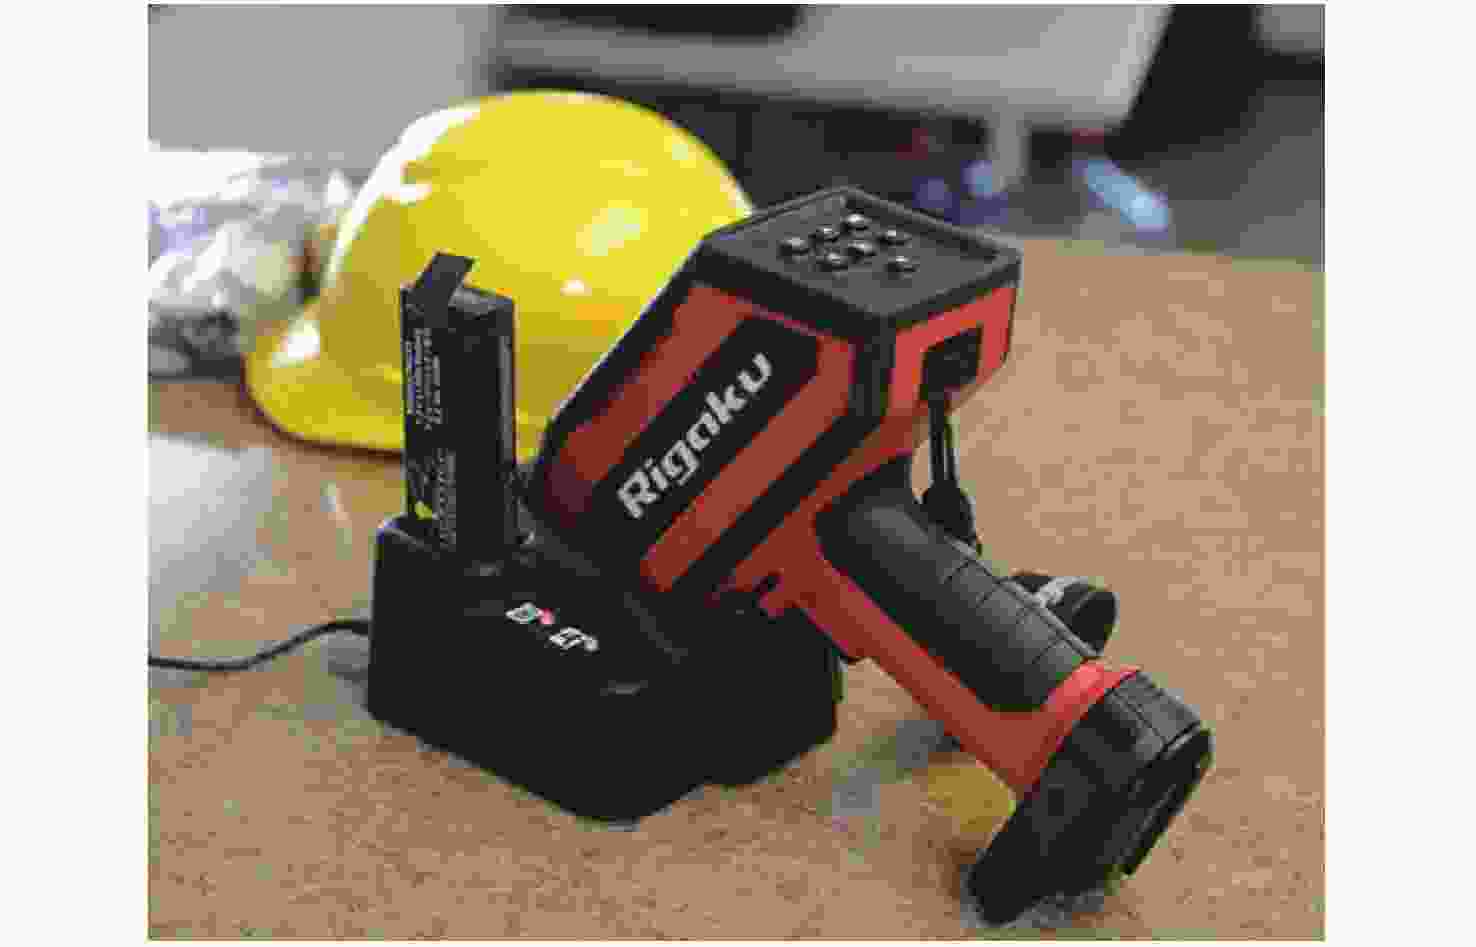
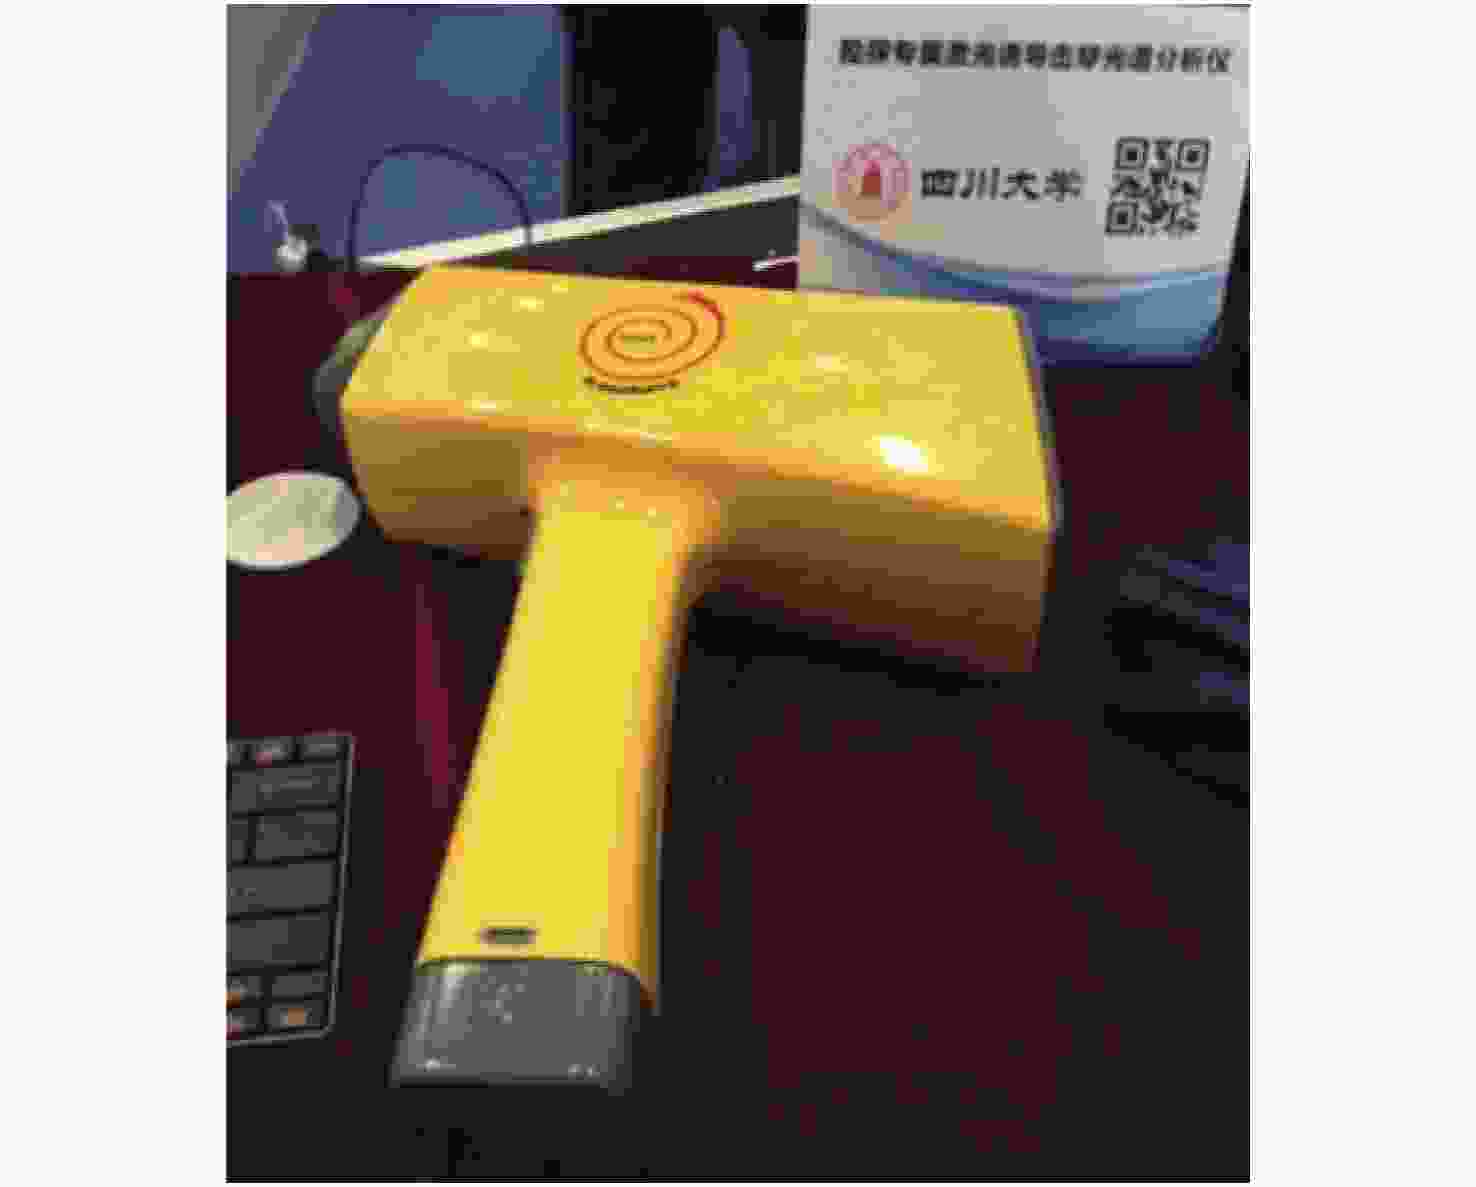
表 1 基于DPSS激光器、光纤激光器和光纤传能的便携式LIBS的比较
Table 1. The comparison of several kinds of LIBS systems based on a DPSS laser, a fiber laser and FO-LIBS
激光器 优点 缺点 分析性能 适用领域 DPSS激光器 工作寿命长、功耗低、
自然冷却、小巧便携能量较低、谱线波动性较大 生铁中Mn、V、Ti和Cr元素的LOD分别为171 μg/g、128 μg/g、99 μg/g和
59 μg/g,R2分别为0.994、0.996、
0.994和0.991[2]手持式野外测量、电池
供电、原位测量光纤激光器 抗恶劣环境、体积小、
价格便宜连续背景干扰、烧蚀坑深,
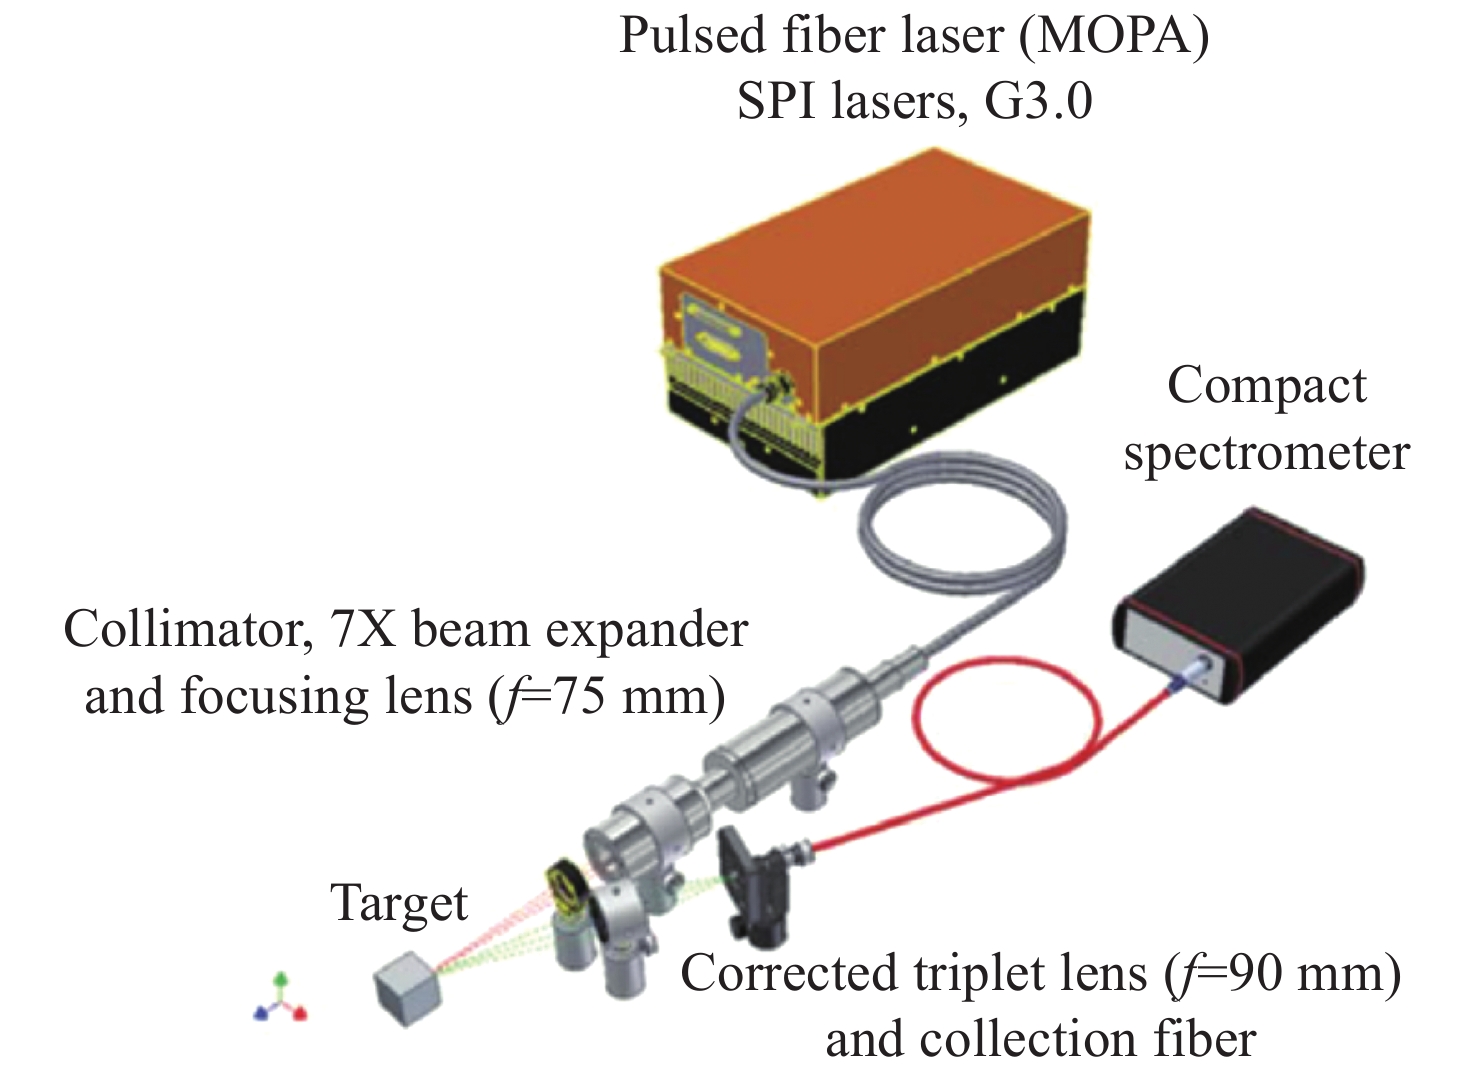
破坏性较大铝基中Mg的LOD为1.1 μg/g,R2=0.994;黄铜中Ni的LOD为21.3 ug/g,R2=0.997[52];生铁中的Mn、V,Si的LOD分别为195 μg/g、48 μg/g和110 μg/g, R2分别为0.997、0.991和0.992[54] 工厂、矿山等恶劣工作
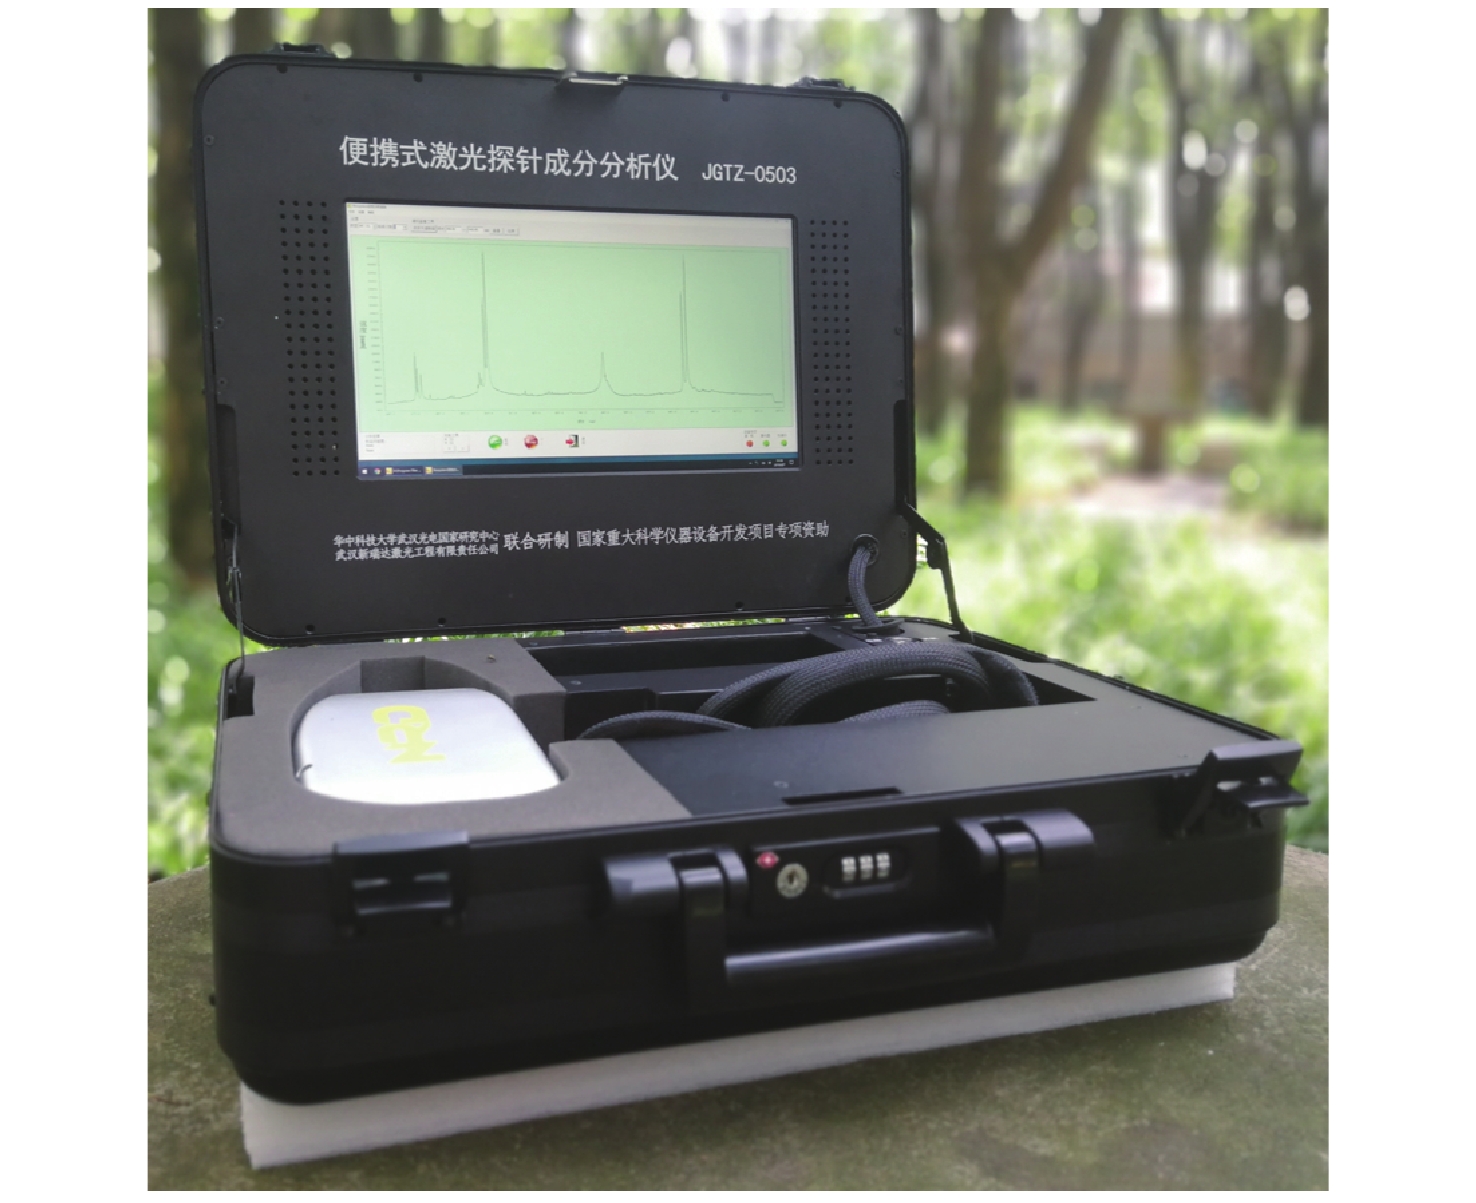
环境,在线测量光纤传能 避免复杂光路系统和外界
干扰、降低自吸收效应能量低,LOD较差 生铁中Mn和Ti元素LOD分别为1219 μg/g, 257 μg/g, R2分别为0.997, 0.998[61] 在线、原位测量,
移动式测量 下载: 导出CSV
表 2 几种手持式LIBS的参数比较
Table 2. Parameters of several handheld LIBS
型号 研发单位 激光光源 体积、重量 参数及性能 LEA Handheld LIBS[62] 芬兰Lasersec Systems公司 DPSS激光器 22.6 cm×9 cm×29 cm,
1.75 kg平均功率0.5 W,光谱范围220~400 nm,续航2 h,LOD可达到μg/g级,可用于爆炸物、金属、食品与药品分类。 MPulse[63] 英国牛津公司 准连续固体调Q激光器 9 cm×23 cm×21 cm,
1.8 kg频率4 kHz,峰值功率小于0.5 W,电池支持250次测试,可用于合金鉴别与金属分拣。 高能手持式LIBS[65] 四川大学 被动调Q的Nd: YAG
激光器33 cm×11 cm×32 cm,
2.95 kg单脉冲能量达100 mJ,光谱范围220~397 nm,可元素定量测定,岩屑岩性识别等。 KT-100S[64] 美国Rigaku公司 波长1064 nm的3B级
激光器24.3 cm×8.4 cm×25.7 cm,
1.5 kg光谱范围200~480 nm,分辨率小于0.2 nm,电池供电10 h,可用于样品分类。 ChemLite[66] 美国TSI公司 波长1574 nm的人眼安全激光器 30.5 cm×25.4 cm×10.2 cm,
2.4 kg1574 nm人眼安全波长,光谱范围200~700 nm,一次充电支持1300次检测,探测范围低至0.01%。 μ-LIBS[67] 必达泰克公司 DPSS激光器 27.9 cm×8.9 cm×27.9 cm,
1.8 kg最大输出功率200 mW,脉宽小于1 ns,脉冲频率2 kHz,波长范围185~680 nm,分辨率0.4 nm。 z-200c+手持式LIBS
分析仪[68]SciAps公司 波长1064 nm的Nd: YAG激光器 21 cm×30 cm×12 cm,
1.82 kg脉宽1~2 ns,单脉冲能量5.5 mJ,重复频率50 Hz,光谱范围190~620 nm,用于原位分析钢中C含量。
下载: 导出CSV
-
[1] CIUCCI A, CORSI M, PALLESCHI V, et al. New procedure for quantitative elemental analysis by laser-induced plasma spectroscopy[J]. Applied Spectroscopy, 1999, 53(8): 960-964. doi: 10.1366/0003702991947612 [2] 曾庆栋. 移动式/便携式激光探针成分分析仪的研究与开发[D]. 武汉: 华中科技大学, 2016.ZENG Q D. Research and development on portable laser-induced breakdown spectroscopy[D]. Wuhan: Huazhong University of Science and Technology, 2016. (in Chinese) [3] 曾坤, 马源源, 郭庆中, 等. 电感耦合等离子发射光谱法快速测定对苯二甲酰氯中氯化亚砜残留量[J]. 分析化学,2019,47(3):410-414.ZENG K, MA Y Y, GUO Q ZH, et al. Determination of thionyl chloride residue in terephthaloyl chloride by inductively coupled plasma-optical emission spectrometry[J]. Chinese Journal of Analytical Chemistry, 2019, 47(3): 410-414. (in Chinese) [4] 付东旭, 郑令娜, 刘金辉, 等. 激光剥蚀-电感耦合等离子体质谱定量分析单细胞中的银纳米颗粒[J]. 分析化学,2019,47(9):1390-1394.FU D X, ZHENG L N, LIU J H, et al. Quantitative analysis of silver nanoparticles in single cell by laser ablation inductively coupled plasma-mass spectrometry[J]. Chinese Journal of Analytical Chemistry, 2019, 47(9): 1390-1394. (in Chinese) [5] 李小莉, 李庆霞, 安树清, 等. X射线荧光光谱法测定土壤样品中的氟[J]. 分析化学,2019,47(11):1864-1869.LI X L, LI Q X, AN SH Q, et al. Determination of fluorine in soil sample by X-ray fluorescence spectrometry[J]. Chinese Journal of Analytical Chemistry, 2019, 47(11): 1864-1869. (in Chinese) [6] 陈国成, 黎应芬. 火花直读光谱法测定铝及铝合金中的钒含量[J]. 中国无机分析化学,2017,7(3):59-61. doi: 10.3969/j.issn.2095-1035.2017.03.015CHEN G CH, LI Y F. Determination of vanadium content in aluminum and aluminum alloys by spark emission spectrometry[J]. Chinese Journal of Inorganic Analytical Chemistry, 2017, 7(3): 59-61. (in Chinese) doi: 10.3969/j.issn.2095-1035.2017.03.015 [7] NG C W, HO W F, CHEUNG N H. Spectrochemical analysis of liquids using laser-induced plasma emissions: effects of laser wavelength on plasma properties[J]. Applied Spectroscopy, 1997, 51(7): 976-983. doi: 10.1366/0003702971941638 [8] WIENS R C, ARVIDSON R E, CREMERS D A, et al. Combined remote mineralogical and elemental identification from rovers: field and laboratory tests using reflectance and laser-induced breakdown spectroscopy[J]. Journal of Geophysical Research, 2002, 107(E11): 8004. [9] SALLÉ B, CREMERS D A, MAURICE S, et al. Laser-induced breakdown spectroscopy for space exploration applications: influence of the ambient pressure on the calibration curves prepared from soil and clay samples[J]. Spectrochimica Acta Part B:Atomic Spectroscopy, 2005, 60(4): 479-490. doi: 10.1016/j.sab.2005.02.009 [10] 郭连波. 激光诱导击穿光谱中的等离子体发射光谱增强方法研究[D]. 武汉: 华中科技大学, 2012.GUO L B. Investigation of enhancement method for optical emission spectroscopy of plasmas from laser-induced breakdown spectrum[D]. Wuhan: Huazhong University of Science and Technology, 2012. (in Chinese). [11] 袁冬青, 周明, 刘长隆, 等. 激光感生击穿光谱技术(LIBS)的原理及影响因素[J]. 光谱学与光谱分析,2008,28(9):2019-2023. doi: 10.3964/j.issn.1000-0593(0008)09-2019-05YUAN D Q, ZHOU M, LIU CH L, et al. The theory and the influential factors of laser induced breakdown spectroscopy[J]. Spectroscopy and Spectral Analysis, 2008, 28(9): 2019-2023. (in Chinese) doi: 10.3964/j.issn.1000-0593(0008)09-2019-05 [12] NOLL R. Laser-Induced Breakdown Spectroscopy: Fundamentals and Applications[M]. Berlin: Springer, 2012. [13] RAKOVSKÝ J, ČERMÁK P, MUSSET O, et al. A review of the development of portable laser induced breakdown spectroscopy and its applications[J]. Spectrochimica Acta Part B:Atomic Spectroscopy, 2014, 101(3): 269-287. [14] SINGH J P, ALMIRALL J R, SABSABI M, et al. Laser-induced breakdown spectroscopy (LIBS)[J]. Analytical and Bioanalytical Chemistry, 2011, 400(10): 3191-3192. doi: 10.1007/s00216-011-5073-5 [15] 段忆翔, 林庆宇. 激光诱导击穿光谱分析技术及其应用[M]. 北京: 科学出版社, 2016: 11.DUAN Y X, LIN Q Y. Laser-Induced Breakdown Spectroscopy and Its Application[M]. Beijing: Science Press, 2016: 11. (in Chinese) [16] 中华人民共和国国家质量监督检验检疫总局, 中国国家标准化管理委员会. GB/T 20125-2006 低合金钢 多素的测定 电感耦合等离子体发射光谱法[S]. 北京: 中国标准出版社, 2006.General Administration of Quality Supervision, Inspection and Quarantine of the People’s Republic of China, National Standardization Administration of China. GB/T 20125-2006 Low-alloy steel—Determination of multi-element contents—Inductively coupled plasma atomic emission spectrometric method[S]. Beijing: China standard Press, 2006. (in Chinese). [17] HAHN D W, OMENETTO N. Laser-Induced Breakdown Spectroscopy (LIBS), Part Ⅱ: review of instrumental and methodological approaches to material analysis and applications to different fields[J]. Applied Spectroscopy, 2012, 66(4): 347-419. doi: 10.1366/11-06574 [18] ZENG Q D, CHEN G H, CHEN X G, et al. Rapid online analysis of trace elements in steel using a mobile fiber-optic laser-induced breakdown spectroscopy system[J]. Plasma Science and Technology, 2020, 22(7): 074013. doi: 10.1088/2058-6272/ab8a0b [19] YAMAMOTO K Y, CREMERS D A, FERRIS M J, et al. Detection of metals in the environment using a portable laser-induced breakdown spectroscopy instrument[J]. Applied Spectroscopy, 1996, 50(2): 222-233. doi: 10.1366/0003702963906519 [20] CASTLE B C, KNIGHT A K, VISSER K, et al. Battery powered laser-induced plasma spectrometer for elemental determinations[J]. Journal of Analytical Atomic Spectrometry, 1998, 13(7): 589-595. doi: 10.1039/a708844b [21] HARMON R S, DE LUCIA F C, MUNSON C A, et al. Laser-induced breakdown spectroscopy (LIBS): an emerging field-portable sensor technology for real-time chemical analysis for military, security and environmental applications[J]. Proceedings of SPIE, 2005, 5(1): 59940K. [22] DELUCIA F C, SAMUELS A C, HARMON R S, et al. Laser-induced breakdown spectroscopy (LIBS): a promising versatile chemical sensor technology for hazardous material detection[J]. IEEE Sensors Journal, 2005, 5(4): 681-689. doi: 10.1109/JSEN.2005.848151 [23] WALTERS R A, ROSE J B, MIZIOLEK A W, et al.. MP-LIBS, a laser induced breakdown spectroscopy tool for homeland security[C]. Laser Applications to Chemical, Security and Environmental Analysis, Optical Society of America, 2006. [24] CUÑAT J, FORTES F J, CABALÍN L M, et al. Man-portable laser-induced breakdown spectroscopy system for in situ characterization of karstic formations[J]. Applied Spectroscopy, 2008, 62(11): 1250-1255. doi: 10.1366/000370208786401662 [25] FORTES F J, CUÑAT J, CABALÍN L M, et al. In situ analytical assessment and chemical imaging of historical buildings using a man-portable laser system[J]. Applied Spectroscopy, 2007, 61(5): 558-564. doi: 10.1366/000370207780807722 [26] CUÑAT J, PALANCO S, CARRASCO F, et al. Portable instrument and analytical method using laser-induced breakdown spectrometry for in situ characterization of speleothems in Karstic caves[J]. Journal of Analytical Atomic Spectrometry, 2005, 20(4): 295-300. doi: 10.1039/B417161F [27] CUÑAT J, FORTES F J, LASERNA J J. Real time and in situ determination of lead in road sediments using a man-portable laser-induced breakdown spectroscopy analyzer[J]. Analytica Chimica Acta, 2009, 633(1): 38-42. doi: 10.1016/j.aca.2008.11.045 [28] GOUJON J, GIAKOUMAKI A, PIÑON V, et al. A compact and portable laser-induced breakdown spectroscopy instrument for single and double pulse applications[J]. Spectrochimica Acta Part B:Atomic Spectroscopy, 2008, 63(10): 1091-1096. doi: 10.1016/j.sab.2008.08.019 [29] BAREFIELD I J E, CLEGG S M, LOPEZ L N, et al.. Application of laser induced breakdown spectroscopy (LIBS) instrumentation for international safeguards[C]. Proceedings of the INMM 51st Annual Meeting, LANL, 2010: 11. [30] RAKOVSKÝ J, MUSSET O, BUONCRISTIANI J F, et al. Testing a portable laser-induced breakdown spectroscopy system on geological samples[J]. Spectrochimica Acta Part B:Atomic Spectroscopy, 2012, 74-75: 57-65. doi: 10.1016/j.sab.2012.07.018 [31] PIERCE W, CHRISTIAN S M, MYERS M J, et al.. Field-testing for environmental pollutants using briefcase sized portable LIBS system[C]. Proceedings of the 3rd International Conference on Laser Induced Plasma Spectroscopy and Applications, 2004. [32] FERREIRA E C, MILORI D M B P, FERREIRA E J, et al. Artificial neural network for Cu quantitative determination in soil using a portable laser induced breakdown spectroscopy system[J]. Spectrochimica Acta Part B:Atomic Spectroscopy, 2008, 63(10): 1216-1220. doi: 10.1016/j.sab.2008.08.016 [33] Applied Photonics, Inc. LIBSCAN 25+[EB/OL]. (2020-08-13) [2020-08-13]. http://www.appliedphotonics.co.uk/. [34] 北京众创辉煌科技有限公司. EasyLIBS-3C便携式激光光谱元素分析仪[EB/OL]. (2019-04-23) [2020-08-13]. http://bjzchh.idc154.bjhyn.cn/cpzx/trlyq/turangyuansufenxiyi/935.html. [35] HARMON R S, DELUCIA JR F C, LAPOINTE A, et al. LIBS for landmine detection and discrimination[J]. Analytical and Bioanalytical Chemistry, 2006, 385(6): 1140-1148. doi: 10.1007/s00216-006-0513-3 [36] 邓奔, 王杰, 姜培培, 等. 高峰值功率微片激光器及其在LIBS中的应用[J]. 中国激光,2014,41(11):36-41. doi: 10.3788/CJL201441.1102005DENG B, WANG J, JIANG P P, et al. High peak power microchip laser and its LIBS application[J]. Chinese Journal of Lasers, 2014, 41(11): 36-41. (in Chinese) doi: 10.3788/CJL201441.1102005 [37] FREEDMAN A, IANNARILLI JR F J, WORMHOUDT J C. Aluminum alloy analysis using microchip-laser induced breakdown spectroscopy[J]. Spectrochimica Acta Part B:Atomic Spectroscopy, 2005, 60(7-8): 1076-1082. doi: 10.1016/j.sab.2005.03.020 [38] LOPEZ-MORENO C, SMITH B W, GORNUSHKIN I B, et al. Quantitative analysis of low-alloy steel by microchip laser induced breakdown spectroscopy[J]. Journal of Analytical Atomic Spectrometry, 2005, 20(6): 552-556. doi: 10.1039/b419173k [39] AMPONSAH-MANAGER K, OMENETTO N, SMITH B W, et al. Microchip laser ablation of metals: investigation of the ablation process in view of its application to laser-induced breakdown spectroscopy[J]. Journal of Analytical Atomic Spectrometry, 2005, 20(6): 544-551. doi: 10.1039/b419109a [40] HWANG G M H. Feasibility study of micro-laser induced breakdown spectroscopy applied to lead identification in metal alloys and environmental matrices[D]. Cambridge: Massachusetts Institute of Technology, 1998: 1-7. [41] WORMHOUDT J, IANNARILLI JR F J, JONES S, et al. Determination of carbon in steel by laser-induced breakdown spectroscopy using a microchip laser and miniature spectrometer[J]. Applied Spectroscopy, 2005, 59(9): 1098-1102. doi: 10.1366/0003702055012528 [42] SECOPTA, Inc. FiberLIBS inline[EB/OL]. [2020-08-13] https://www.secopta.com/products/fiberlibs-inline-metal-applications. [43] MAREK H, IGOR G, SVEN M, et al. Assessment of suitability of diode pumped solid state lasers for laser induced breakdown and Raman spectroscopy[J]. Journal of Analytical Atomic Spectrometry, 2011(26): 414-424. [44] NOHARET B, STERNER C, IREBO T, et al. A compact LIBS system for industrial applications[J]. Proceedings of SPIE, 2015, 9369: 936904. [45] MYERS M J, MYERS J D, SARRACINO J T, et al. LIBS system with compact fiber spectrometer, head mounted spectra display and hand held eye-safe erbium glass laser gun[J]. Proceedings of SPIE, 2010, 7578: 75782G. doi: 10.1117/12.841901 [46] CREMERS D A, BEDDINGFIELD A, SMITHWICK R, et al. Monitoring uranium, hydrogen, and lithium and their isotopes using a compact laser-induced breakdown spectroscopy (LIBS) probe and high-resolution spectrometer[J]. Applied Spectroscopy, 2012, 66(3): 250-261. doi: 10.1366/11-06314 [47] TORTSCHANOFF A, BAUMGART M, KROUPA G. Application of a compact diode pumped solid-state laser source for quantitative laser-induced breakdown spectroscopy analysis of steel[J]. Optical Engineering, 2017, 56(12): 124104. [48] 闫久江, 李祥友. 新型便携式激光诱导击穿光谱仪器及其应用研究[J]. 冶金分析,2020,40(12):66-71. doi: 10.13228/j.boyuan.issn1000-7571.011200YAN J J, LI X Y. Research on a new portable laser-induced breakdown spectroscopy system and its application[J]. Metallurgical Analysis, 2020, 40(12): 66-71. (in Chinese) doi: 10.13228/j.boyuan.issn1000-7571.011200 [49] BOHLING C, HOHMANN K, SCHEEL D, et al. All-fiber-coupled laser-induced breakdown spectroscopy sensor for hazardous materials analysis[J]. Spectrochimica Acta Part B:Atomic Spectroscopy, 2007, 62(12): 1519-1527. doi: 10.1016/j.sab.2007.10.038 [50] DE LUCIA F C, GOTTFRIED J L, MIZIOLEK A W. Evaluation of femtosecond laser-induced breakdown spectroscopy for explosive residue detection[J]. Optics Express, 2009, 17(2): 419-425. doi: 10.1364/OE.17.000419 [51] BAUDELET M, WILLIS C C C, SHAH L, et al. Laser-induced breakdown spectroscopy of copper with a 2 μm thulium fiber laser[J]. Optics Express, 2010, 18(8): 7905-7910. doi: 10.1364/OE.18.007905 [52] GRAVEL J F Y, DOUCET F R, BOUCHARD P, et al. Evaluation of a compact high power pulsed fiber laser source for laser-induced breakdown spectroscopy[J]. Journal of Analytical Atomic Spectrometry, 2011, 26(7): 1354-1361. doi: 10.1039/c0ja00228c [53] SCHARUN M, FRICKE-BEGEMANN C, NOLL R. Laser-induced breakdown spectroscopy with multi-kHz fibre laser for mobile metal analysis tasks — A comparison of different analysis methods and with a mobile spark-discharge optical emission spectroscopy apparatus[J]. Spectrochimica Acta Part B:Atomic Spectroscopy, 2013, 87: 198-207. doi: 10.1016/j.sab.2013.05.007 [54] 曾庆栋, 朱志恒, 邓凡, 等. 便携式激光诱导击穿光谱结合小波变换去背景算法定量分析钢铁中Mn元素[J]. 光子学报,2018,47(8):102-111. doi: 10.3788/gzxb20184708.0847014ZENG Q D, ZHU ZH H, DENG F, et al. Quantitative analyses of element Mn in iron using portable laser-induced breakdown spectroscopy with algorithm of background removal based on wavelet transform[J]. Acta Photonica Sinica, 2018, 47(8): 102-111. (in Chinese) doi: 10.3788/gzxb20184708.0847014 [55] ZENG Q D, GUO L B, LI X Y, et al. Quantitative analyses of Mn, V, and Si elements in steels using a portable laser-induced breakdown spectroscopy system based on a fiber laser[J]. Journal of Analytical Atomic Spectrometry, 2016, 31(3): 767-772. doi: 10.1039/C5JA00453E [56] DAVIES C M, TELLE H H, MONTGOMERY D J, et al. Quantitative analysis using remote laser-induced breakdown spectroscopy (LIBS)[J]. Spectrochimica Acta Part B:Atomic Spectroscopy, 1995, 50(9): 1059-1075. doi: 10.1016/0584-8547(95)01314-5 [57] GRUBER J, HEITZ J, STRASSER H, et al. Rapid in-situ analysis of liquid steel by laser-induced breakdown spectroscopy[J]. Spectrochimica Acta Part B:Atomic Spectroscopy, 2001, 56(6): 685-693. doi: 10.1016/S0584-8547(01)00182-3 [58] WHITEHOUSE A I, YOUNG J, BOTHEROYD I M, et al. Remote material analysis of nuclear power station steam generator tubes by laser-induced breakdown spectroscopy[J]. Spectrochimica Acta Part B:Atomic Spectroscopy, 2001, 56(6): 821-830. doi: 10.1016/S0584-8547(01)00232-4 [59] PASQUINI C, CORTEZ J, SILVA L M C, et al. Laser induced breakdown spectroscopy[J]. Journal of the Brazilian Chemical Society, 2007, 18(3): 463-512. doi: 10.1590/S0103-50532007000300002 [60] RAI A K, ZHANG H SH, YUEH F Y, et al. Parametric study of a fiber-optic laser-induced breakdown spectroscopy probe for analysis of aluminum alloys[J]. Spectrochimica Acta Part B:Atomic Spectroscopy, 2001, 56(12): 2371-2383. doi: 10.1016/S0584-8547(01)00299-3 [61] ZENG Q D, GUO L B, LI X Y, et al. Laser-induced breakdown spectroscopy using laser pulses delivered by optical fibers for analyzing Mn and Ti elements in pig iron[J]. Journal of Analytical Atomic Spectrometry, 2015, 30(2): 403-409. doi: 10.1039/C4JA00462K [62] LASERSEC SYSTEMS CORPORATION. LEA Handheld LIBS[EB/OL]. (2020-08-13) [2020-08-13]. http://www.lasersec-systems.com. [63] BERG ENGINEERING AND SALES COMPANY, INC. Oxford mPulse Handheld LIBS Analyzer (MPULSE) [EB/OL]. (2020-08-13) [2020-08-13]. https://www.bergeng.com/product/MPULSE.html. [64] Rigaku, Inc. KT-100S – LIBS Analyzer[EB/OL]. (2019) [2020-08-13]. https://www.rigaku.com/en/products/libs/kt100s. [65] 林庆宇, 查方发, 王杰, 等. 高能手持式激光诱导击穿光谱分析仪器的研制及相关应用[J]. 现代科学仪器,2015(6):50-54.LIN Q Y, ZHA F F, WANG J. et al. Development and application of handheld instrument based on laser induced breakdown spectroscopy[J]. Modern Scientific Instruments, 2015(6): 50-54. (in Chinese) [66] TSI, INC. CHEMLITE PLUS METAL ANALYZER 4240 [EB/OL]. (2018) [2020-08-13]. https://tsi.com/products/metal-analyzers/chemlite-plus-laser-metals-analyzer-4240/. [67] AFGAN M S, HOU Z Y, WANG ZH. Quantitative analysis of common elements in steel using a handheld μ-LIBS instrument[J]. Journal of Analytical Atomic Spectrometry, 2017, 32(10): 1905-1915. doi: 10.1039/C7JA00219J [68] POCHON A, DESAULTY A M, BAILLY L. Handheld Laser-Induced Breakdown Spectroscopy (LIBS) as a fast and easy method to trace gold[J]. Journal of Analytical Atomic Spectrometry, 2020, 35(2): 254-264. doi: 10.1039/C9JA00437H -

 下载:
下载:

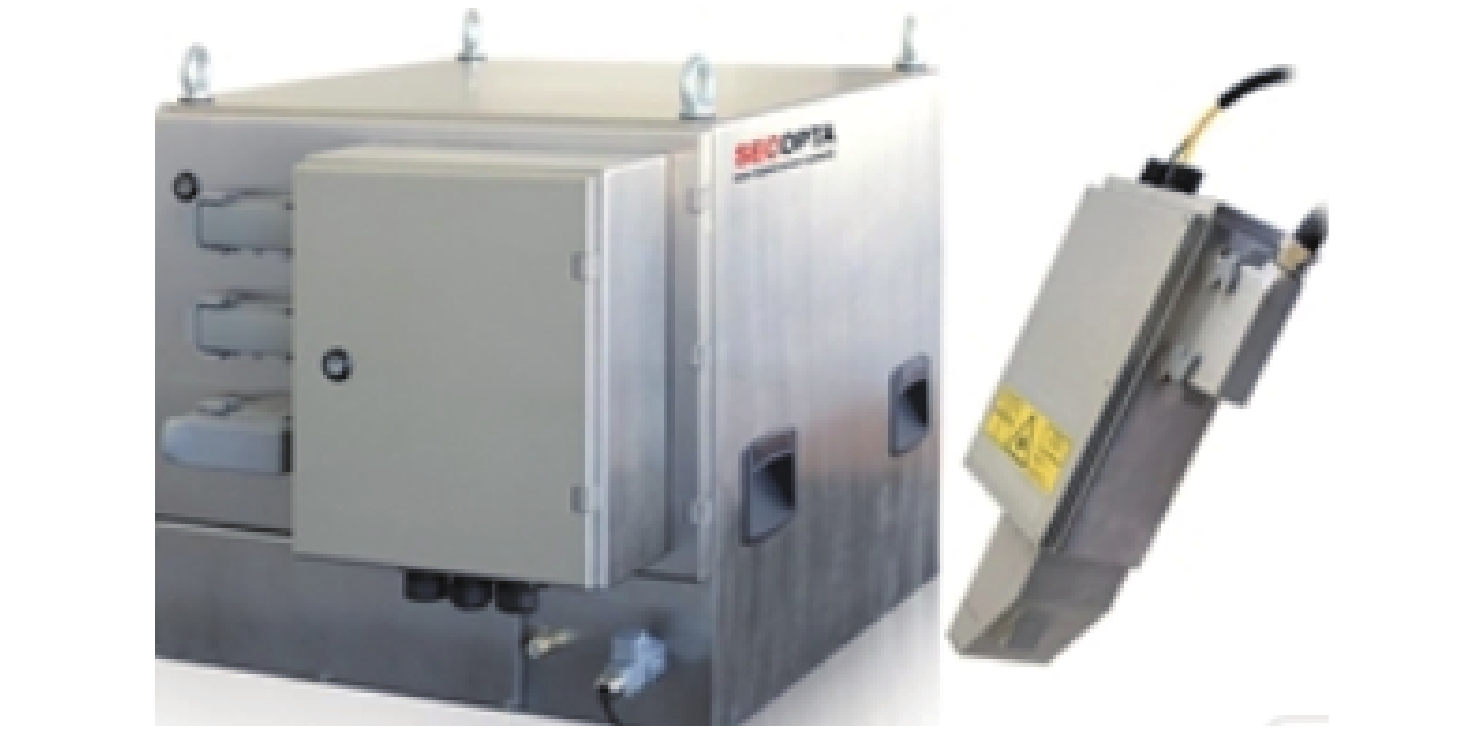


计量
- 文章访问数: 4943
- HTML全文浏览量: 1999
- PDF下载量: 454
- 被引次数: 0
