


Quantitative analysis of thorium in graphite using femtosecond laser-induced breakdown spectroscopy
-
摘要:
为了促进激光诱导击穿光谱技术在核工业领域中的应用与发展,利用飞秒激光对高纯石墨中的钍(Th)元素开展了定量分析研究。采用标准加样法制备了钍含量在0.35%~35.15%范围内的9个分析样品,以类比钍基核燃料中的钍含量。通过改变光谱采集方式、延时条件及调节飞秒激光脉冲能量对实验条件进行优化。在优化的实验条件下,对所有样品进行激发以采集等离子体光谱信息用于定量分析研究。得出以下结果:对比定点激发采集光谱结果,采用靶面连续移动式的光谱重复性好,钍原子(Th I 396.21 nm)谱线强度获得大约2倍的增强,重复测量的相对标准偏差由20.4%降至5.7%;高含量区间内钍元素谱线存在明显的自吸收效应,采用指数函数对整个含量区间与分析线(Th I 394.42 nm、396.21 nm和766.53 nm)强度进行非线性拟合,可以有效获取分析线的饱和阈值;基本定标法适用于饱和阈值以下的含量区间,分析线对较低含量的未知样品的预测分析具有较高的精确度;采用内标法(以C I 247.85 nm线为内标线),可以实现积分强度和峰值强度与整个区间含量的线性拟合,其中,基于高饱和阈值分析线(766.53 nm)的积分强度能够较好地实现高含量未知样品的含量预测。实验结果说明:飞秒激光诱导击穿光谱技术具有钍基核燃料循环过程中钍含量监测分析的潜力。
-
关键词:
- 飞秒激光诱导击穿光谱 /
- 钍 /
- 核燃料 /
- 定量分析
Abstract:In order to promote the application of Laser-Induced Breakdown Spectroscopy (LIBS) in the nuclear industry, in this paper, a femtosecond LIBS(fs-LIBS) system was used to quantitatively analyze Thorium (Th) in a highly pure graphite matrix. According to the Th concentrations in the Thorium-based fuel, a total of 9 homemade Th2O3-graphite mixture samples with Th concentrations that varied from 0.35% to 35.15% were prepared by the standard addition method. The favorable experimental parameters such as the treatment methods for LIBS detection, laser pulse energy and delay times were studied before the quantitative analysis. The results show that the signal intensity of the fs-LIBS spectrum acquired by the scanning with moving method is significantly higher than that without the moving method. For the Th I 396.21 nm line, the Relative Standard Deviation (RSD) value of multiple measurements for the scanning method was just 5.7%, which was much lower than that of without the moving method (20.4%). The Th spectral lines show obvious saturation due to the self-absorption effect in the higher concentration region, and thus the basic calibration method was no longer applicable. Therefore, an exponential function was used to fit the spectral line intensity and concentration in the whole concentration region, and the concentration saturation threshold values corresponding to the analytical lines Th I 394.42, 396.21, and 766.53 nm were obtained. The basic calibration method has good detection performance when the calibration curves were constructed by using a lower concentration below the saturation threshold. For the peak area and peak intensity of each analytical line, using the internal standard method with the internal standard line (C I 247.85 nm), a good linear relationship can be found between them and the Th concentrations in the whole concentration region, especially for analytical line Th I 766.53 nm with a higher saturation threshold. The internal standard method had good prediction performance for unknown samples with higher concentrations. The above results show that fs-LIBS has the potential to monitor and analyze the thorium concentration in the thorium-based fuel cycle.
-

图 1 本文飞秒LIBS实验装置示意图
Figure 1. Schematic diagram of the experimental setup for proposed femtosecond LIBS
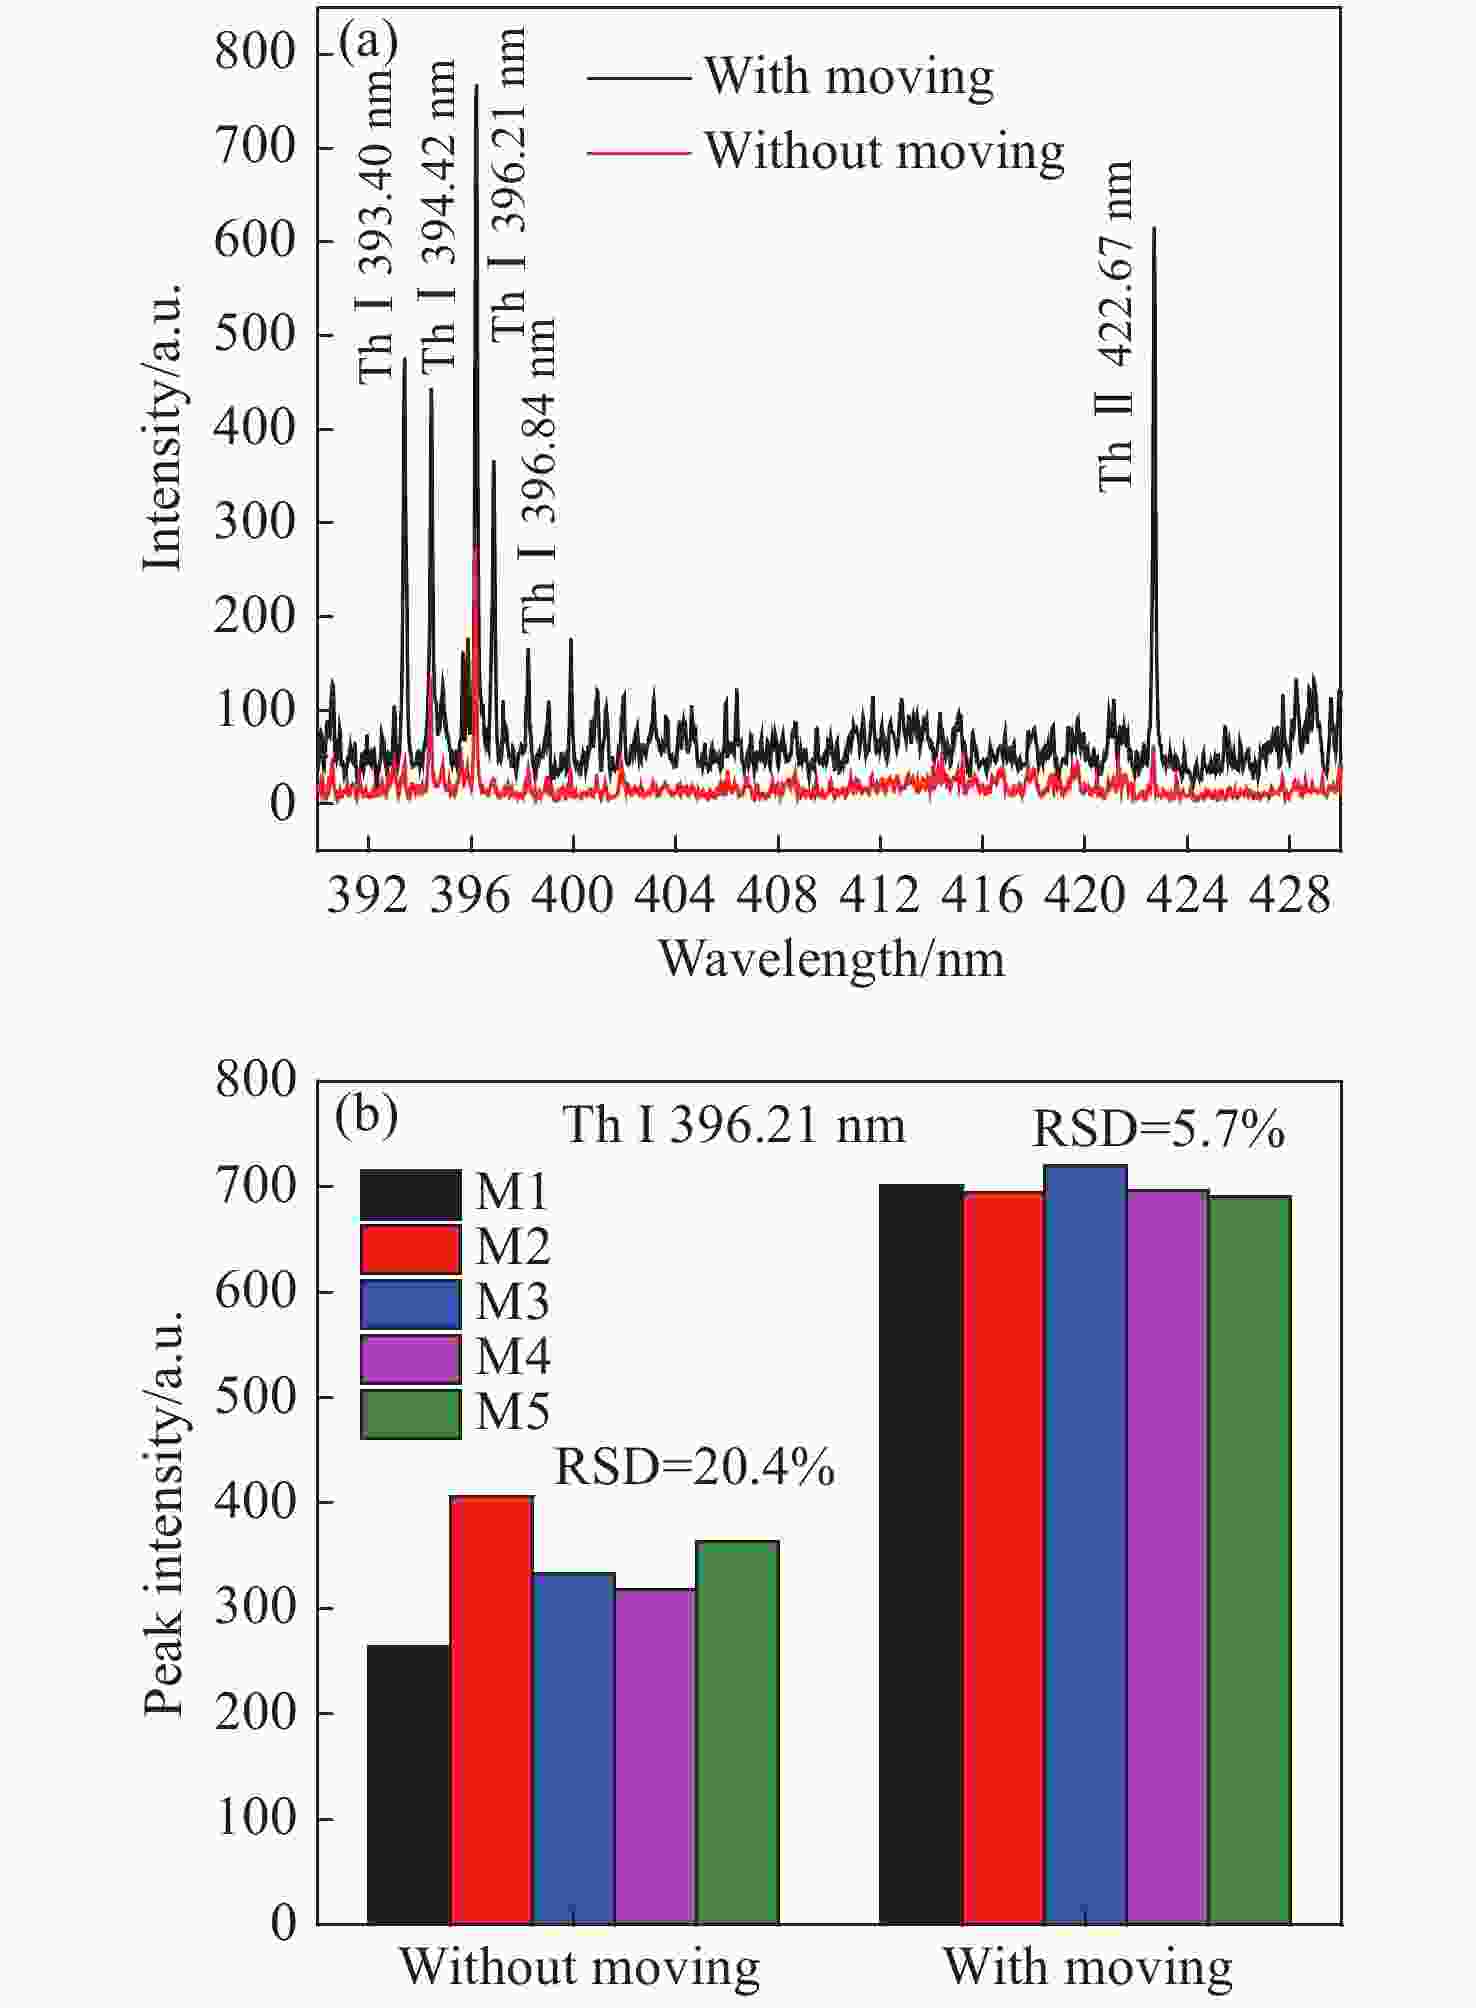
图 2 (a)扫描式和定点式采集的光谱图; (b) Th I 396.21 nm线重复性测量结果图
Figure 2. (a) LIBS spectra obtained by the with moving method and without moving method; (b) reproducibility of the Th I 396.21 nm line from five measurements
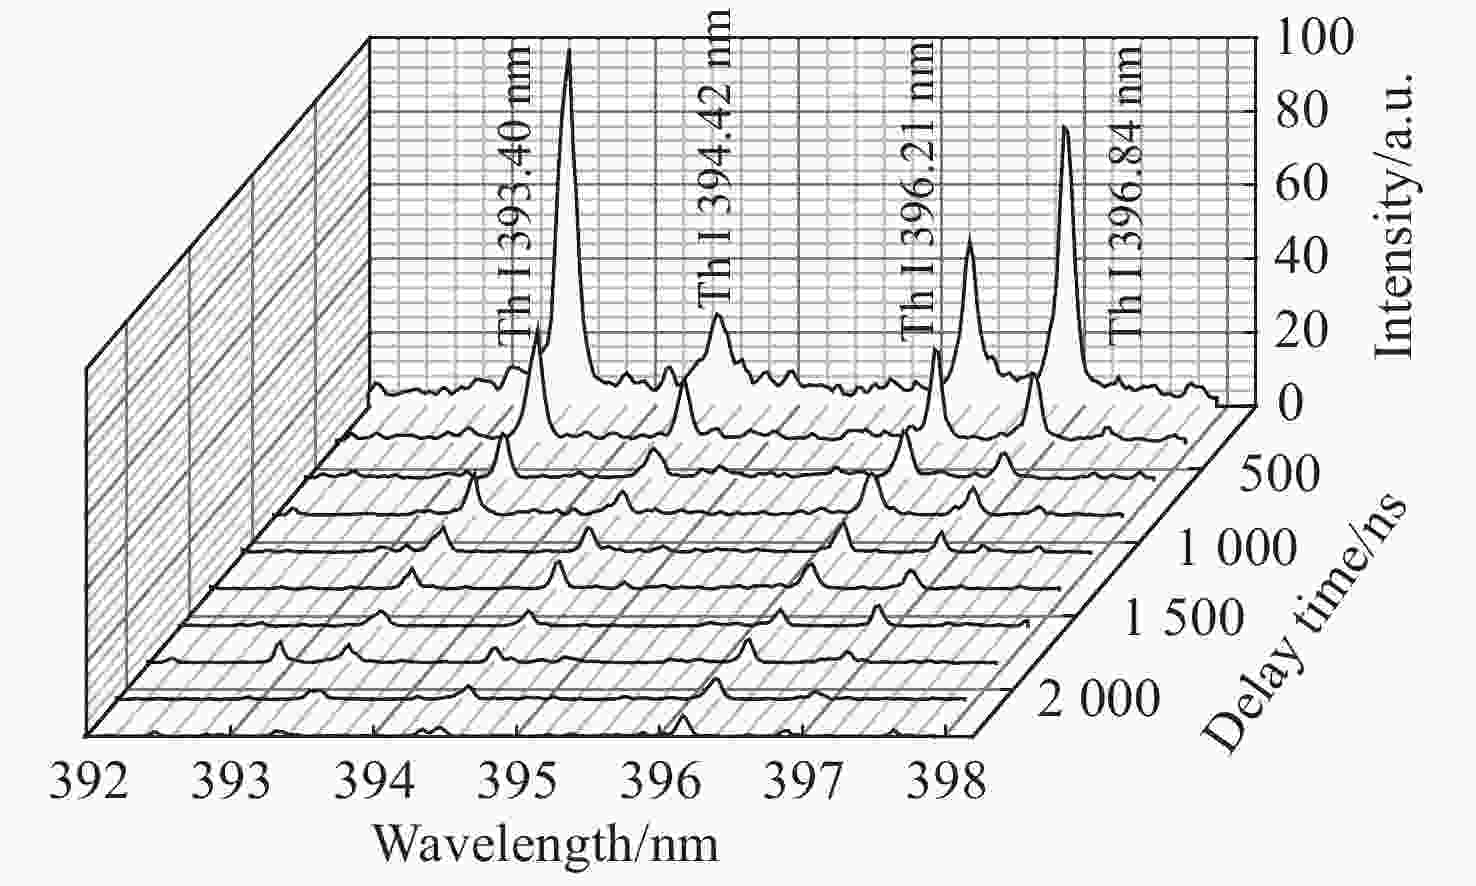
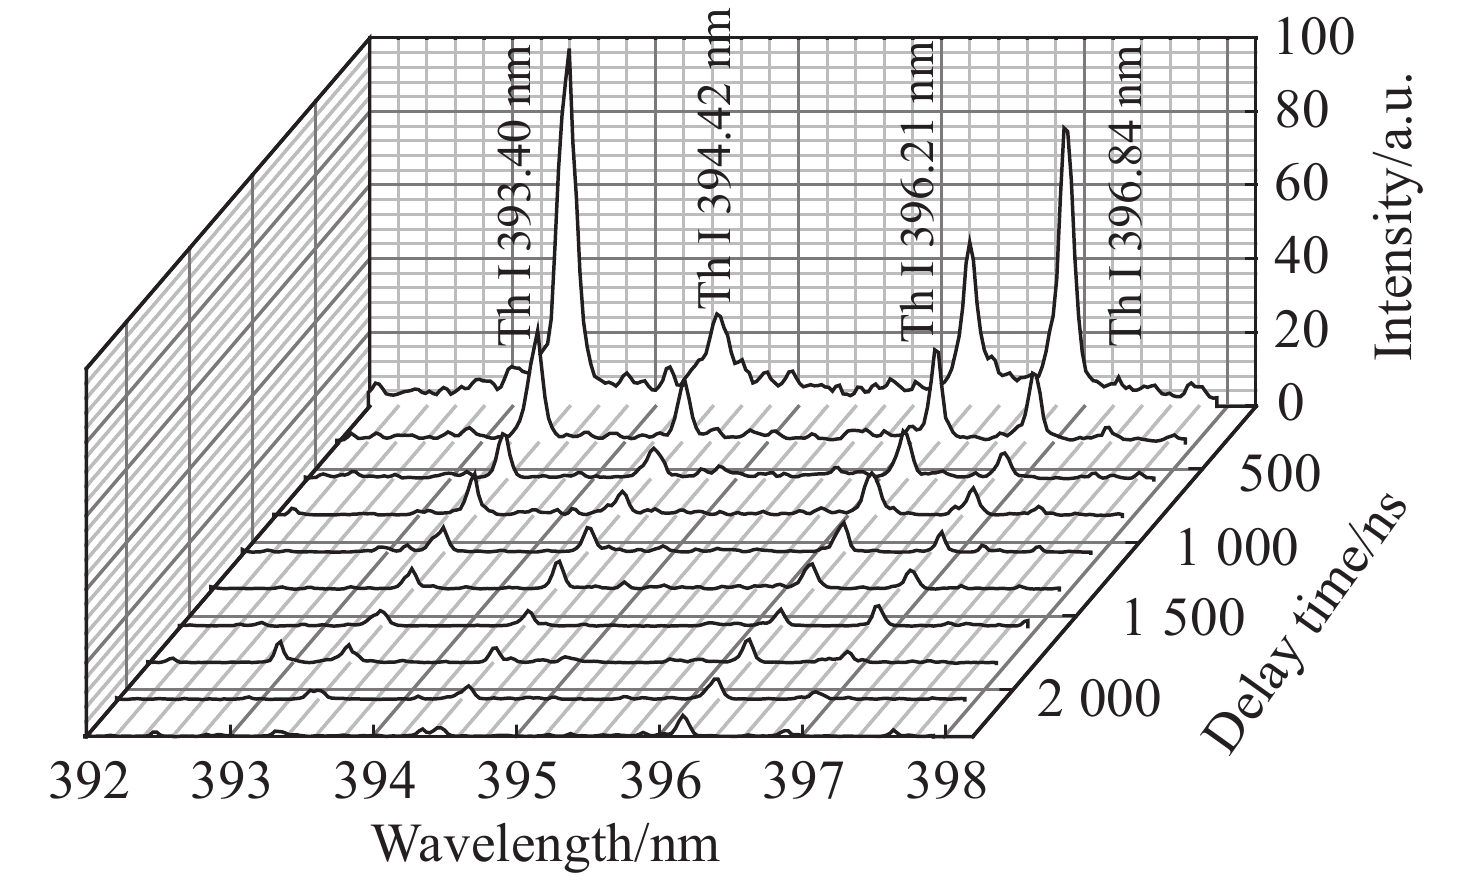
图 3 5#样品在0.5 mJ激光脉冲能量下的时间分辨光谱图
Figure 3. The time-resolved spectra for the sample 5# at laser energy of 0.5 mJ
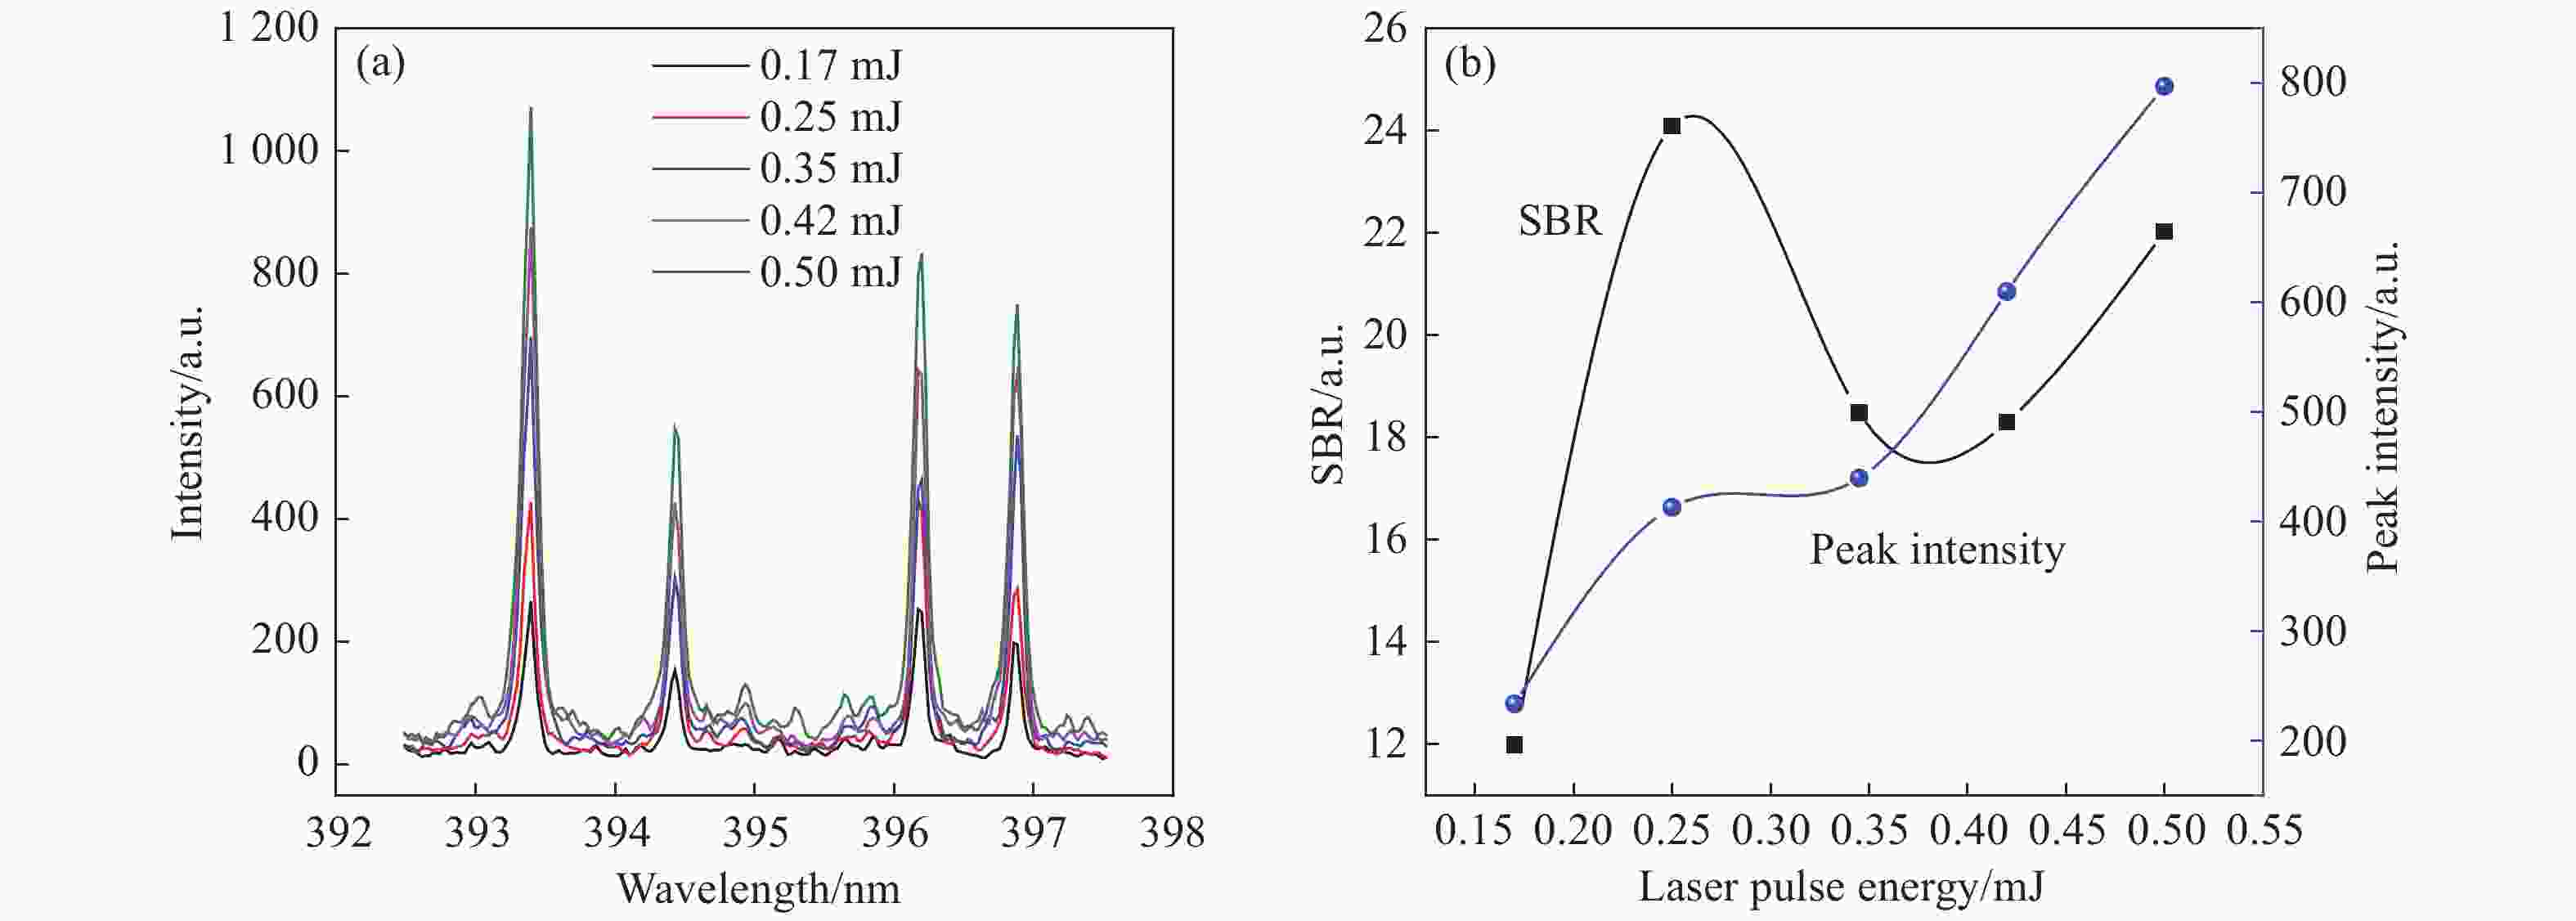
图 4 (a)不同激光脉冲能量下光谱图; (b)Th I 396.21 nm线的SBR和峰值强度随能量的演化
Figure 4. (a)Effect of laser pulse energy on the LIBS spectra; (b) SBR and Peak intensity of the Th I 396.21 nm line as a function of laser pulse energy

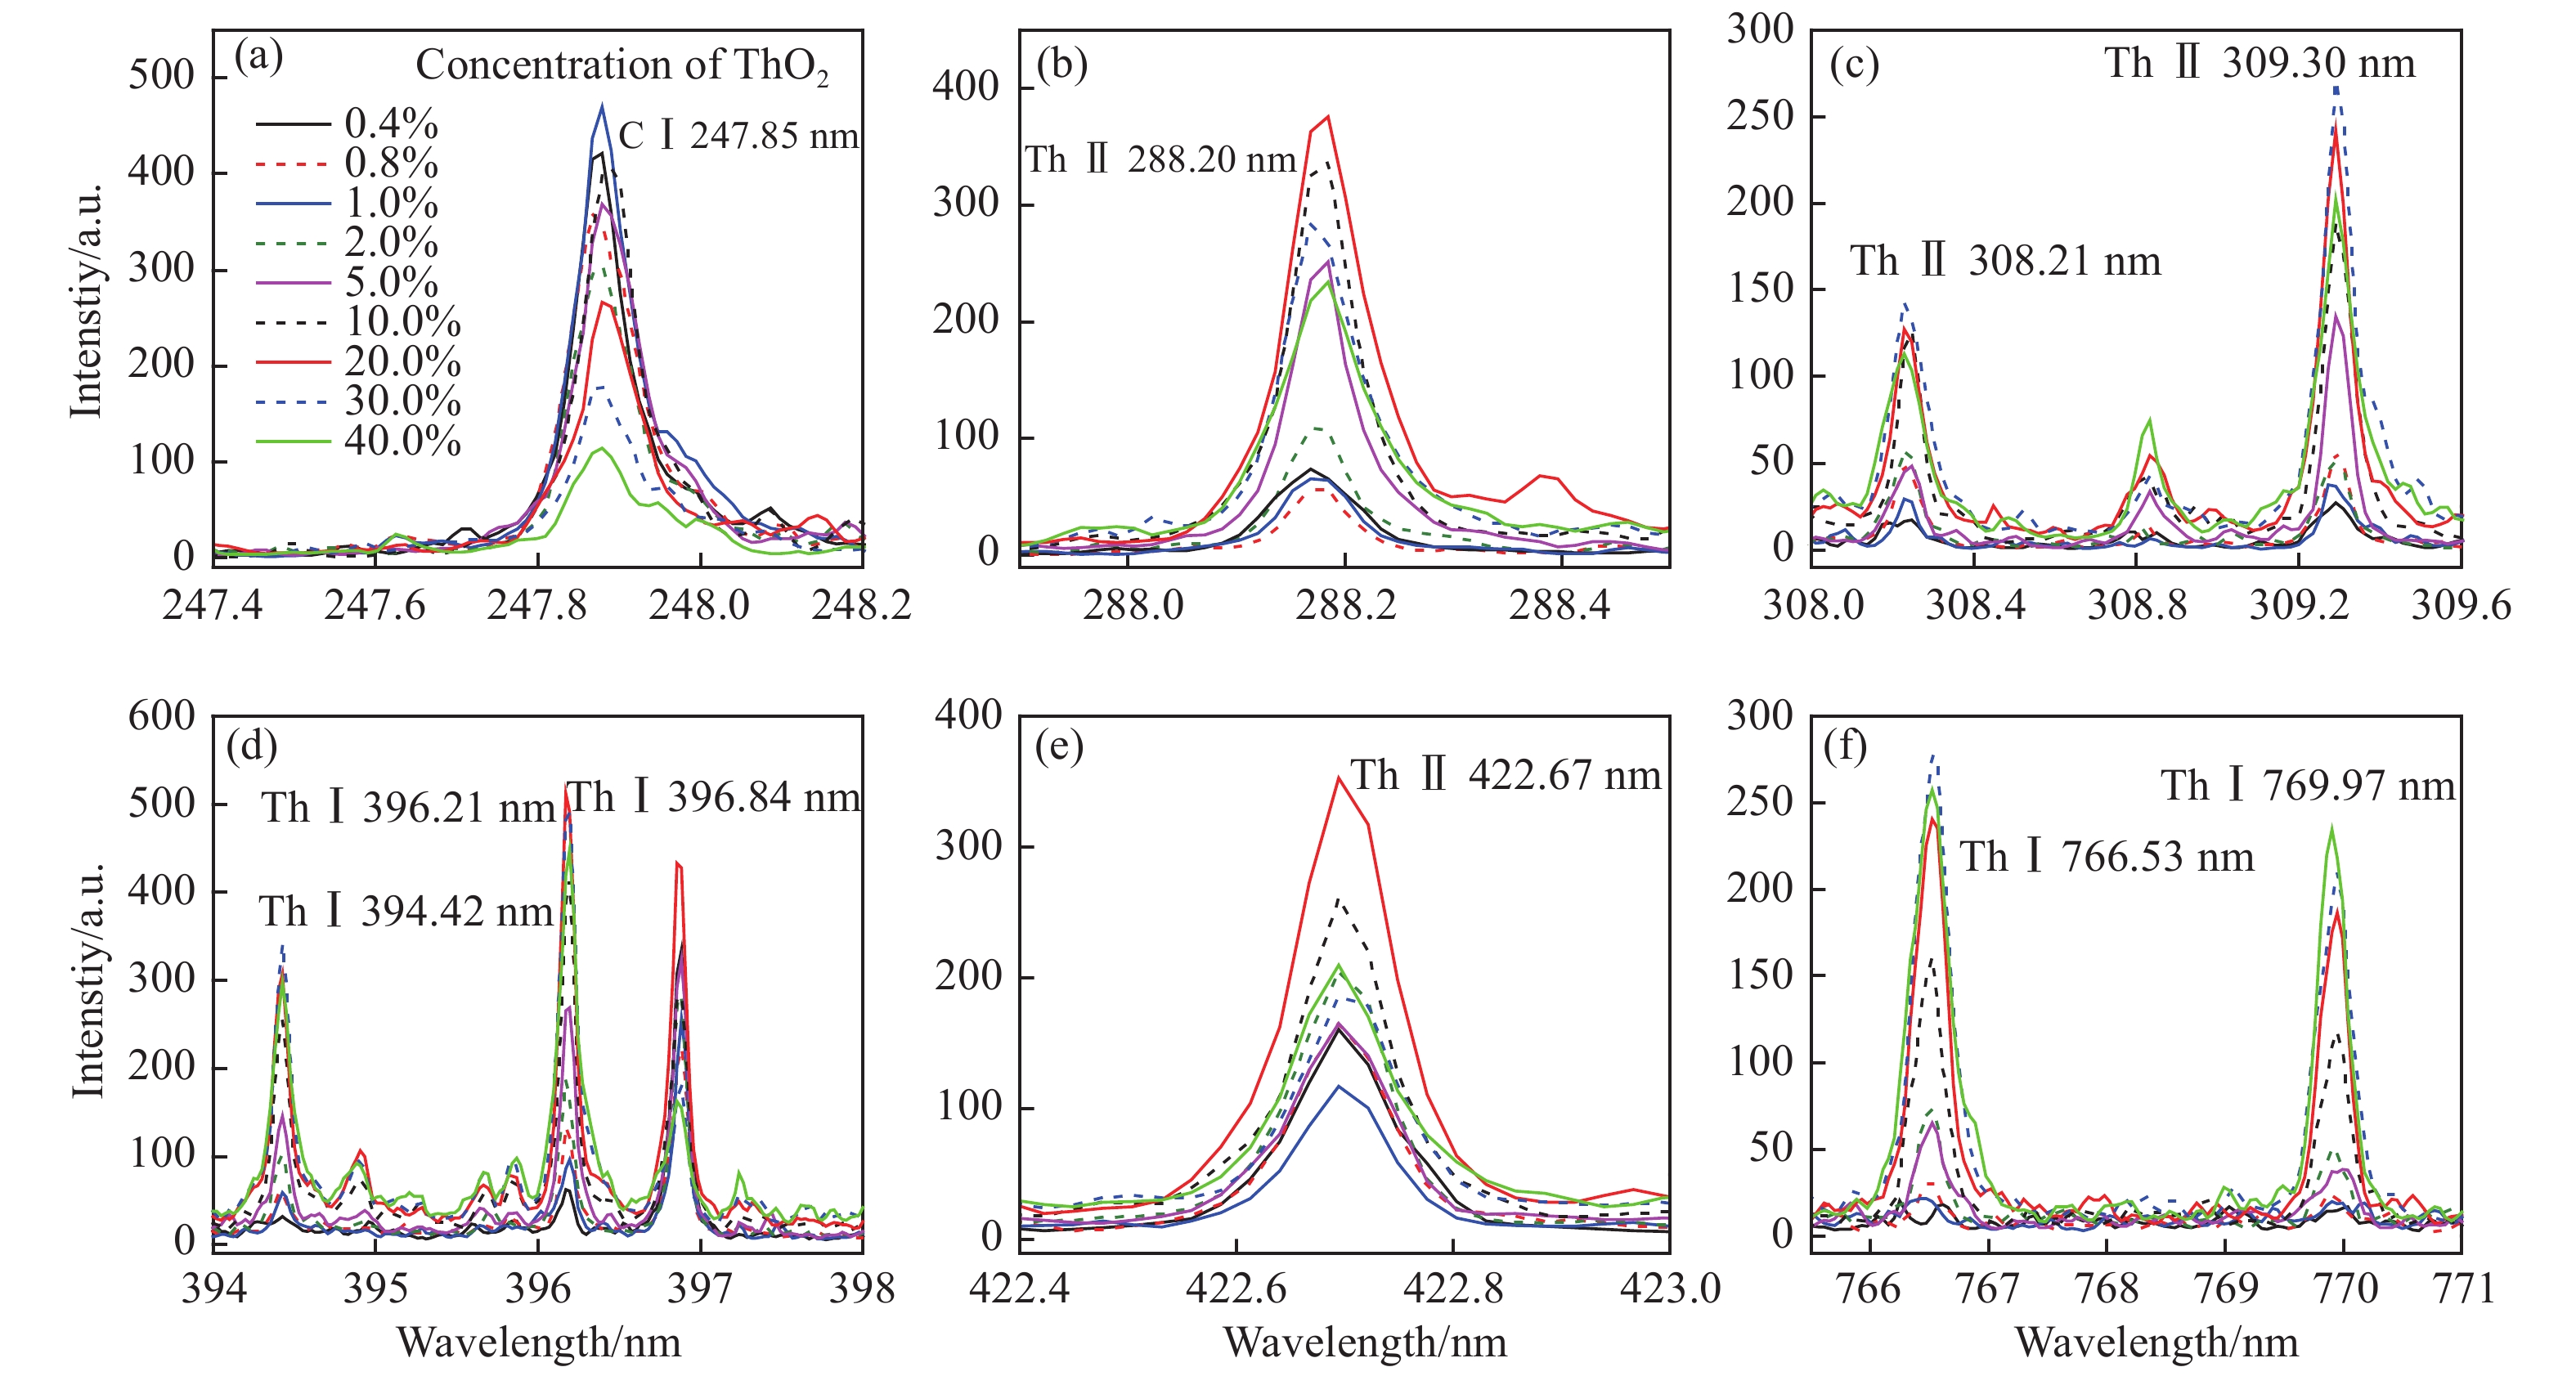
图 5 不同Th含量梯度下光谱图。(a)为C I 247.85 nm, (b)~(f)为Th元素的谱线
Figure 5. LIBS spectra as a function of Th concentration: (a) C I 247.85 nm; (b)~(f) emission lines of Th
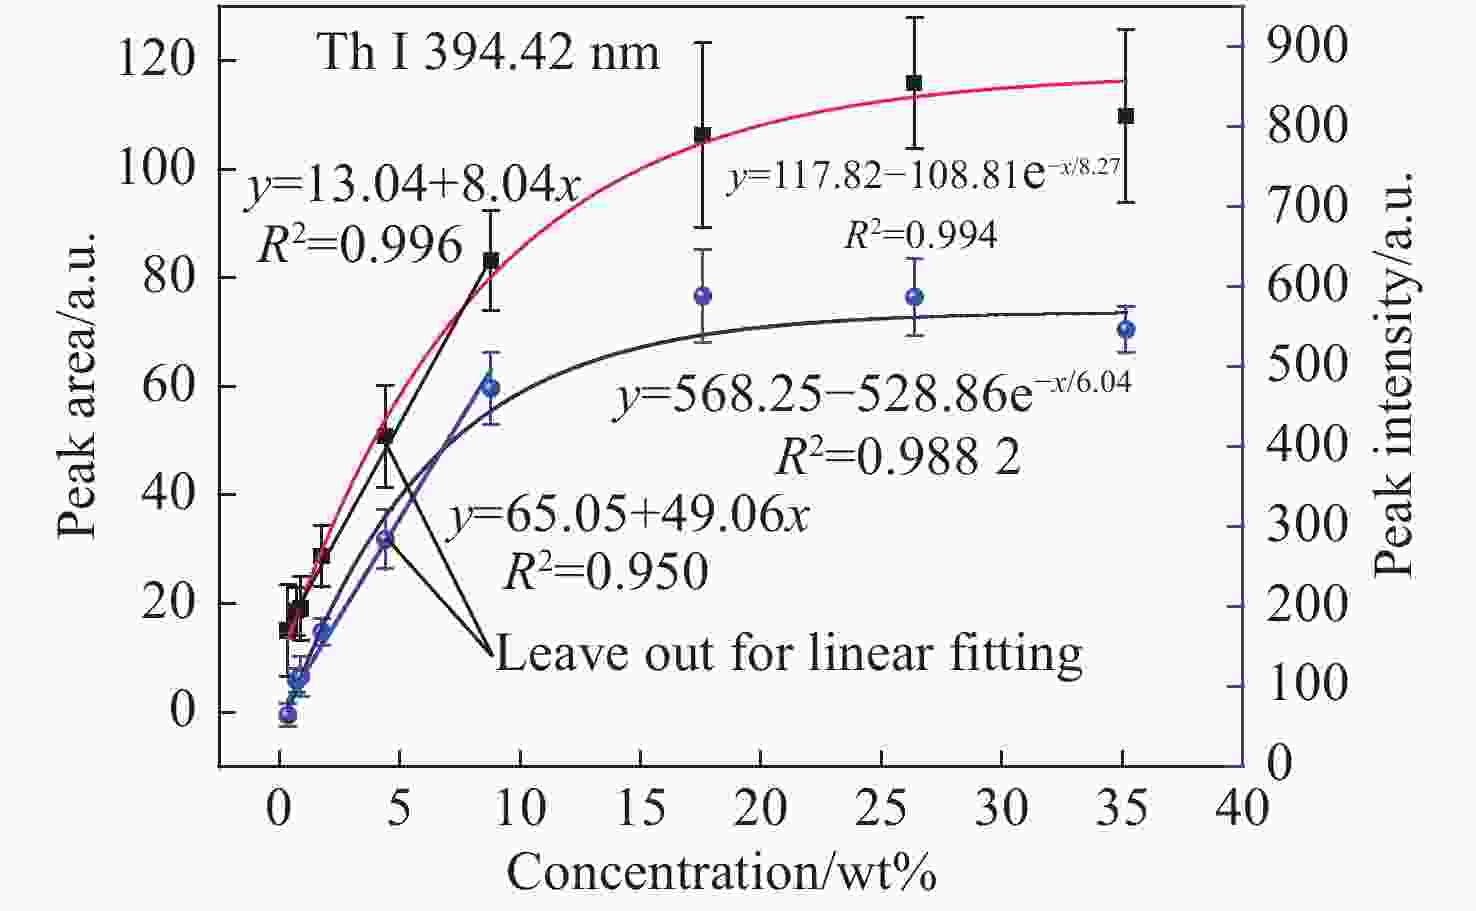
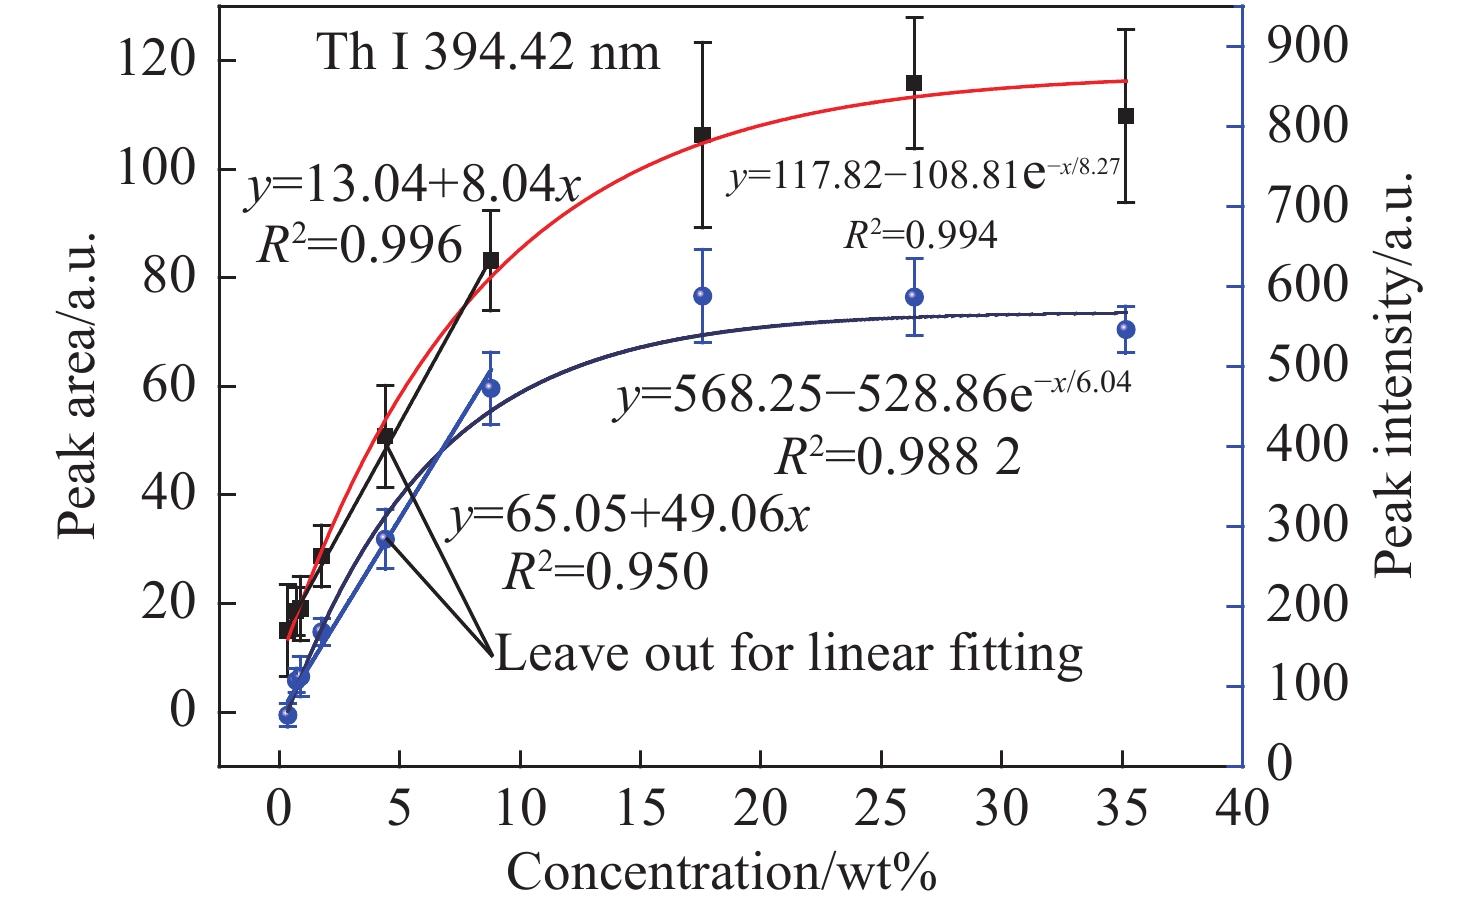
图 6 Th I 394.42 nm线积分强度和峰值强度随Th含量的变化
Figure 6. The peak area and peak intensity for Th I 394.42 nm line as a function of pulse energy
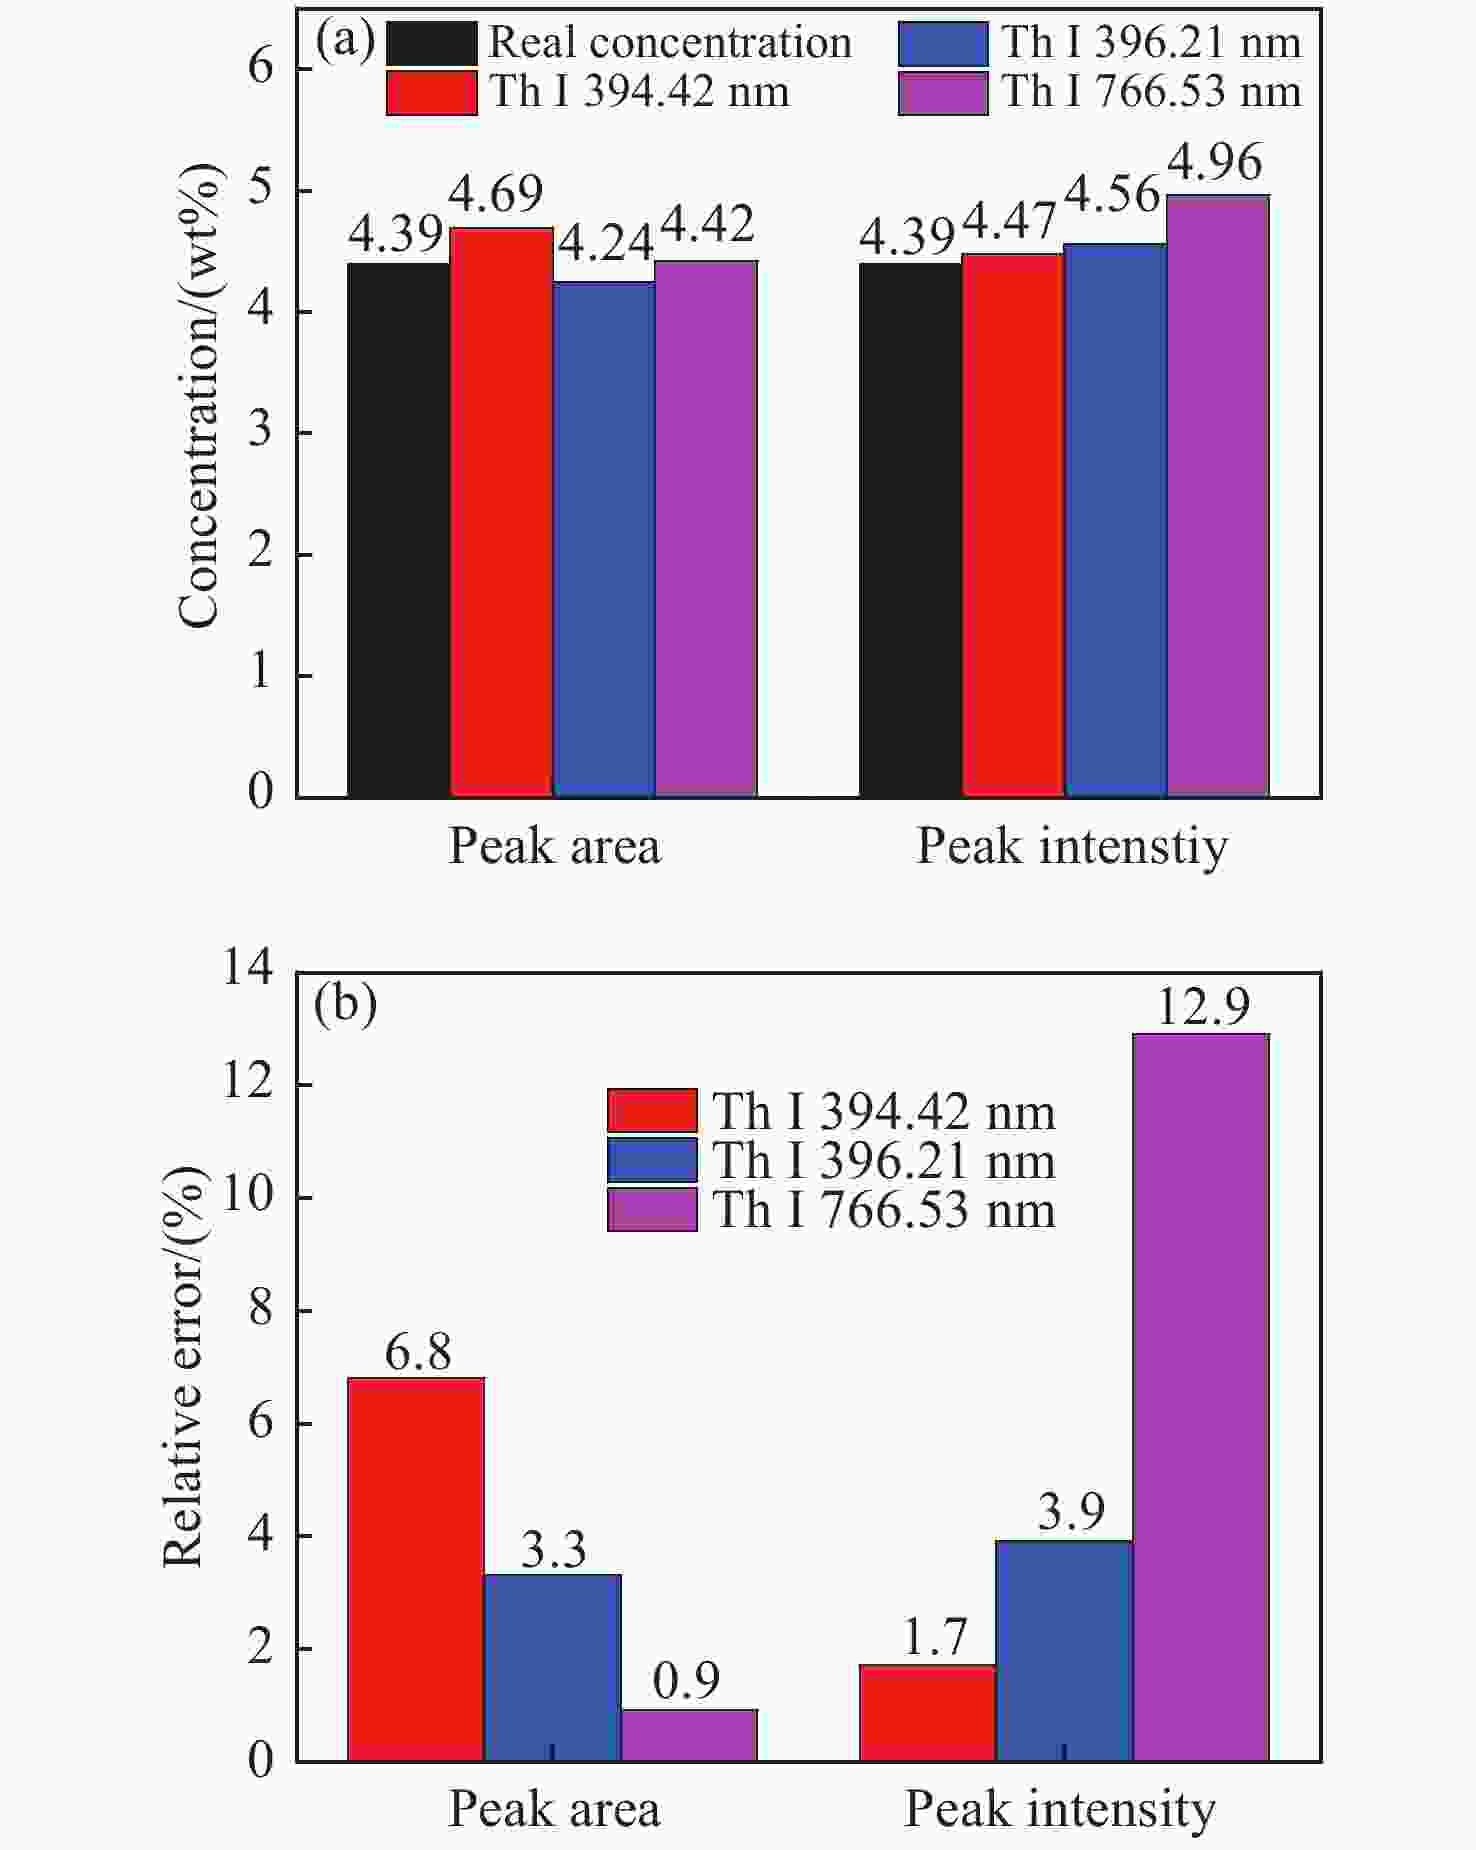
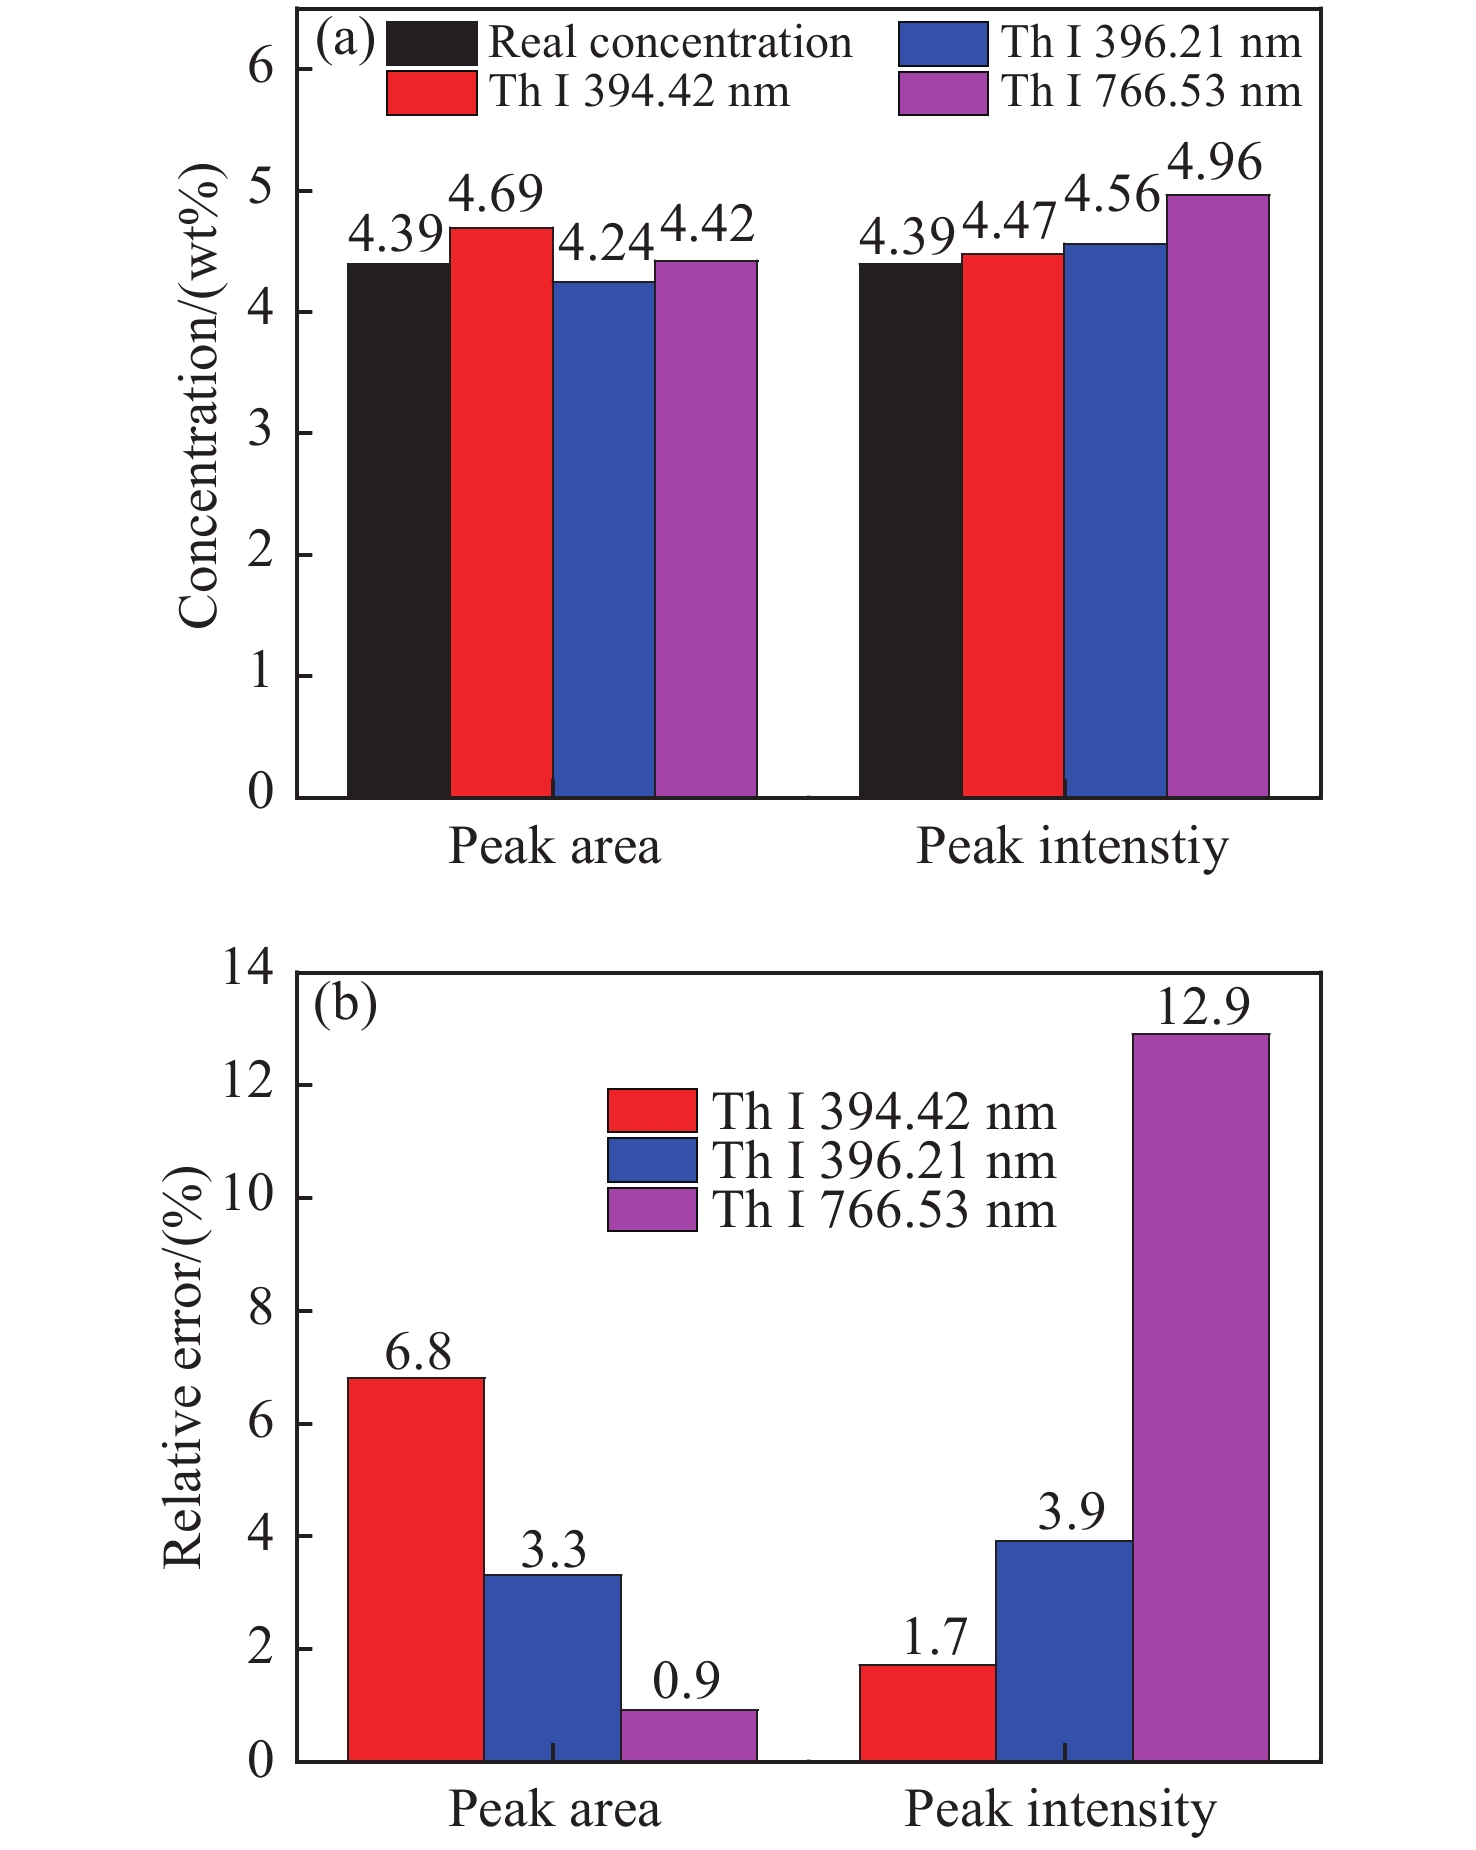
图 7 基本定标法对5#样品的预测性能:(a)预测含量值;(b)其相对误差
Figure 7. The performance of basic calibration method for sample 5#: (a)prediction concentrations; (b)relative errors
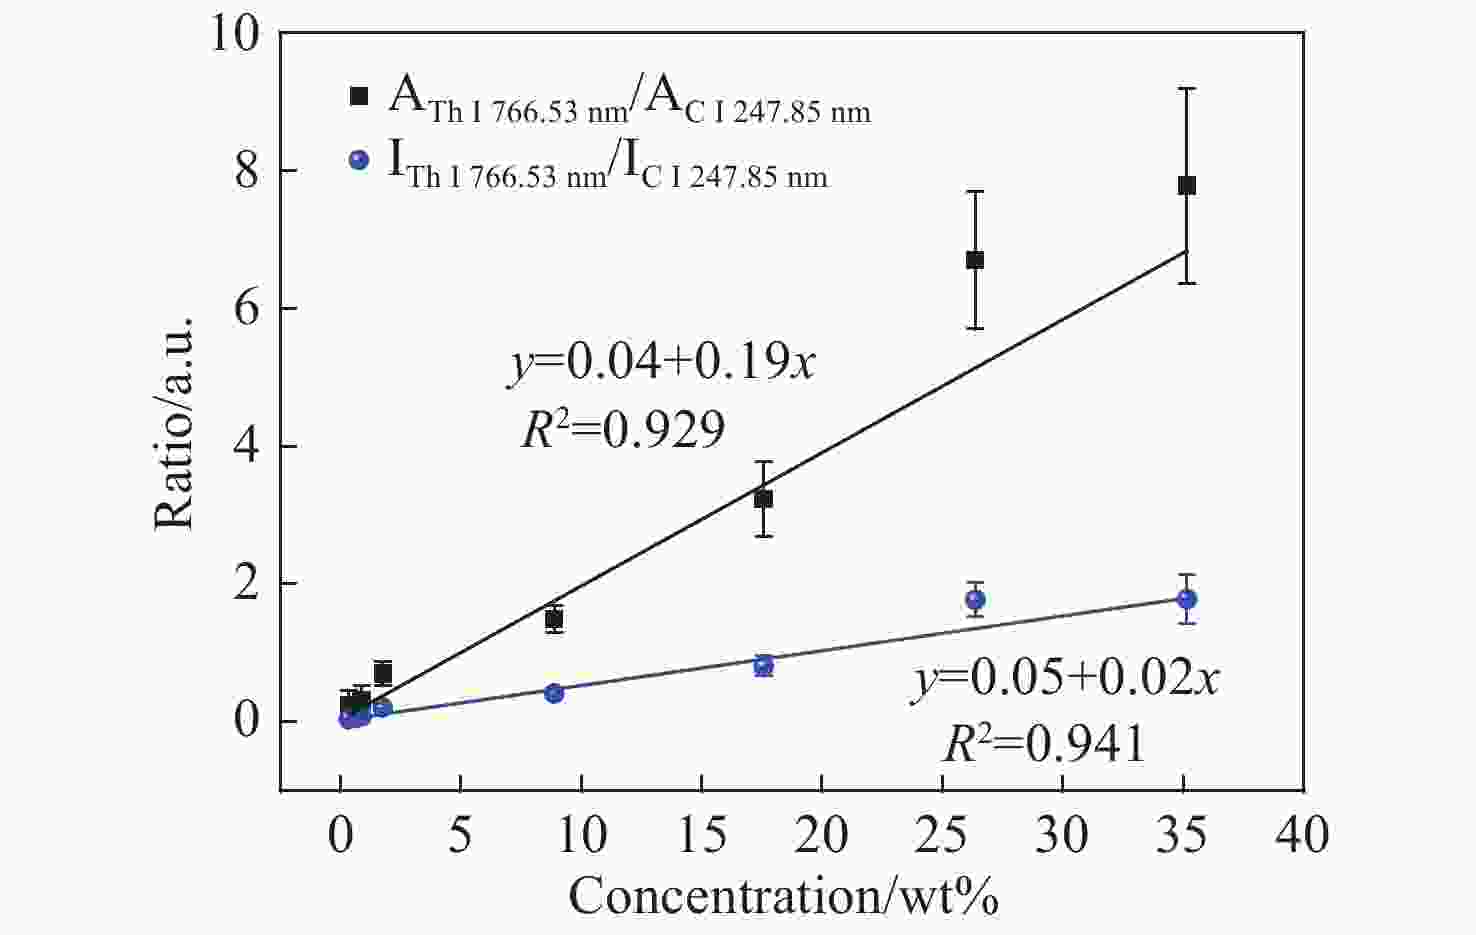
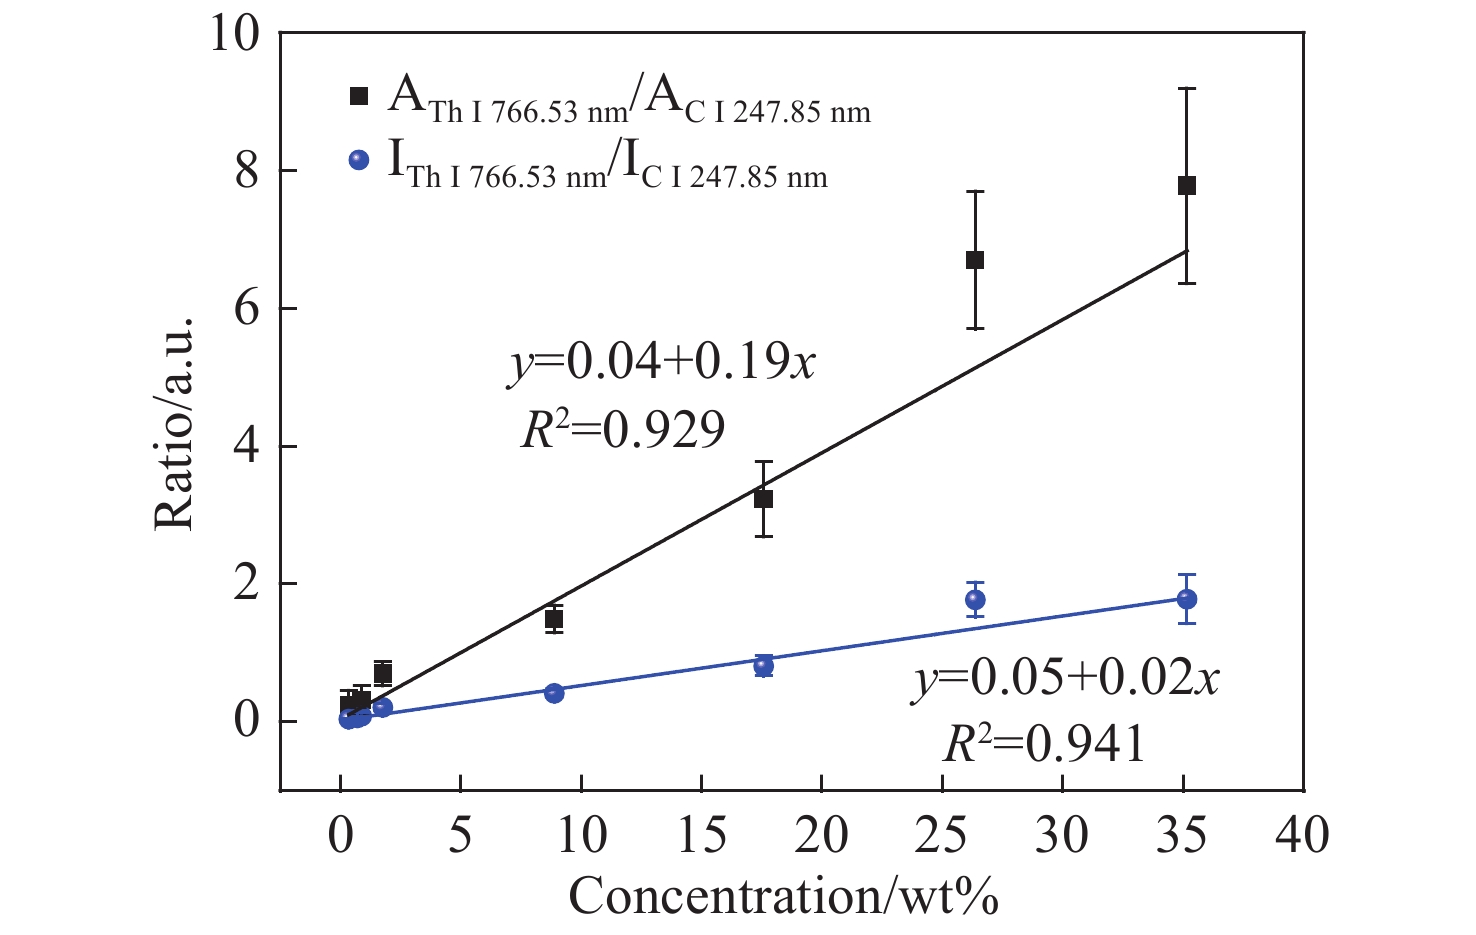
图 8 以C I 247.85 nm线为内标的定标曲线
Figure 8. Calibration curves with C I 247.85 nm line as the internal standard line
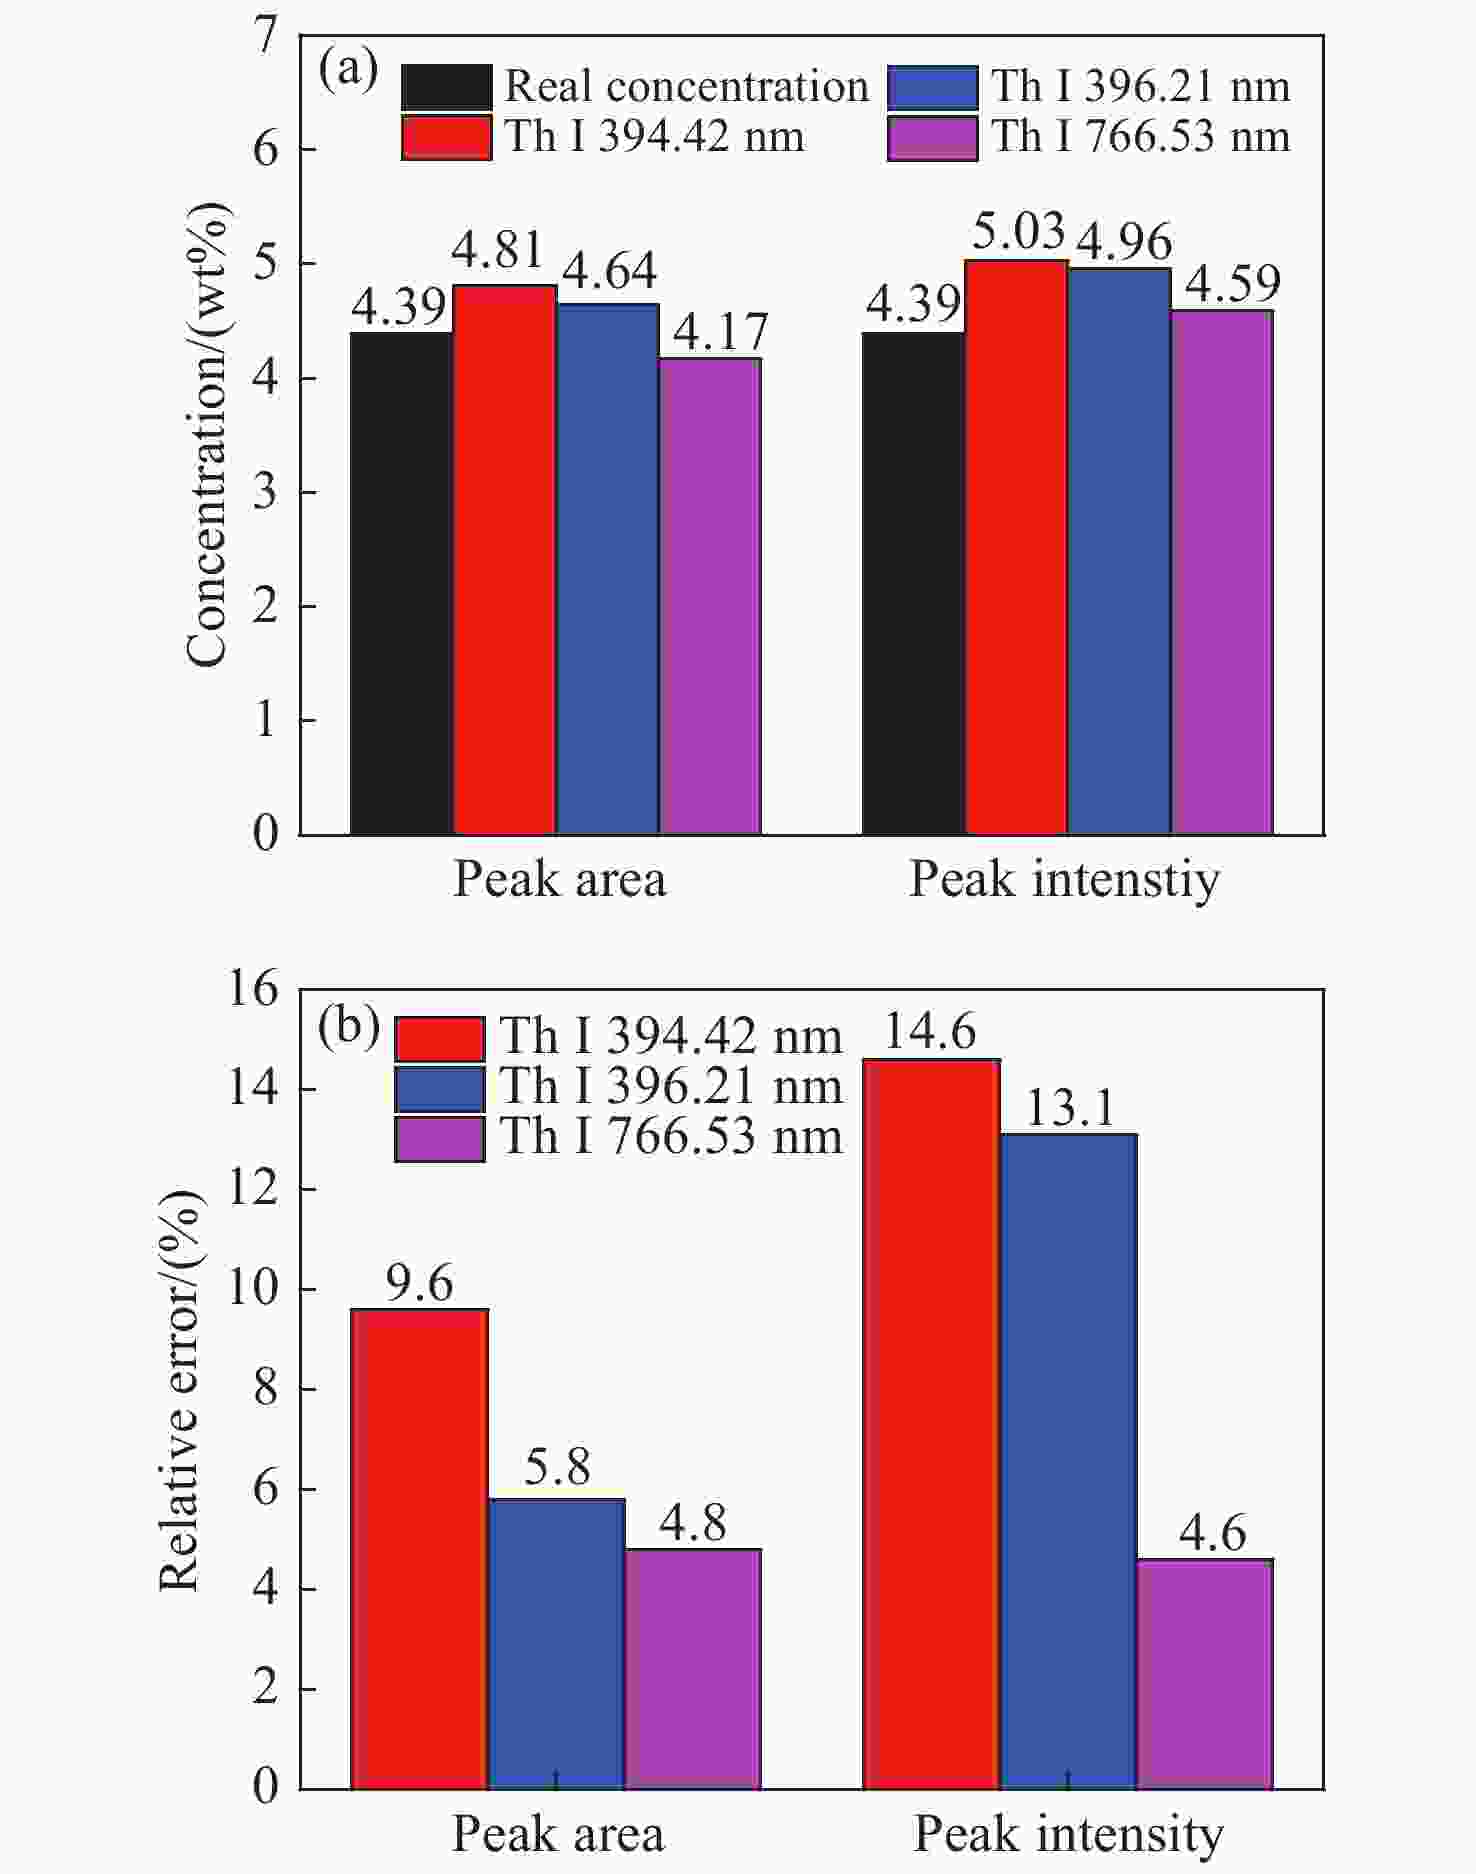
图 9 内标法对5#样品的预测性能:(a)预测含量值;(b)其相对误差
Figure 9. The performance of internal standard for sample 5#: (a)prediction concentrations; (b)relative errors
表 1 各条分析谱线的指数函数拟合参数
Table 1. Fitted parameters from the curves for analytical lines using exponential equation
Area Intensity 394.42 nm 396.21 nm 766.53 nm 394.42 nm 396.21 nm 766.53 nm Y0 117.82 182.75 330.22 568.25 960.34 551.86 A −108.81 −162.09 −326.49 −528.86 −826.96 −534.61 t 8.27 7.78 14.62 6.04 6.07 10.25 R2 0.994 0.996 0.989 0.990 0.981 0.993  下载: 导出CSV
表 2 各条谱线在低含量区间的定标曲线参数
Table 2. Fitted parameters from the calibration curves for analytical lines in the lower concentration region
Area Intensity 394.42 nm 396.21 nm 766.53 nm 394.42 nm 396.21 nm 766.53 nm a 13.04 26.99 8.62 65.05 0.218 26.08 b 8.04 0.135 16.31 49.06 13.24 32.31 R2 0.996 0.959 0.897 0.950 0.931 0.978
下载: 导出CSV
表 3 各条谱线内标法拟合曲线参数
Table 3. Fitted parameters from the calibration curves for analytical lines using internal standard
Rarea Rintensity 394.42 nm 396.21 nm 766.53 nm 394.42 nm 396.21 nm 766.53 nm a 0.12 0.24 0.04 0.08 0.22 0.02 b 0.08 0.13 0.19 0.06 0.10 0.05 R2 0.972 0.959 0.929 0.928 0.921 0.941
下载: 导出CSV
表 4 内标法定标曲线参数及其对9#样品的含量预测结果
Table 4. Fitted parameters of the calibration curves using internal standard and the results of the prediction for 9# sample
Creal
/
wt%Wavelength/nm
766.53a b $ {R}^{2} $ Cprediction
/
wt%ER/% 35.12 Peak area −0.04 0.23 0.951 33.99 3.2 Peak intensity 0.0005 0.06 0.941 29.75 15.3
下载: 导出CSV
-
[1] 冷伏海, 刘小平, 李泽霞, 等. 钍基核燃料循环国际发展态势分析[J]. 科学观察,2011,6(6):1-18. doi: 10.15978/j.cnki.1673-5668.2011.06.001LENG F H, LIU X P, LI Z X, et al. International development trend analysis of thorium fuel cycle[J]. Science Focus, 2011, 6(6): 1-18. (in Chinese) doi: 10.15978/j.cnki.1673-5668.2011.06.001 [2] NEA, IAEA. Uranium 2018: resources, production and demand[R]. Paris: OECD, 2018. [3] 徐光宪. 白云鄂博矿钍资源开发利用迫在眉睫[J]. 稀土信息,2005(5):4-5,8.XU G X. The exploitation and utilization of thorium resources in Bayan Obo mine[J]. Rare Earth Information, 2005(5): 4-5,8. (in Chinese) [4] 江绵恒, 徐洪杰, 戴志敏. 未来先进核裂变能——TMSR核能系统[J]. 中国科学院院刊,2012,27(3):366-374. doi: 10.3969/j.issn.1000-3045.2012.03.016JIANG M H, XU H J, DAI ZH M. Advanced fission energy program-TMSR nuclear energy system[J]. Bulletin of the Chinese Academy of Sciences, 2012, 27(3): 366-374. (in Chinese) doi: 10.3969/j.issn.1000-3045.2012.03.016 [5] NAES B E, UMPIERREZ S, RYLAND S, et al. A comparison of laser ablation inductively coupled plasma mass spectrometry, micro X-ray fluorescence spectroscopy, and laser induced breakdown spectroscopy for the discrimination of automotive glass[J]. Spectrochimica Acta Part B:Atomic Spectroscopy, 2008, 63(10): 1145-1150. doi: 10.1016/j.sab.2008.07.005 [6] FEDOTOV P S, FEDYUNINA N N, FILOSOFOV D V, et al. A novel combined countercurrent chromatography-inductively coupled plasma mass spectrometry method for the determination of ultra trace uranium and thorium in Roman lead[J]. Talanta, 2019, 192: 395-399. doi: 10.1016/j.talanta.2018.09.071 [7] WU J, QIU Y, LI X W, et al. Progress of laser-induced breakdown spectroscopy in nuclear industry applications[J]. Journal of Physics D:Applied Physics, 2020, 53(2): 023001. doi: 10.1088/1361-6463/ab477a [8] 李晨毓, 曲亮, 高飞, 等. 激光诱导击穿光谱对金属、陶瓷文物成分的表面及深度分布分析[J]. 中国光学,2020,13(6):1239-1248. doi: 10.37188/CO.2020-0112LI CH Y, QU L, GAO F, et al. Composition analysis of the surface and depth distribution of metal and ceramic cultural relics by laser-induced breakdown spectroscopy[J]. Chinese Optics, 2020, 13(6): 1239-1248. (in Chinese) doi: 10.37188/CO.2020-0112 [9] MANARD B T, WYLIE E M, WILLSON S P. Analysis of rare earth elements in uranium using handheld laser-induced breakdown spectroscopy (HH LIBS)[J]. Applied Spectroscopy, 2018, 72(11): 1653-1660. doi: 10.1177/0003702818775431 [10] CARRICONDO J, SORIA S R, SANTISTEBAN J R, et al. Analysis of erbium diffusion in zirconium-niobium alloys using neutron imaging and laser-induced breakdown spectroscopy[J]. Journal of Nuclear Materials, 2021, 549: 152869. doi: 10.1016/j.jnucmat.2021.152869 [11] KAUTZ E J, DEVARAJ A, SENOR D J, et al. Hydrogen isotopic analysis of nuclear reactor materials using ultrafast laser-induced breakdown spectroscopy[J]. Optics Express, 2021, 29(4): 4936-4946. doi: 10.1364/OE.412351 [12] SINGH M, SARKAR A, BANERJEE J, et al. Analysis of simulated high burnup nuclear fuel by laser induced breakdown spectroscopy[J]. Spectrochimica Acta Part B:Atomic Spectroscopy, 2017, 132: 1-7. doi: 10.1016/j.sab.2017.03.012 [13] CHAN G C Y, CHOI I, MAO X L, et al. Isotopic determination of uranium in soil by laser induced breakdown spectroscopy[J]. Spectrochimica Acta Part B:Atomic Spectroscopy, 2016, 122: 31-39. doi: 10.1016/j.sab.2016.05.014 [14] HAN S K, PARK S H, AHN S K. Quantitative analysis of uranium in electro-recovery salt of pyroprocessing using laser-induced breakdown spectroscopy[J]. Plasma Science and Technology, 2021, 23(5): 055502. doi: 10.1088/2058-6272/abed2d [15] CHINNI R C, CREMERS D A, RADZIEMSKI L J, et al. Detection of uranium using laser-induced breakdown spectroscopy[J]. Applied Spectroscopy, 2009, 63(11): 1238-1250. doi: 10.1366/000370209789806867 [16] WILLIAMS A, PHONGIKAROON S. Laser-induced breakdown spectroscopy (LIBS) measurement of uranium in molten salt[J]. Applied Spectroscopy, 2018, 72(7): 1029-1039. doi: 10.1177/0003702818760311 [17] AL-SHBOUL K F, HARILAL S S, HASSANEIN A. Emission features of femtosecond laser ablated carbon plasma in ambient helium[J]. Journal of Applied Physics, 2013, 113(16): 163305. doi: 10.1063/1.4803096 [18] RETHFELD B, SOKOLOWSKI-TINTEN K, VON DER LINDE D, et al. Timescales in the response of materials to femtosecond laser excitation[J]. Applied Physics A, 2004, 79(4): 767-769. [19] KO P, HARTIG K C, MCNUTT J P, et al. Adaptive femtosecond laser-induced breakdown spectroscopy of uranium[J]. Review of Scientific Instruments, 2013, 84(1): 013104. doi: 10.1063/1.4779042 [20] HARTIG K C, HARILAL S S, PHILLIPS M C, et al. Evolution of uranium monoxide in femtosecond laser-induced uranium plasmas[J]. Optics Express, 2017, 25(10): 11477-11490. doi: 10.1364/OE.25.011477 [21] RUSSO R E, MAO X L, LIU H C, et al. Time-resolved plasma diagnostics and mass removal during single-pulse laser ablation[J]. Applied Physics A, 1999, 69(S1): S887-S894. [22] ZHOU SH CH, YANG W S, PARK T, et al. Fuel cycle analysis of molten salt reactors based on coupled neutronics and thermal-hydraulics calculations[J]. Annals of Nuclear Energy, 2018, 114: 369-383. doi: 10.1016/j.anucene.2017.10.040 [23] ARAGÓN C, AGUILERA JA, PEÑALBA F. Improvements in quantitative analysis of steel composition by laser-induced breakdown spectroscopy at atmospheric pressure using an infrared Nd: YAG laser[J]. Applied Spectroscopy, 1999, 53(10): 1259-1267. doi: 10.1366/0003702991945506 [24] SARKAR A, ALAMELU D, AGGARWAL S K. Laser-induced breakdown spectroscopy for determination of uranium in thorium-uranium mixed oxide fuel materials[J]. Talanta, 2009, 78(3): 800-804. doi: 10.1016/j.talanta.2008.12.046 [25] ASD. NIST atomic spectra database lines form[EB/OL].https://physics.nist.gov/PhysRefData/ASD/lines_form.html. [26] ZOROV N B, GORBATENKO A A, LABUTIN T A, et al. A review of normalization techniques in analytical atomic spectrometry with laser sampling: from single to multivariate correction[J]. Spectrochimica Acta Part B:Atomic Spectroscopy, 2010, 65(8): 642-657. doi: 10.1016/j.sab.2010.04.009 [27] DEVANGAD P, UNNIKRISHNAN V K, NAYAK R, et al. Performance evaluation of laser induced breakdown spectroscopy (LIBS) for quantitative analysis of rare earth elements in phosphate glasses[J]. Optical Materials, 2016, 52: 32-37. doi: 10.1016/j.optmat.2015.12.001 -

 下载:
下载:


计量
- 文章访问数: 970
- HTML全文浏览量: 808
- PDF下载量: 310
- 被引次数: 0
