


-
摘要:
脑胶质瘤是一种常见的颅内原发性肿瘤,具有治愈率低、复发率高等特点。脑胶质瘤边界的精准识别是减少患者术后复发、改善愈后状况的重要前提。因此,发展快速、高灵敏度、无标记的脑胶质瘤诊断方法具有重要的临床意义。拉曼光谱技术作为一种指纹谱,能够在分子水平上反映物质的化学和结构信息,已经在脑胶质瘤的定性定位识别中表现出巨大的应用前景。本文首先介绍了不同种类的拉曼光谱技术,其次梳理了拉曼光谱技术在脑胶质瘤中的研究现状,最后对拉曼光谱技术在脑胶质瘤检测中的未来发展进行展望。
Abstract:Brain glioma is a common type of brain tumor with a low cure rate and a high recurrence rate. Precise identification of tumor boundaries is an important prerequisite for reducing recurrence and improving prognosis. Developing a rapid, high-sensitivity and label-free diagnostic method is of crucial clinical significance regarding glioma. Raman spectroscopy can reflect substance’s chemical and structural information at the molecular level due to its fingerprint characteristics. It has already shown excellent prospects for the location and identification of glioma. Firstly, we introduce the different types of Raman spectroscopy technologies in this paper. Secondly, the research status of glioma diagnosis based on Raman spectroscopy is reviewed. Finally, the future development of glioma diagnosis through Raman spectroscopy is prospected.
-
Key words:
- Raman spectroscopy /
- brain glioma /
- detection /
- identification
-
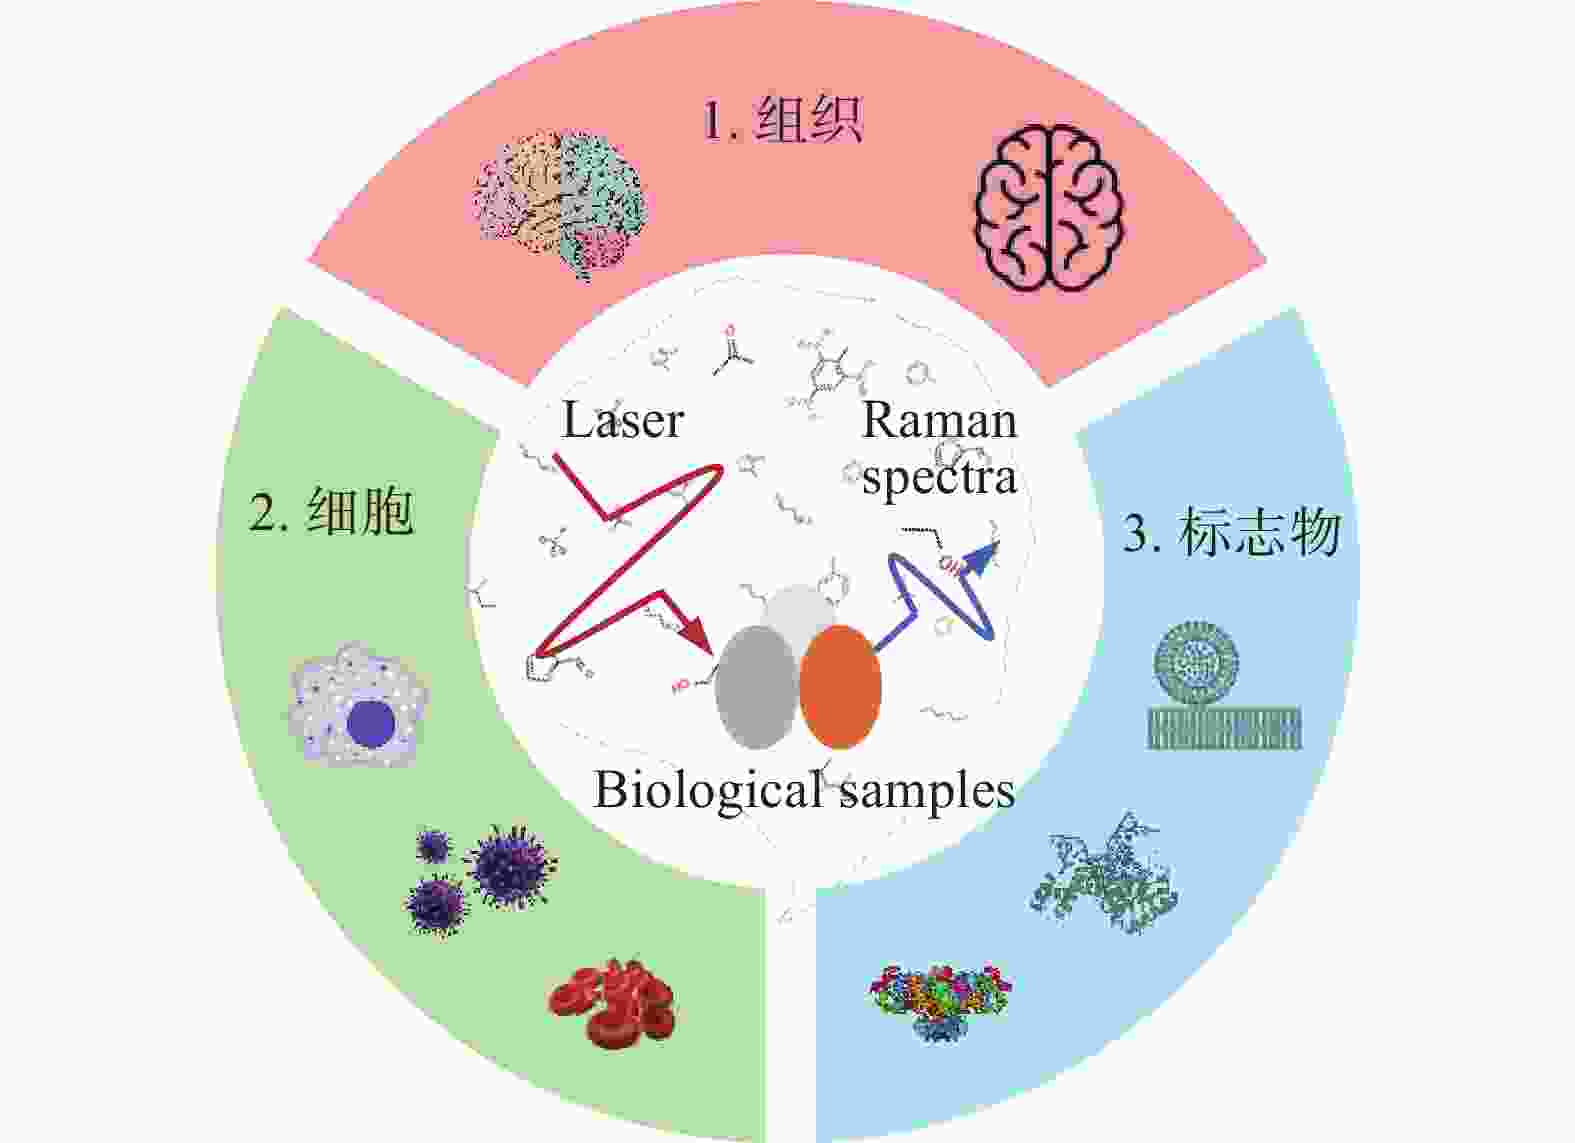
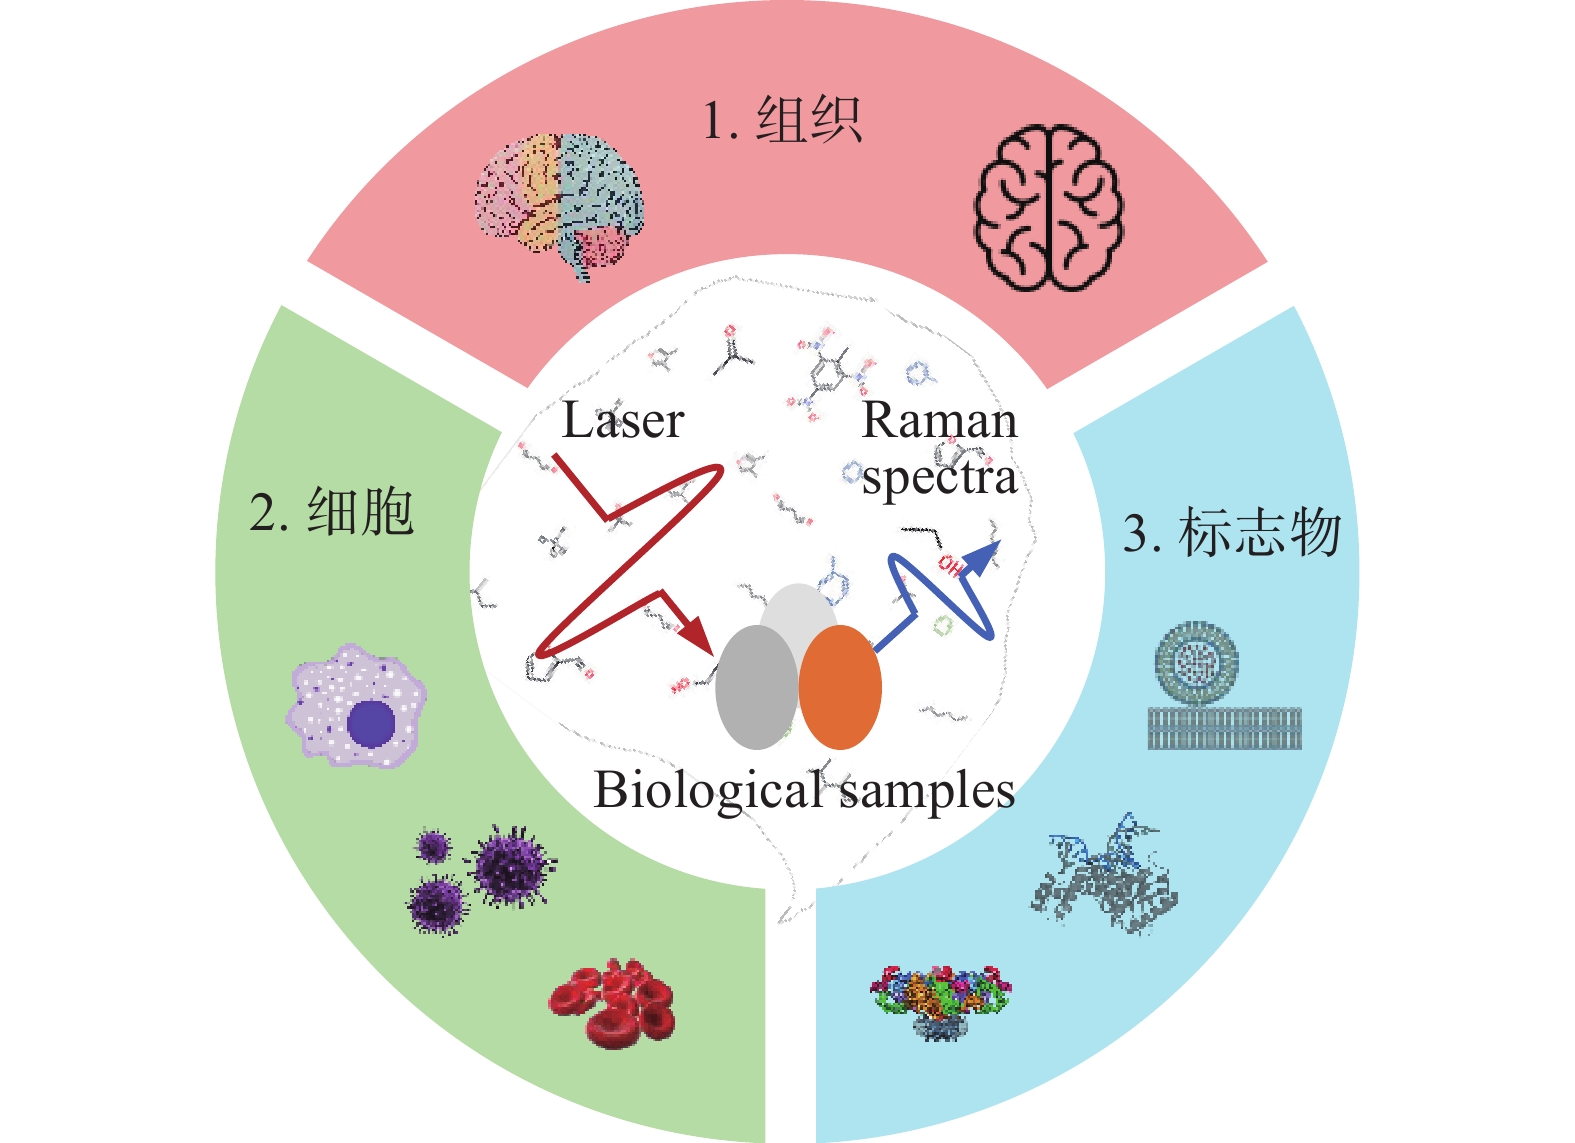
图 1 Raman光谱在脑胶质瘤检测中的研究现状
Figure 1. The research state of the application of Raman spectroscopy in the detection of brain glioma
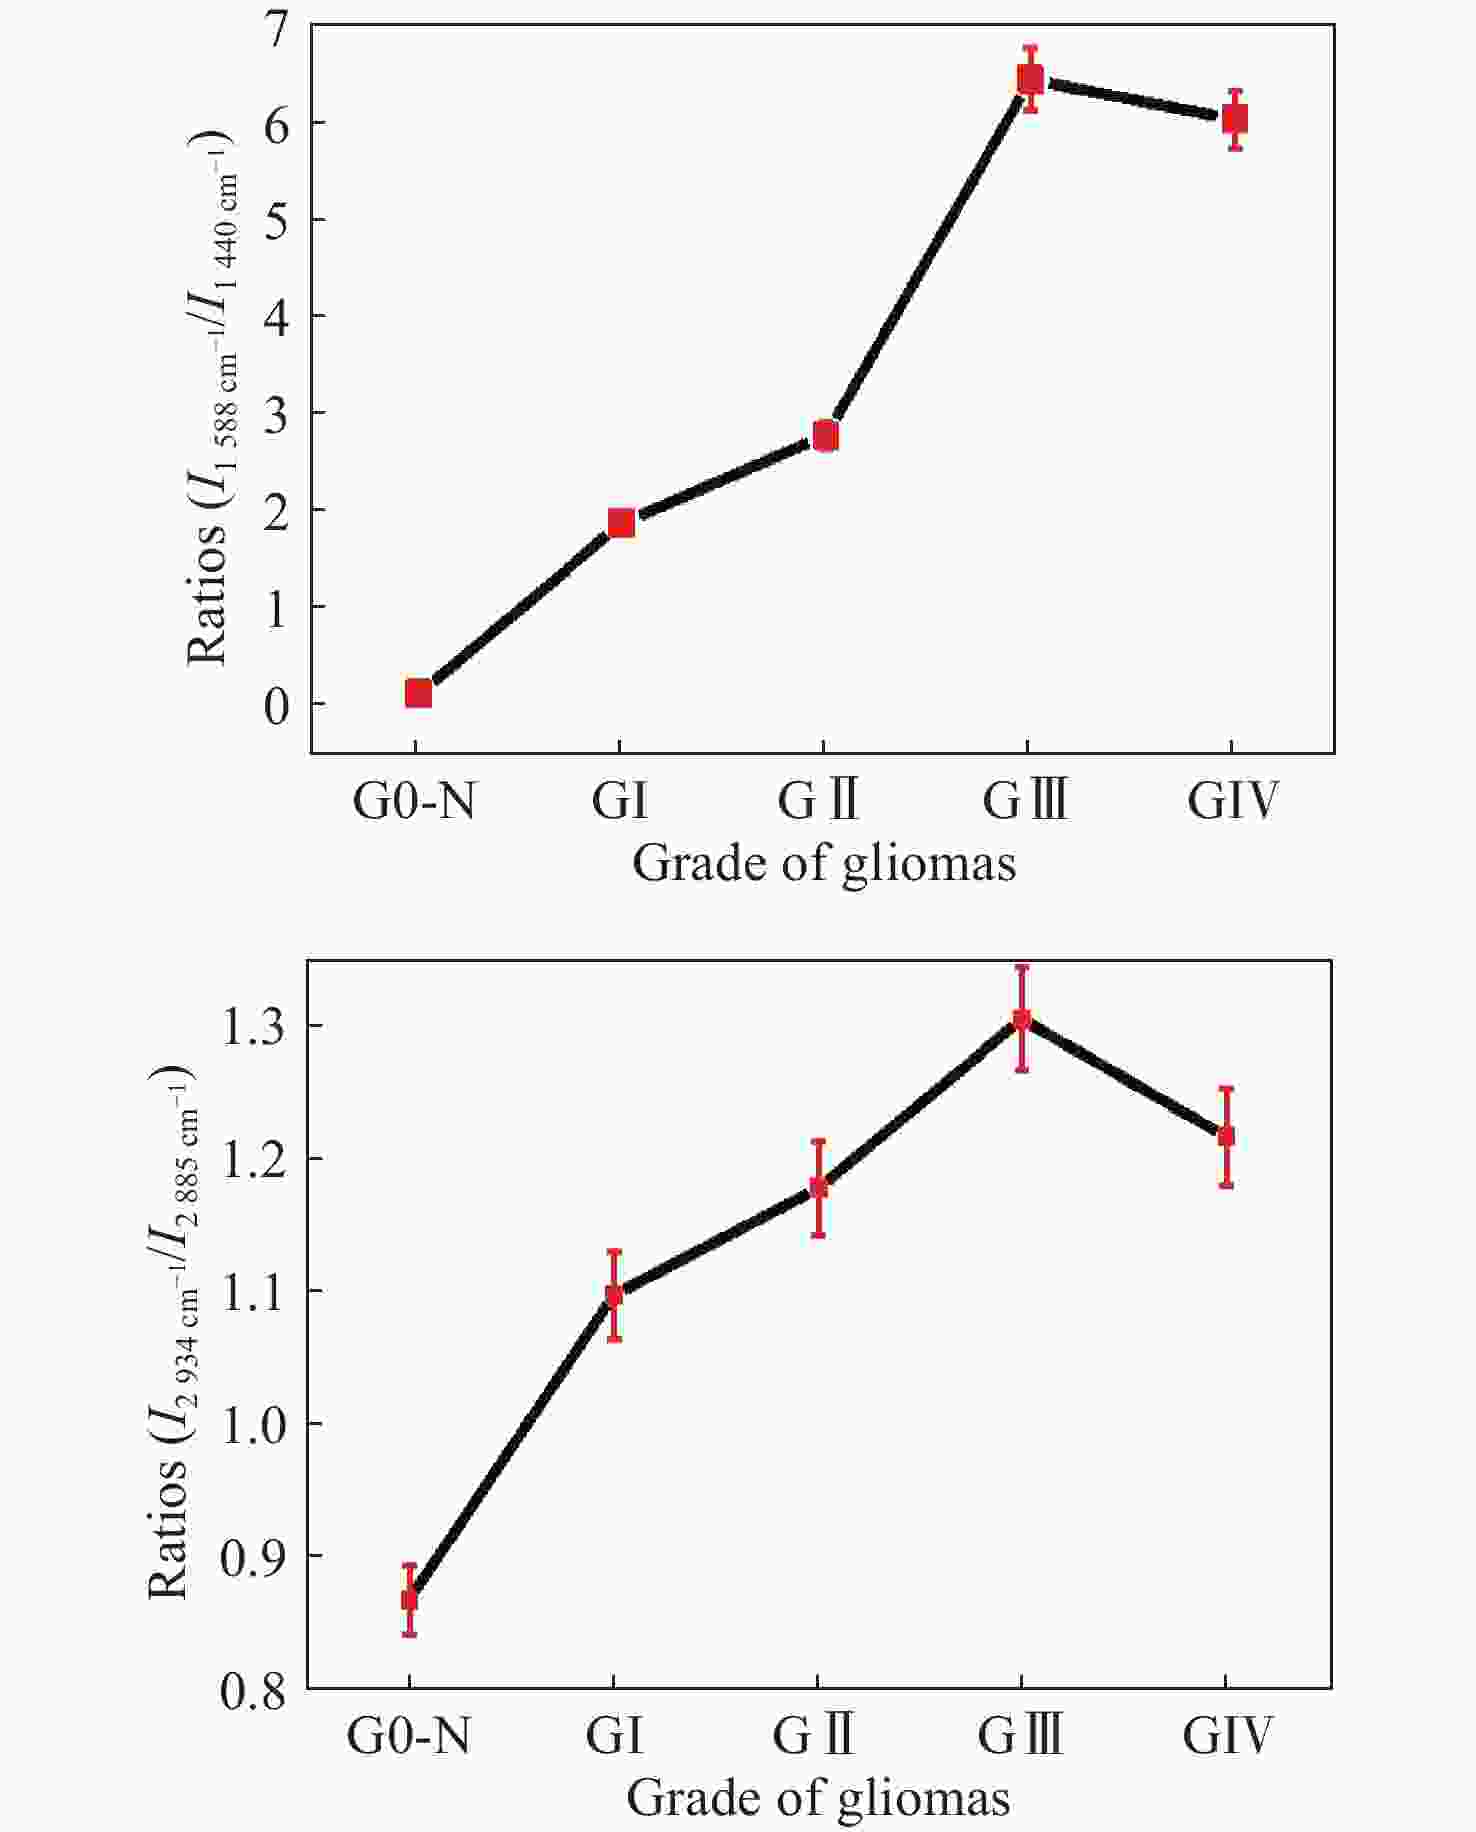
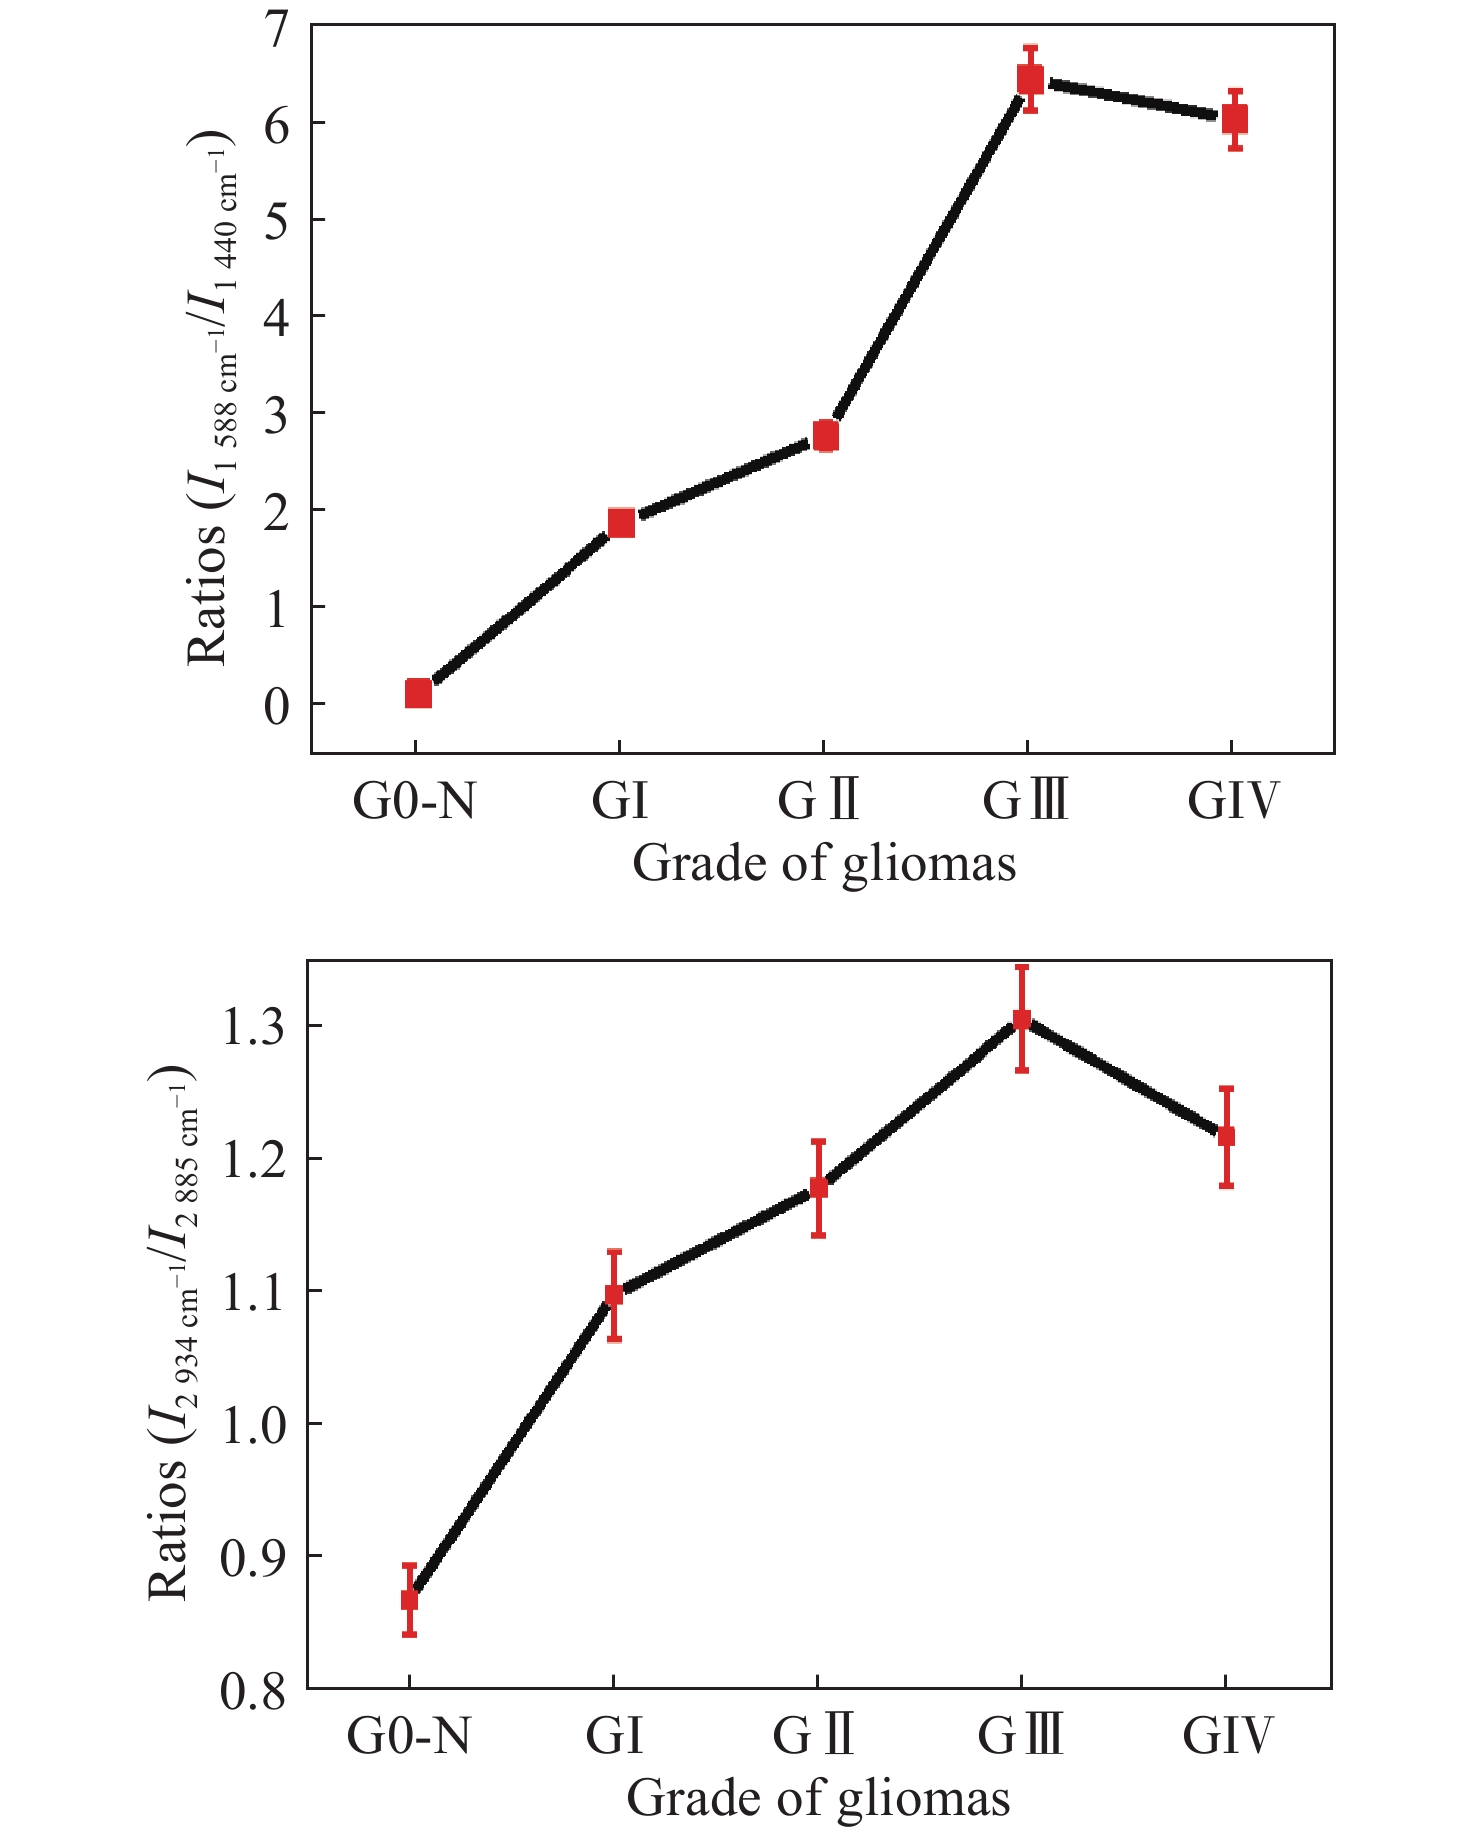
图 12 正常组织和不同恶性胶质瘤组织中(a)
1588 cm−1∶1440 cm−1和(b)2934 cm−1∶2885 cm−1 Raman强度比值,其中G0-N为正常脑组织;GI:I级胶质瘤;GII:II级胶质瘤;GIII:III级胶质瘤;GIV:IV级胶质瘤[45]Figure 12. The ratios of (a) I
1588 cm−1 ∕I1440 cm−1 and (b) I2934 cm−1 ∕I2885 cm−1 from normal human brain tissues and glioma tissues with increasing malignancy; G0-N: normal human brain tissues; GI: grade I; GII: grade II; GIII: grade III; GIV: grade IV[45]
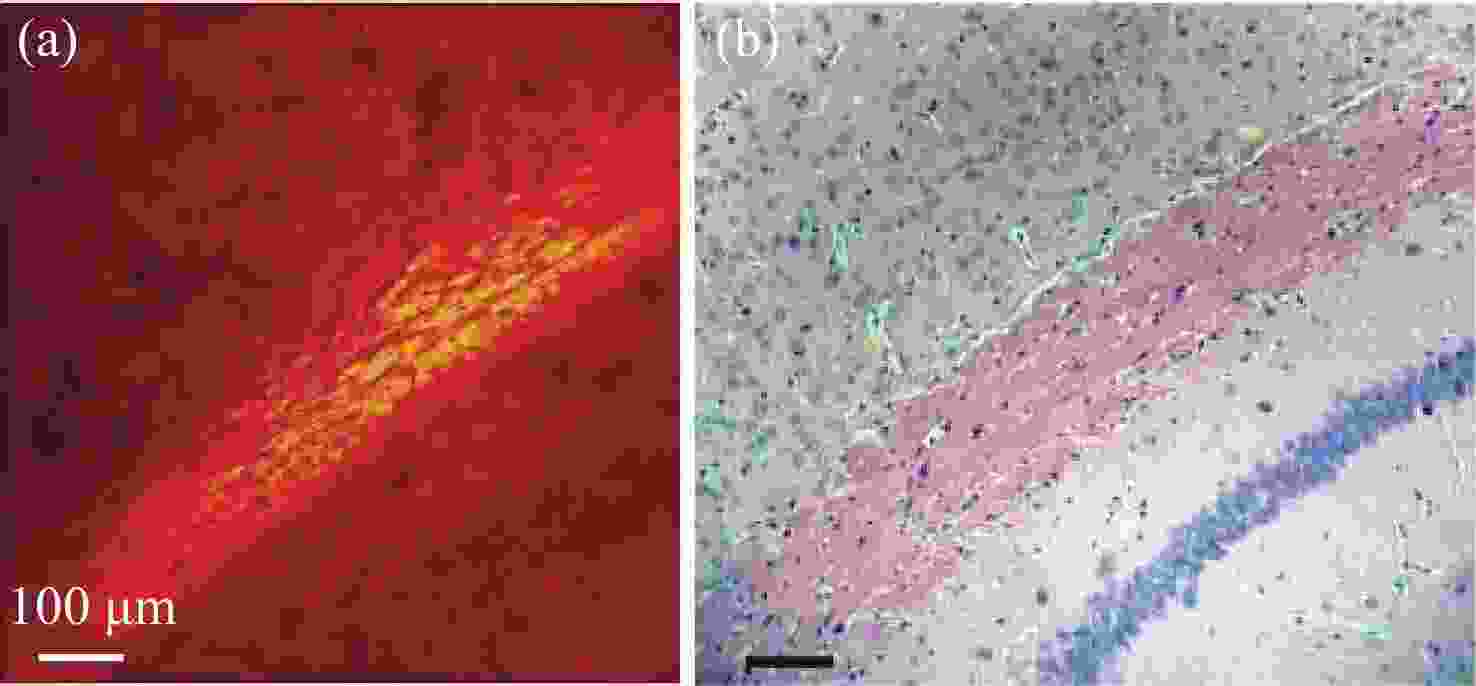
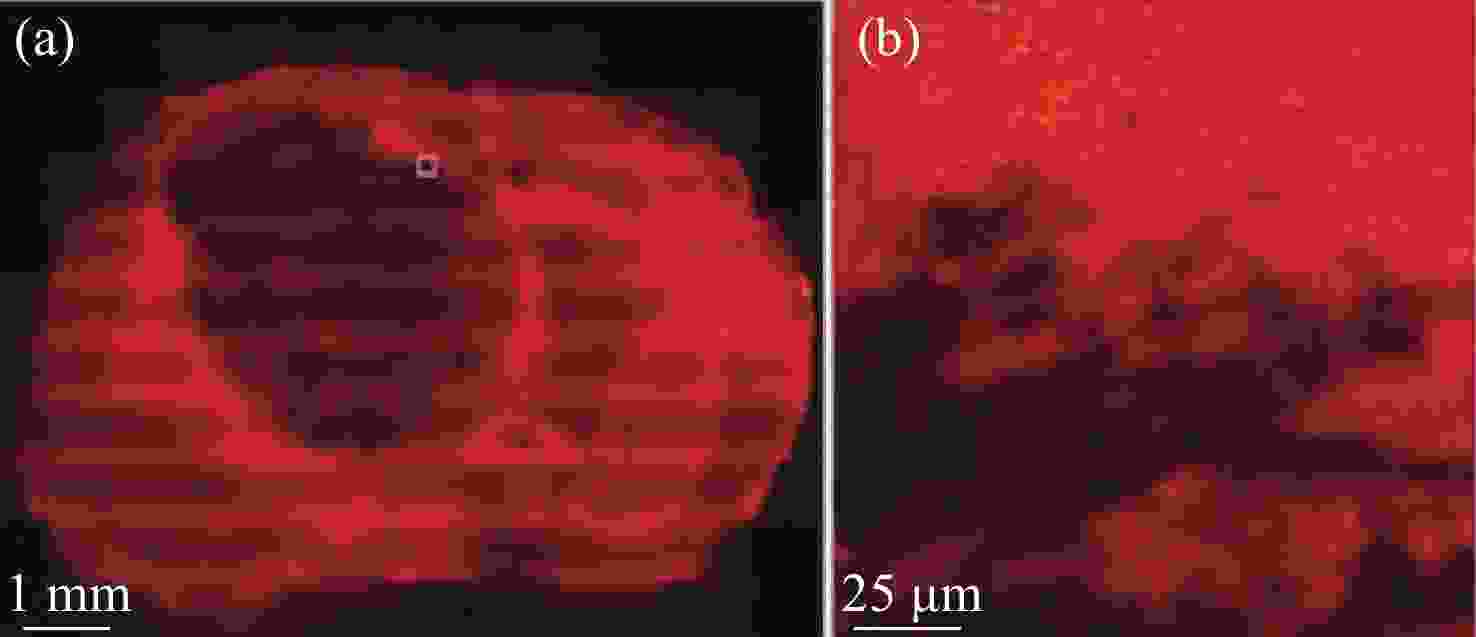
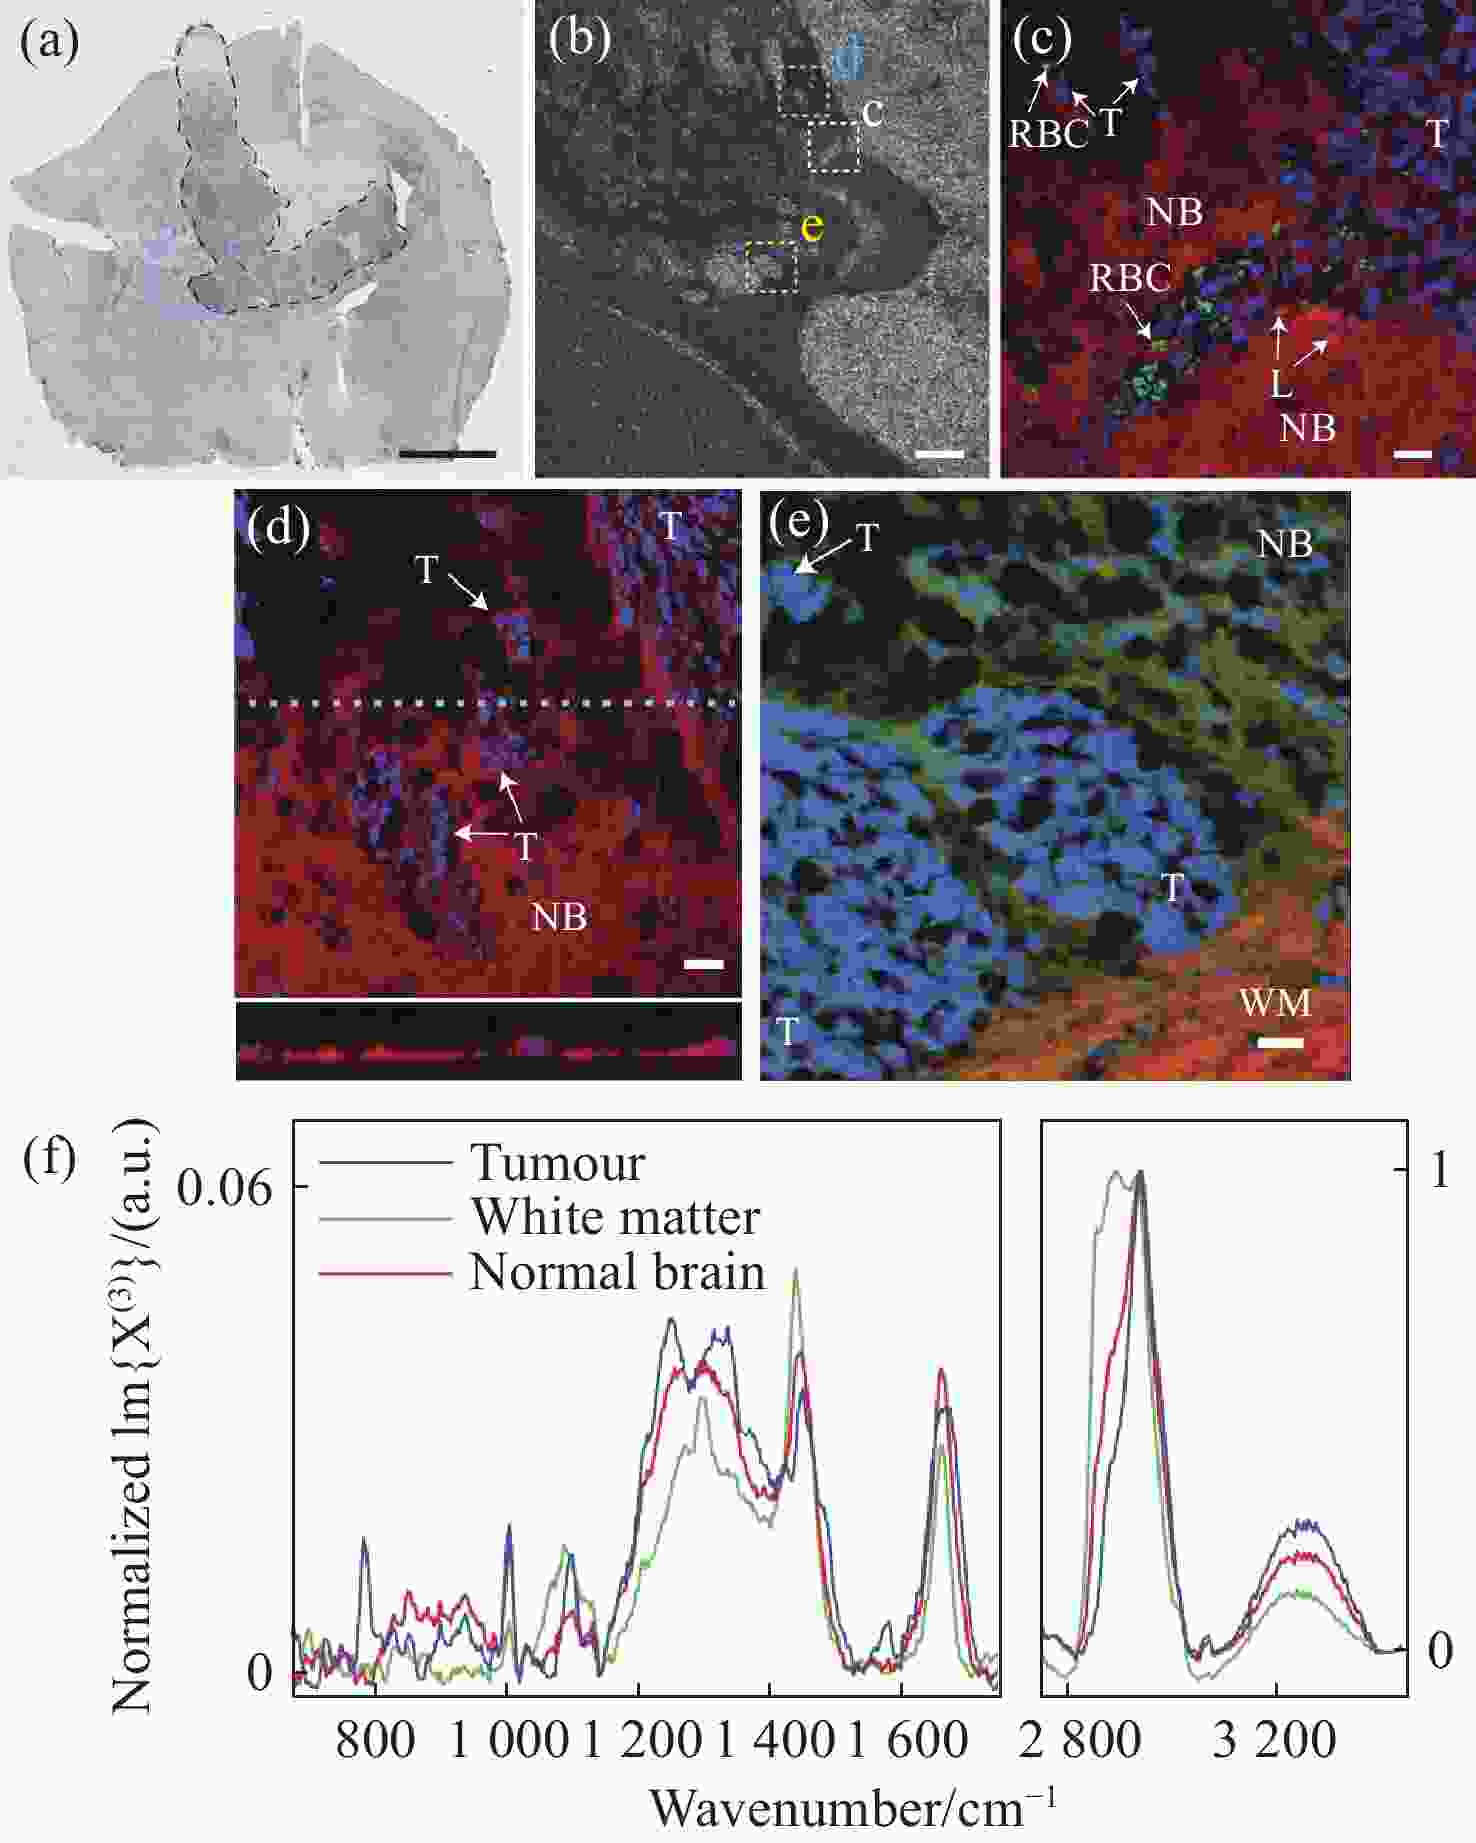
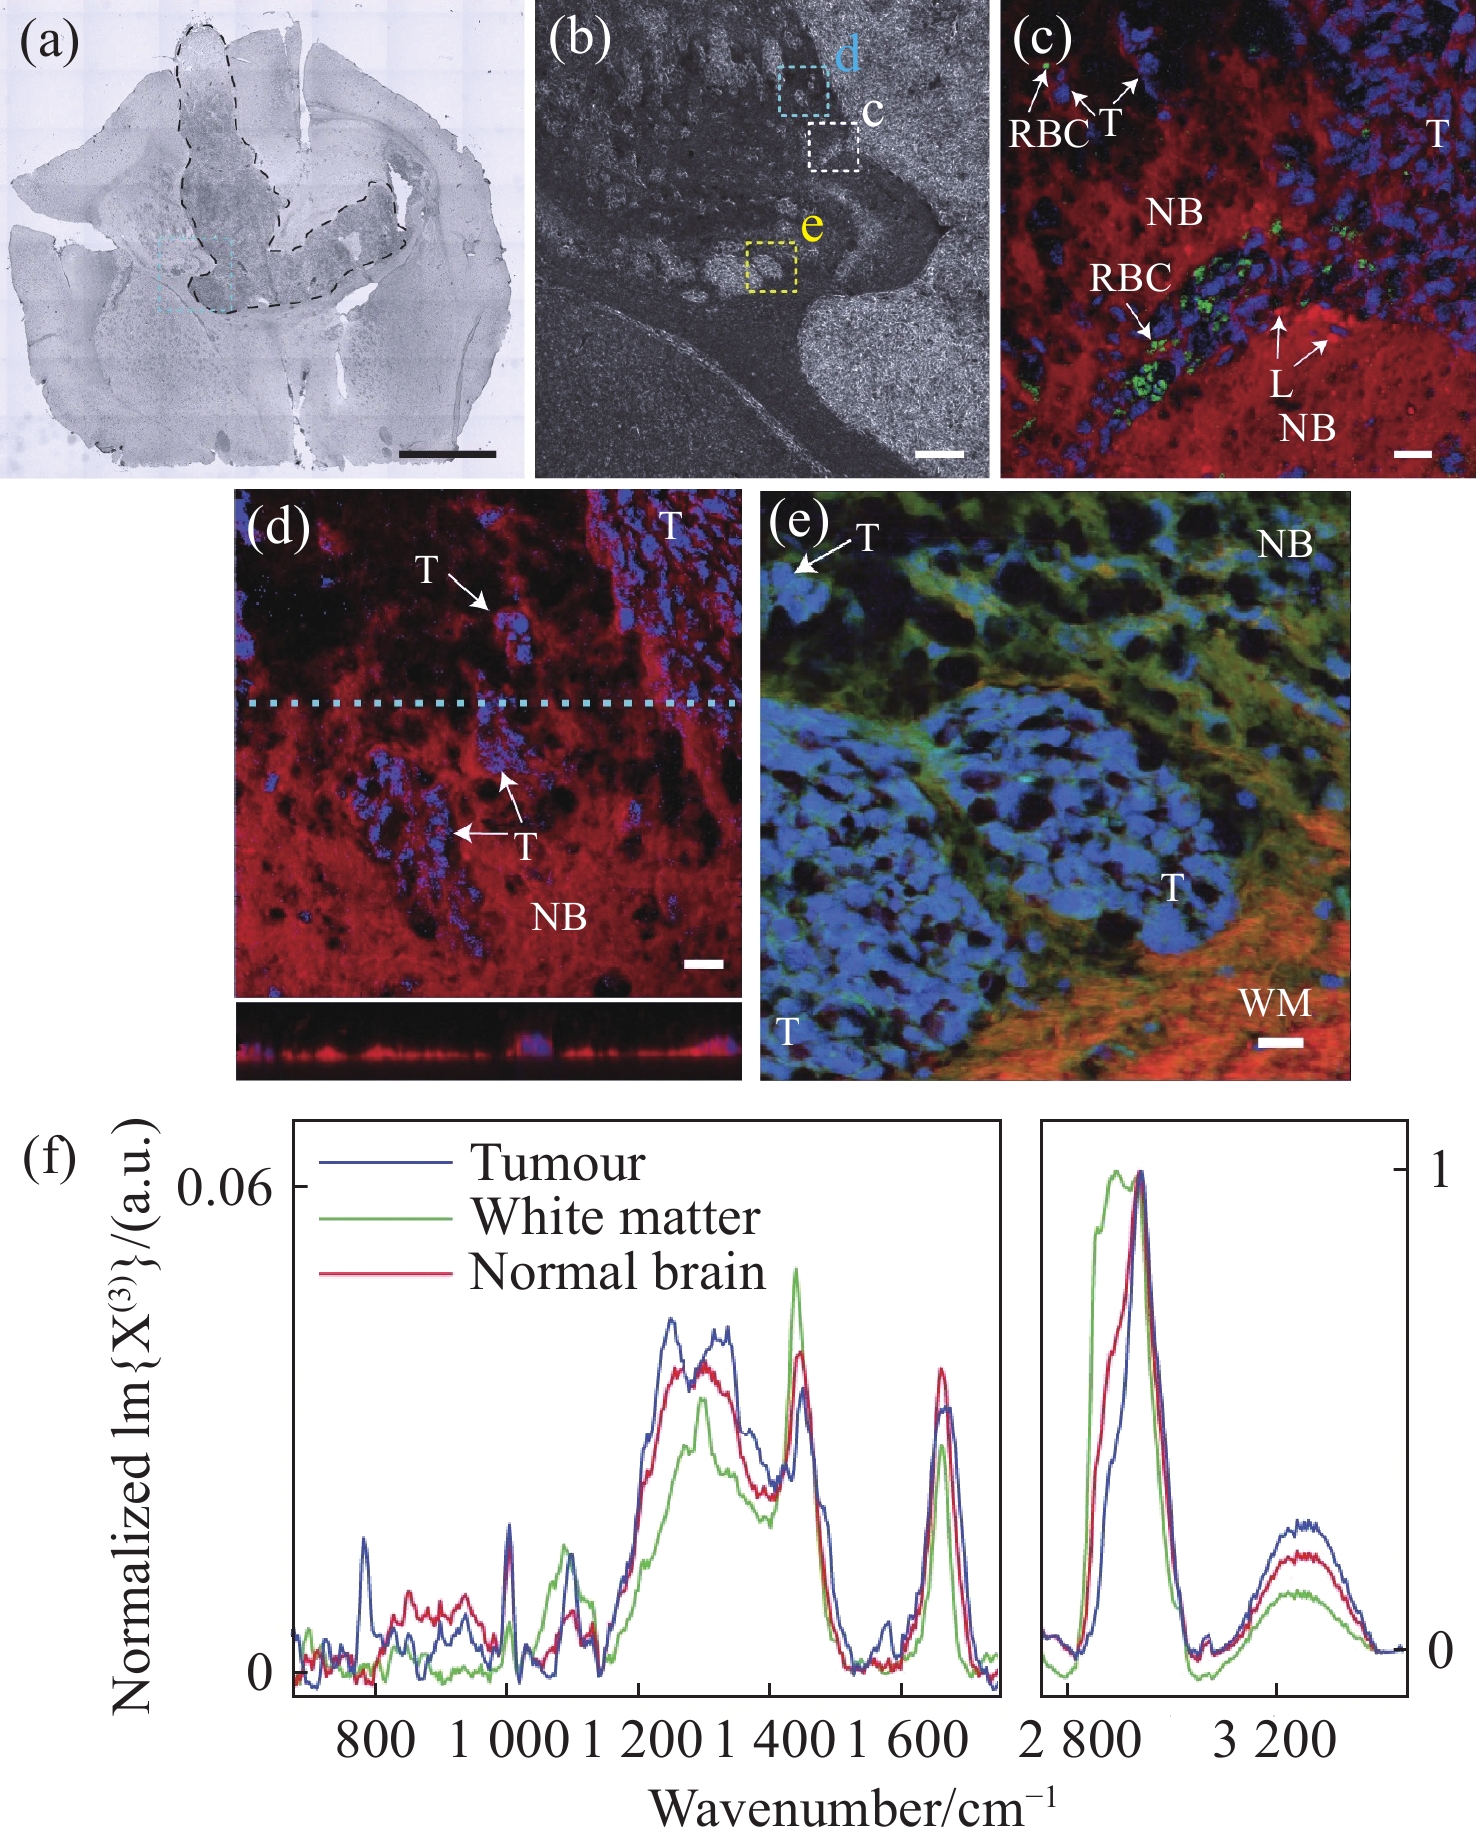
图 17 (a)小鼠脑胶质母细胞瘤的明场图像,其中黑色线为肿瘤边界,青色为感兴趣区域;(b)感光趣区域内的显微图像;(c)肿瘤和正常脑组织的伪彩色图像,蓝色为细胞核、红色为脂质含量、绿色为红细胞;(d)利用细胞核(蓝色)、脂质含量(红色)绘制的CARS图像;(e)细胞核(蓝色)、脂质含量(红色)、CH3-CH2拉伸(绿色)绘制的CARS图像,NB为正常脑组织,T为肿瘤细胞,WM为白质;(f)肿瘤、白质和正常组织的CARS光谱[47]
Figure 17. (a) Bright field image of glioblastoma in mouse brain, with the tumor boundary outlined (black). The cyan indicates a region of interest (ROI); (b) micrograph of ROIs; (c) pseudocolour CARS image of tumor and normal brain tissues, with nuclei highlighted in blue, lipid content in red and red blood cells in green; (d) CARS image with nuclei highlighted in blue and lipid content in red; (e) CARS image with nuclei highlighted in blue, lipid content in red and CH3 stretch–CH2 in green, NB: normal brain; T: tumor cells, WM: white matter; (f) normalized CARS of different tissues[47]
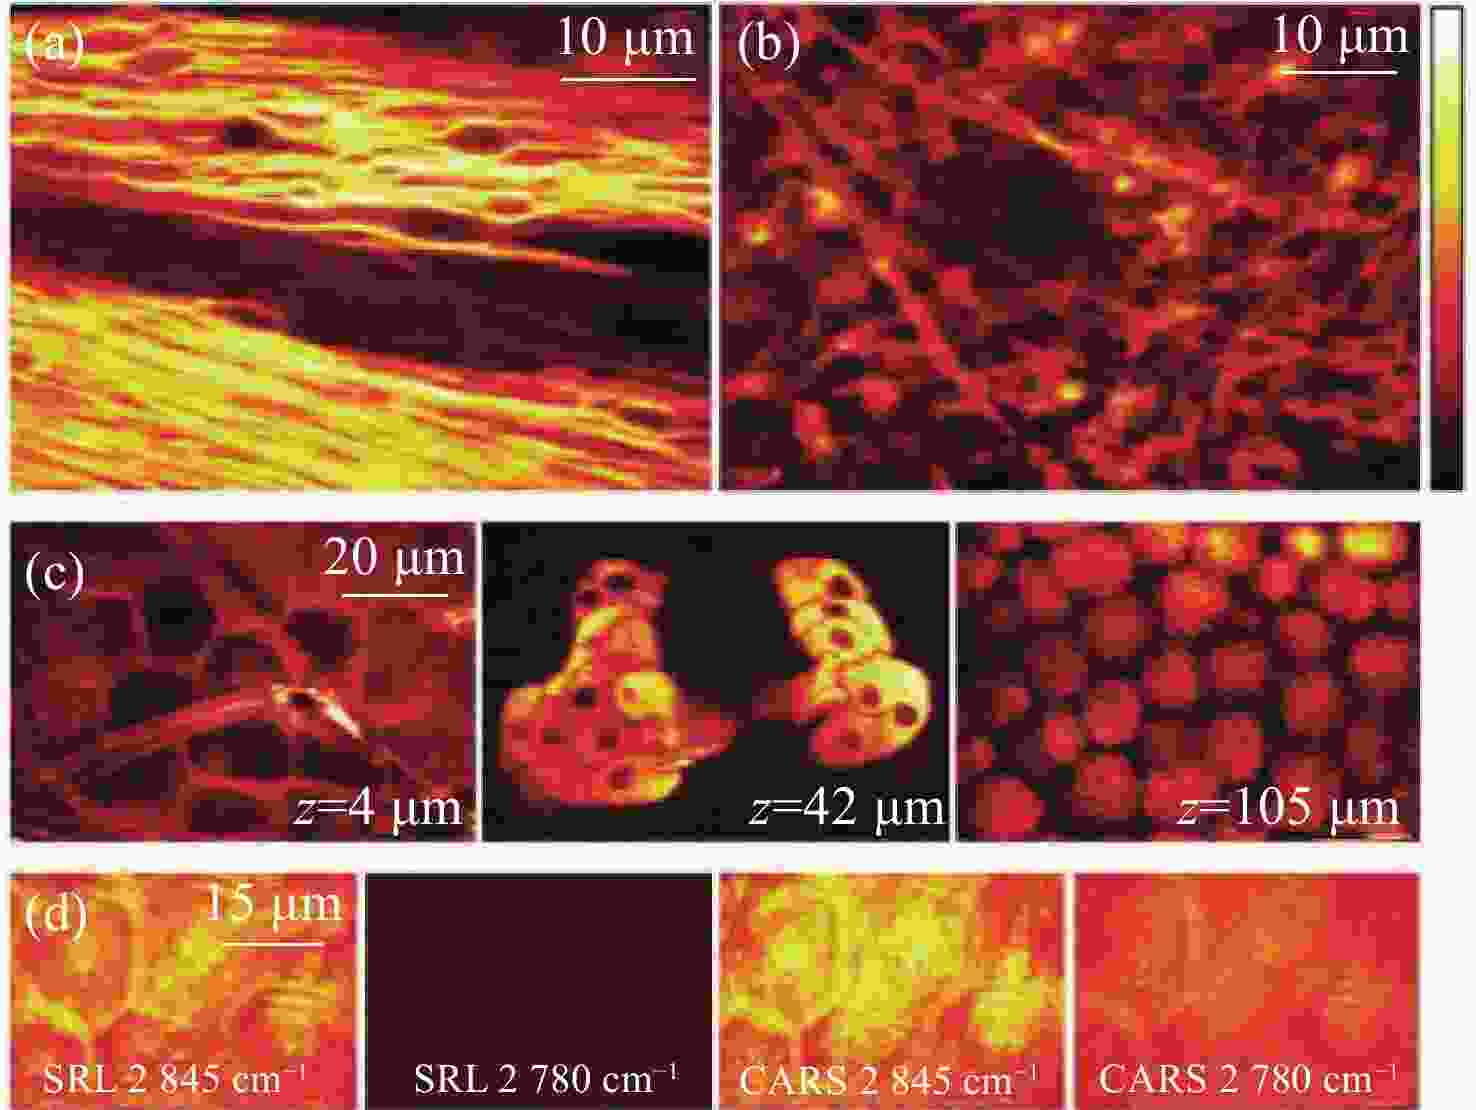
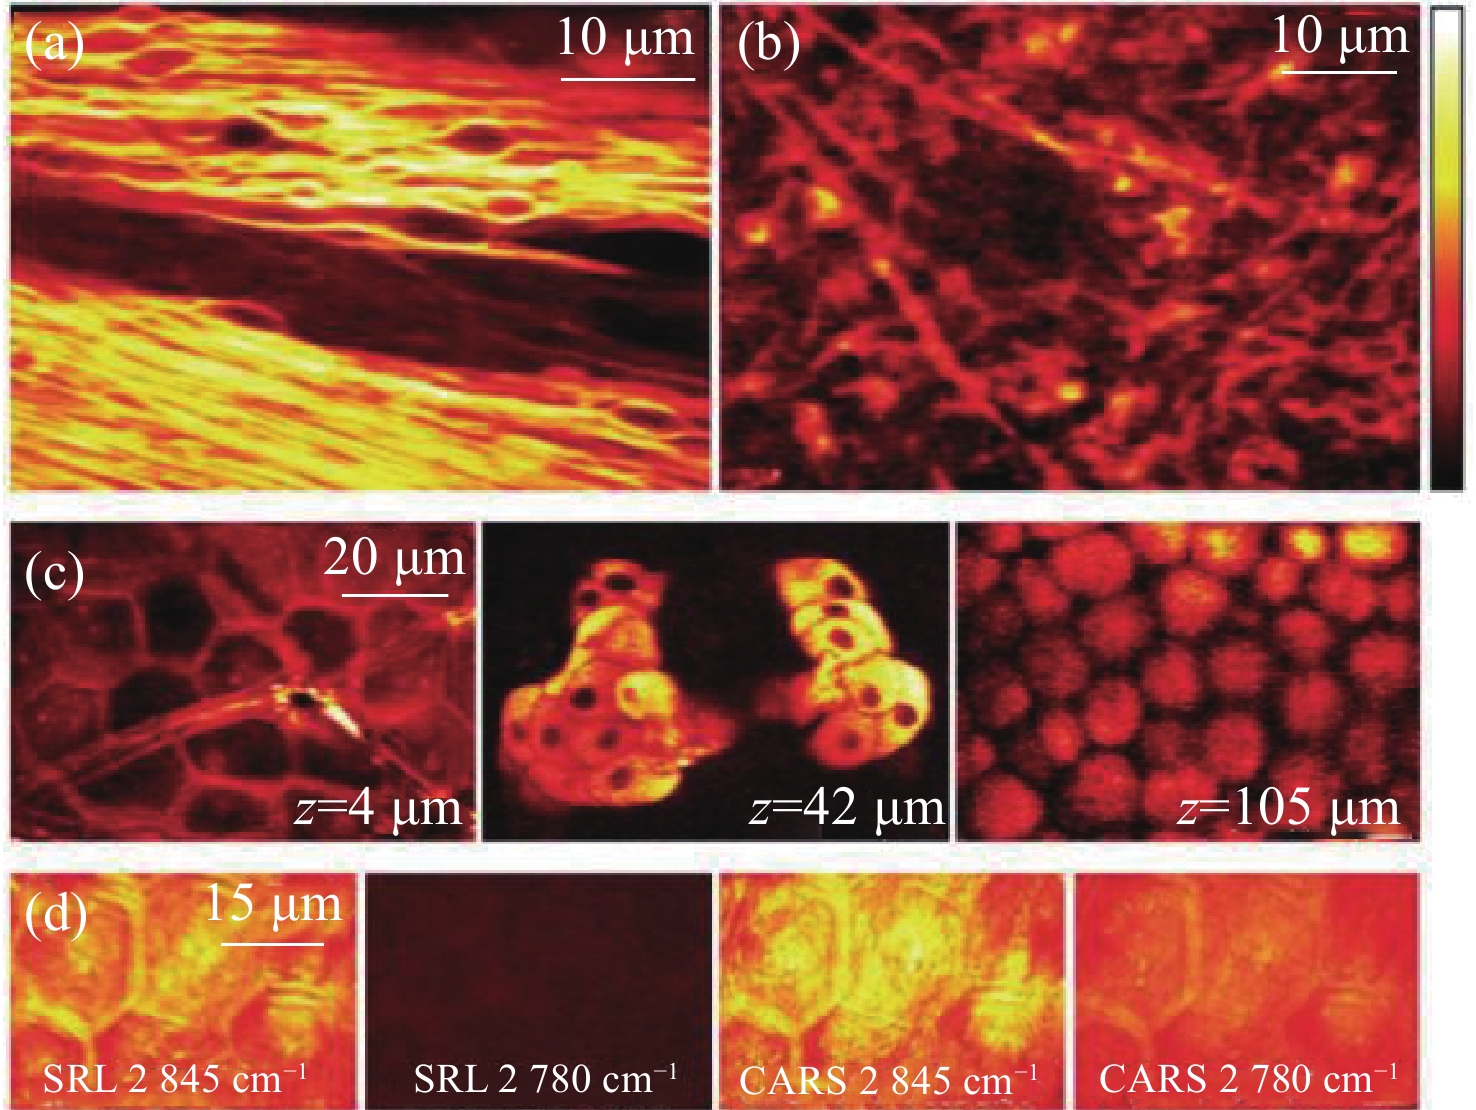
图 18 新鲜小鼠组织的SRS图像。(a)特征峰
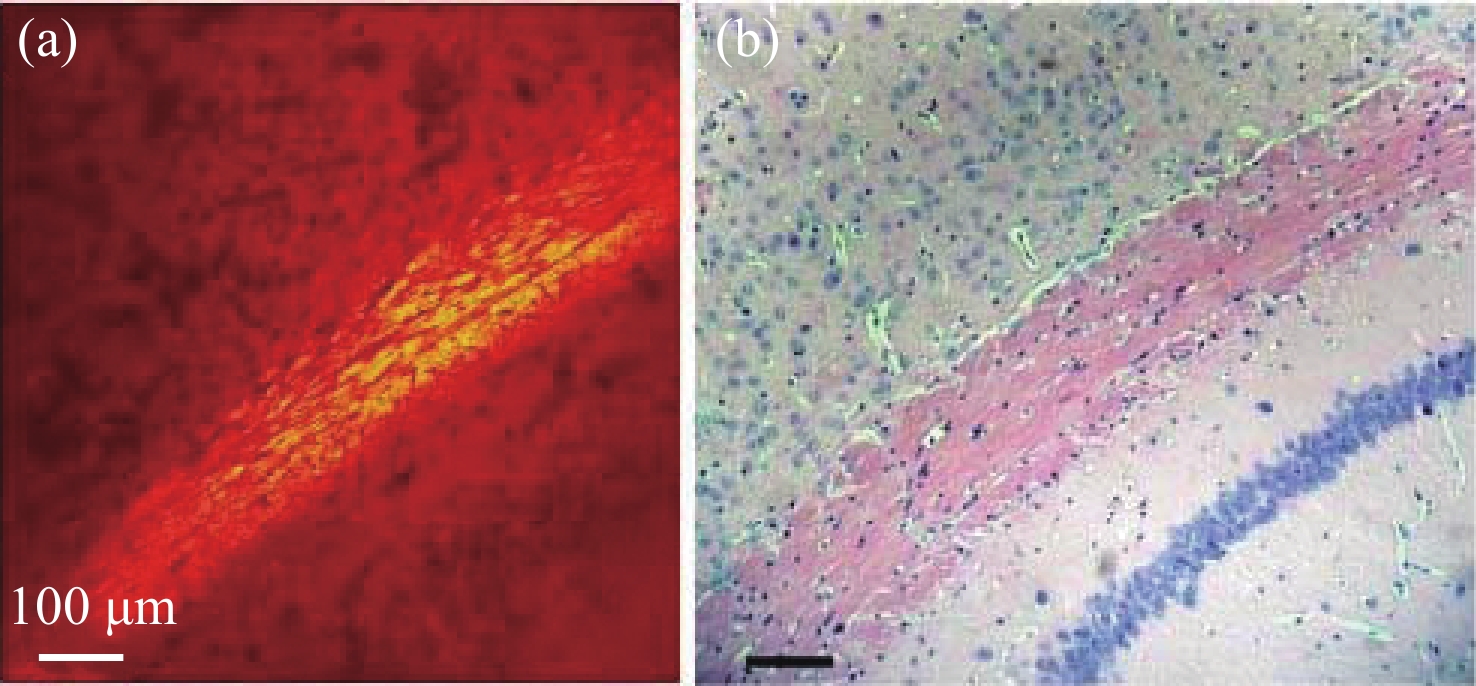
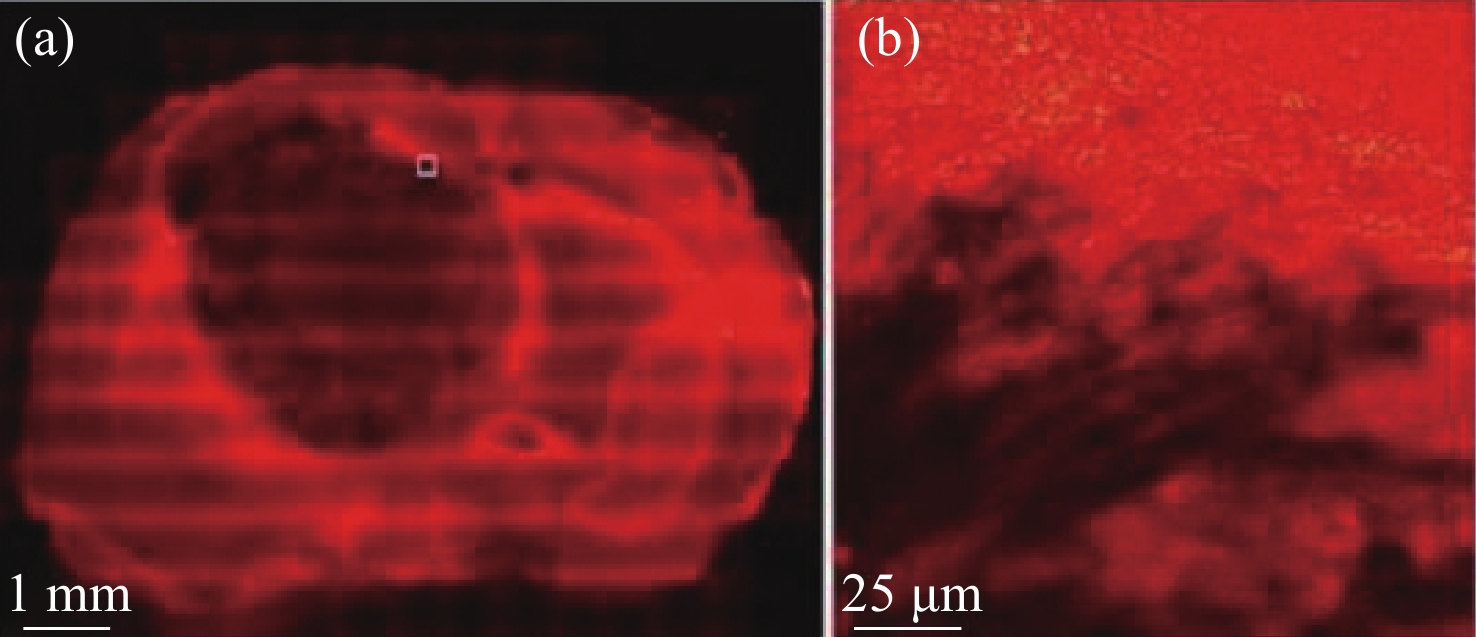
2845 cm−1处小鼠脑胼胝体神经元束中标记出髓鞘中含丰富CH2;(b)约1 mm厚脑组织切片CH2的SRS图像;(c)3个独立区域在同一深度处,小鼠耳皮肤中CH2的SRS图像。从左到右依次为:角质层、皮脂腺和皮下脂肪层;(d)角质层有无CH2共振的SRS和CARS图像对比[47]Figure 18. SRS imaging of fresh mouse tissue. (a) The myelin sheath neuron bundles of the corpus callosum in mouse brain is marked with abundant CH2 at the characteristic peak of
2845 cm−1; (b) SRS image of CH2 acquired from a brain tissue slice ~1 mm thick; (c) SRS images of CH2 in three separate regions at the same depth in mouse ear skin. From left to right: stratum corneum, sebaceous gland, and subcutaneous fat layer; (d) comparison of SRS and CARS images of stratum corneum on and off the CH2 resonance[47]
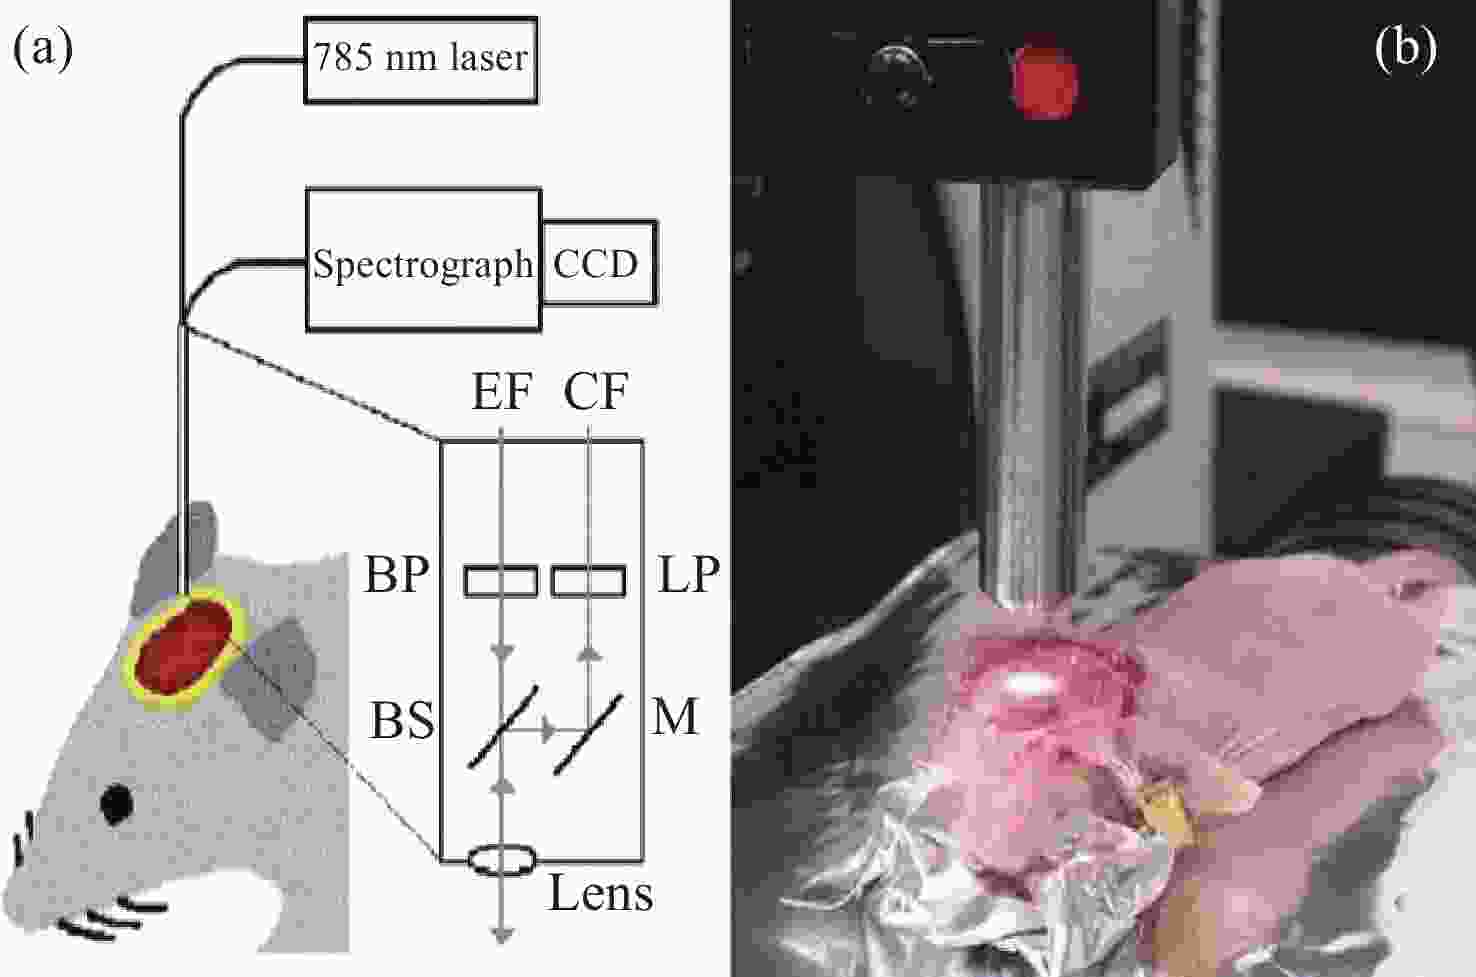
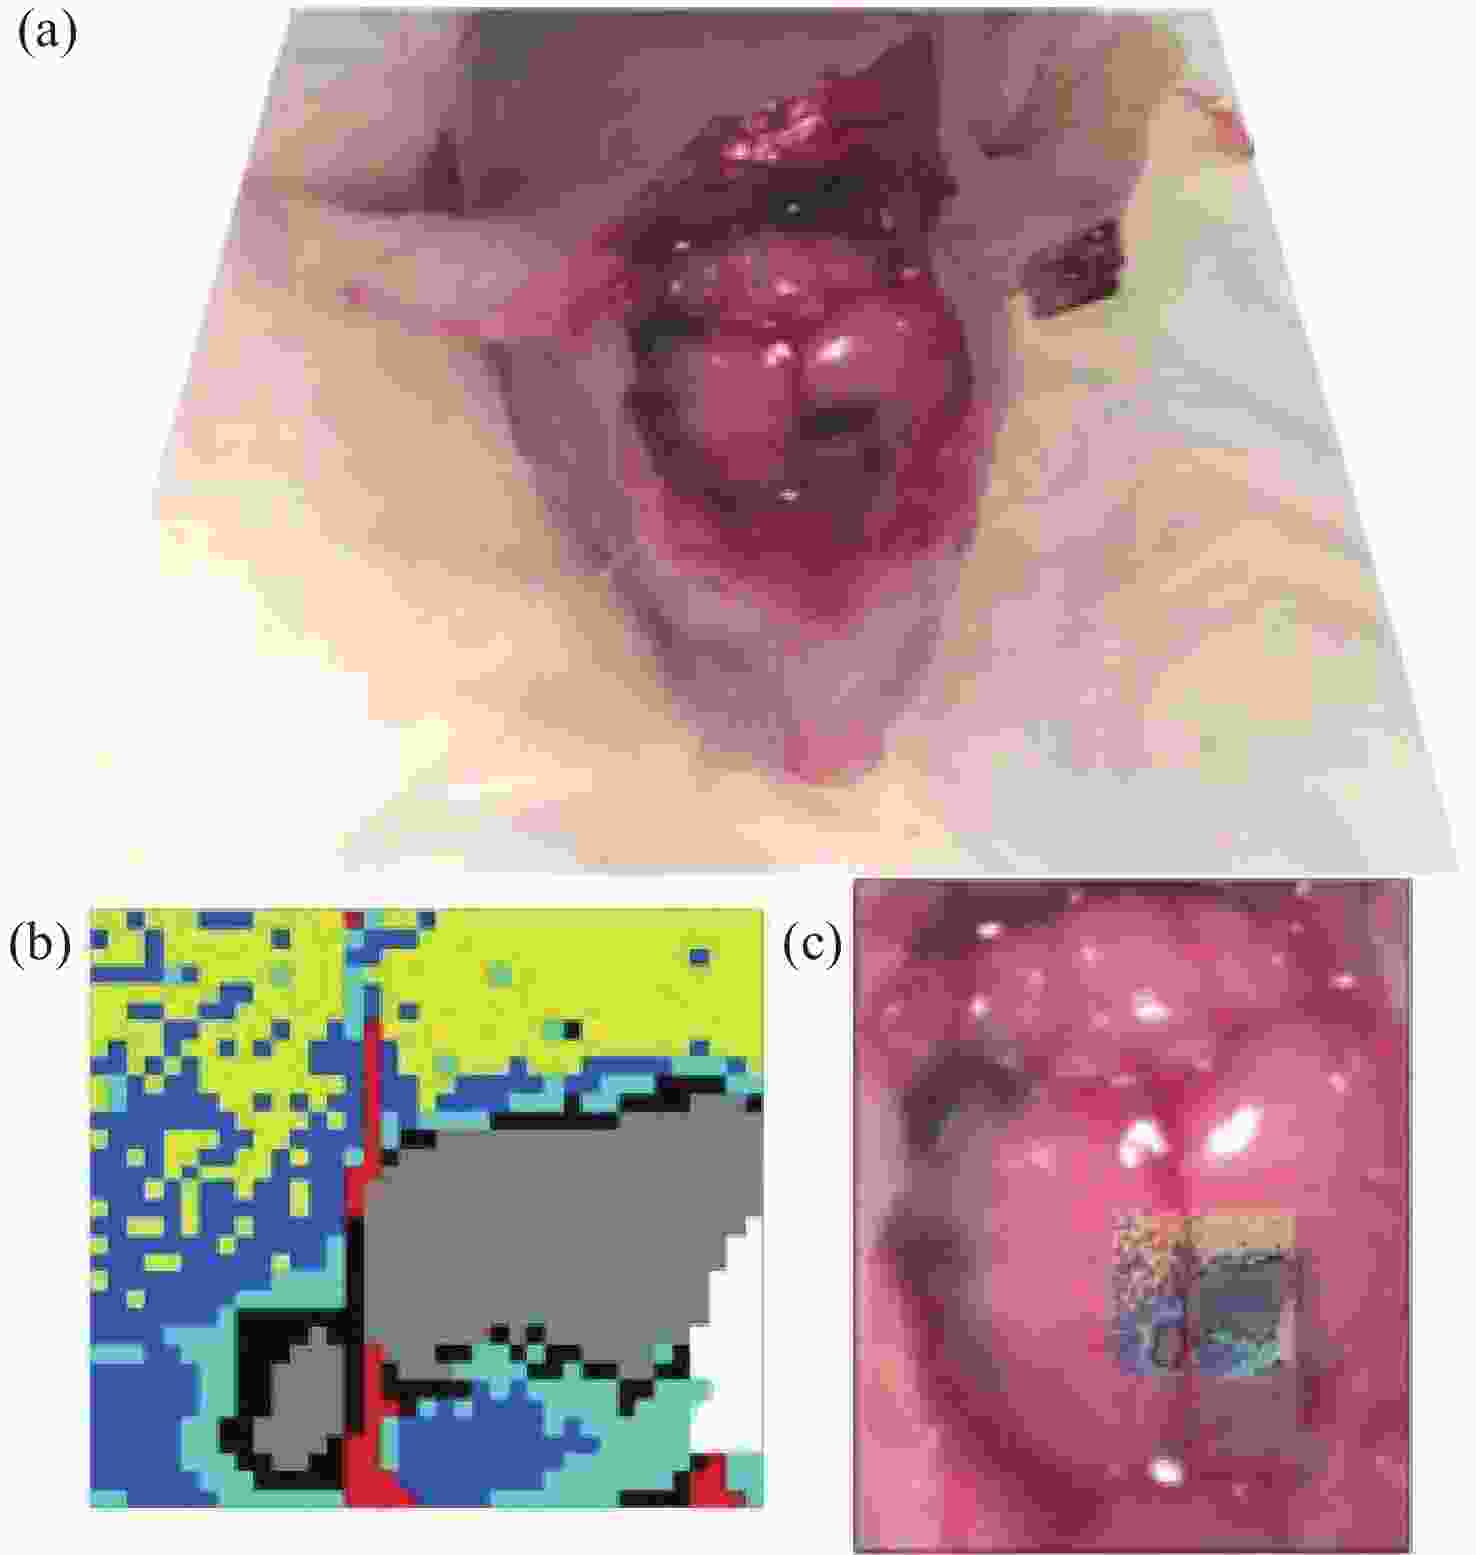
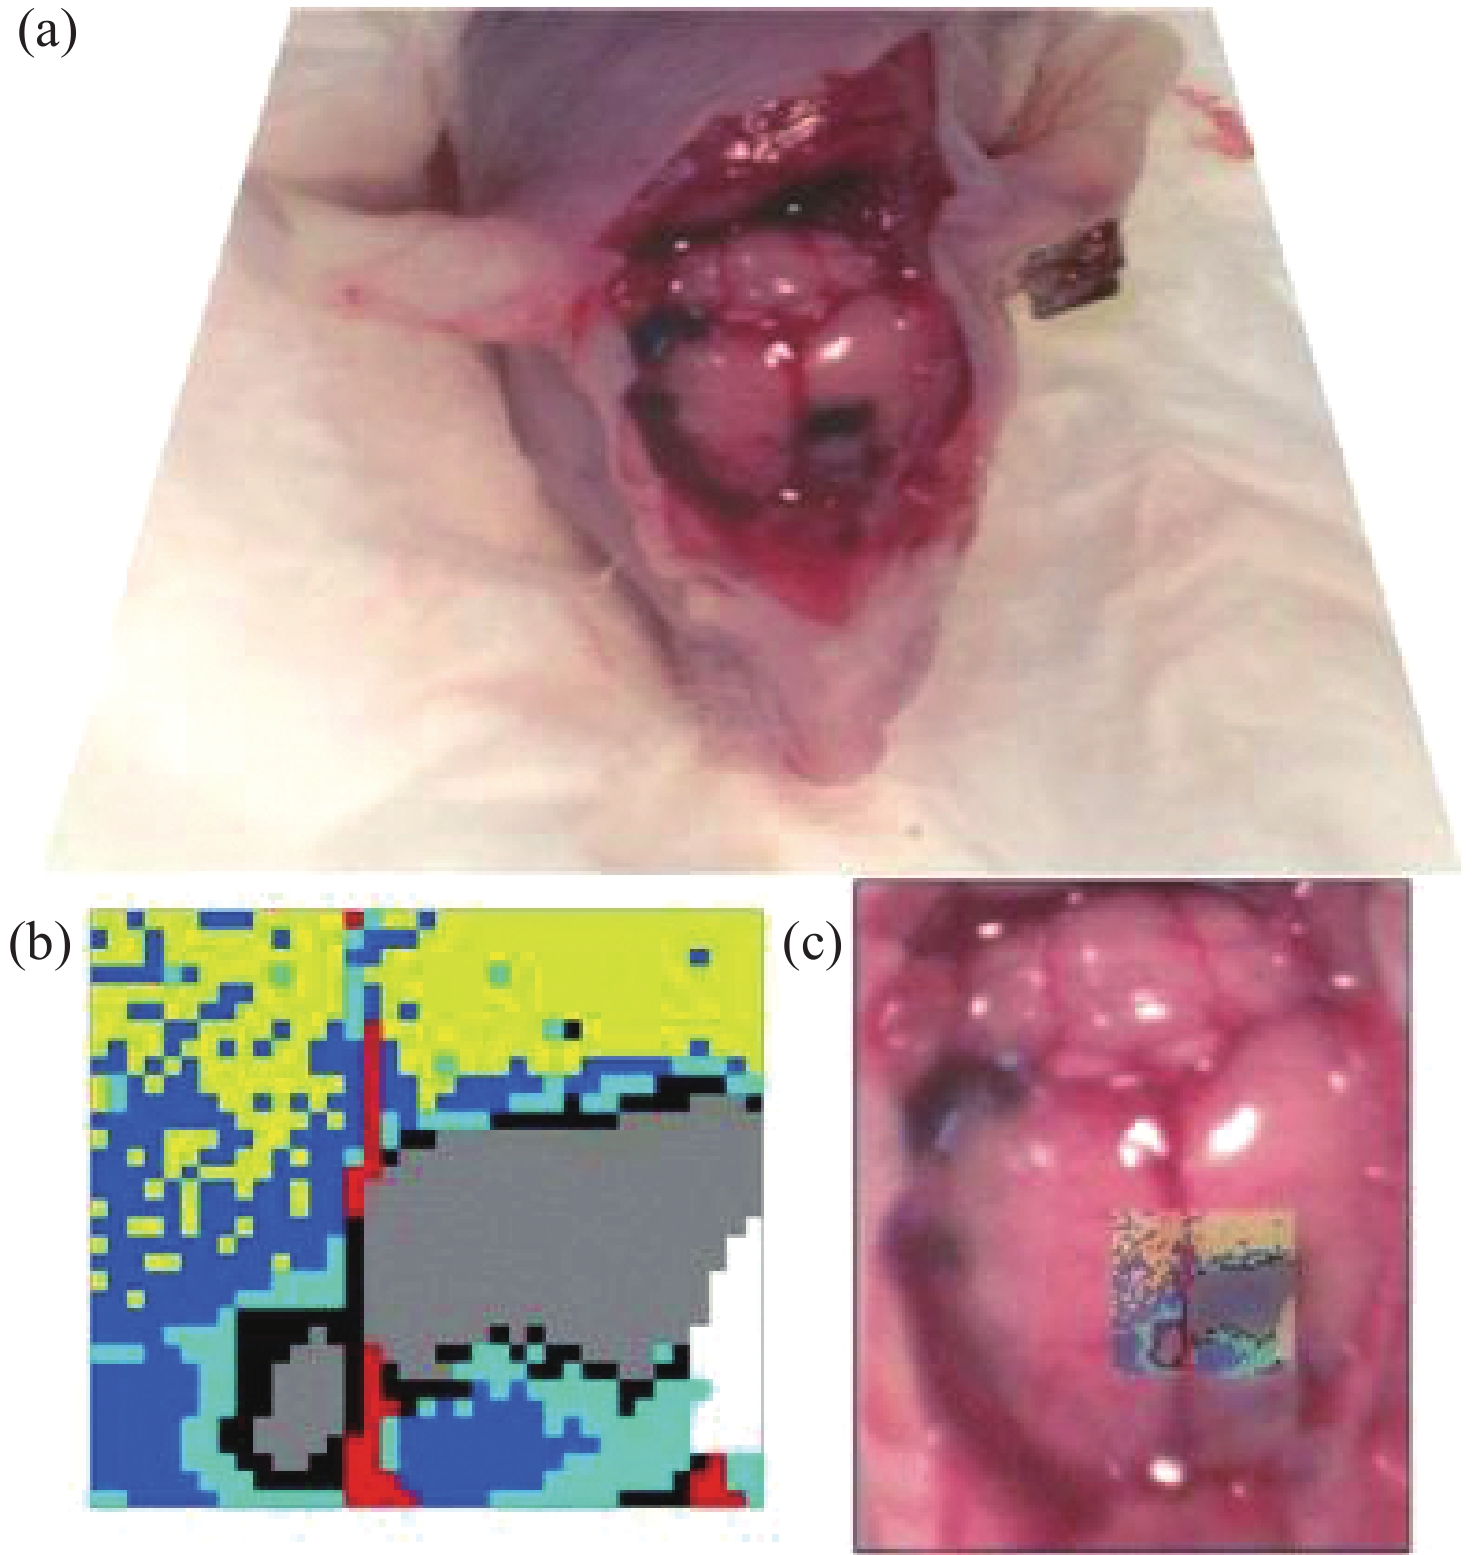
图 7 (a)皮层暴露后小鼠脑组织;(b)通过聚类分割后的Raman图像。其中,蓝色、青色和黄色为正常组织,红色为血管,灰色为肿瘤组织,黑色为肿瘤边缘;(c)组织的显微照片和Raman图像的叠加[42]
Figure 7. (a) Mouse brain tissue with exposed cortex; (b) Raman images are segmented by cluster analysis. Normal brain tissue is depicted in blue, cyan, and yellow, the red is blood vessel, and the tumor and tumor margin are shown in gray and black, respectively; (c) superimposition of the photomicrograph and the Raman image of the tissue[42]
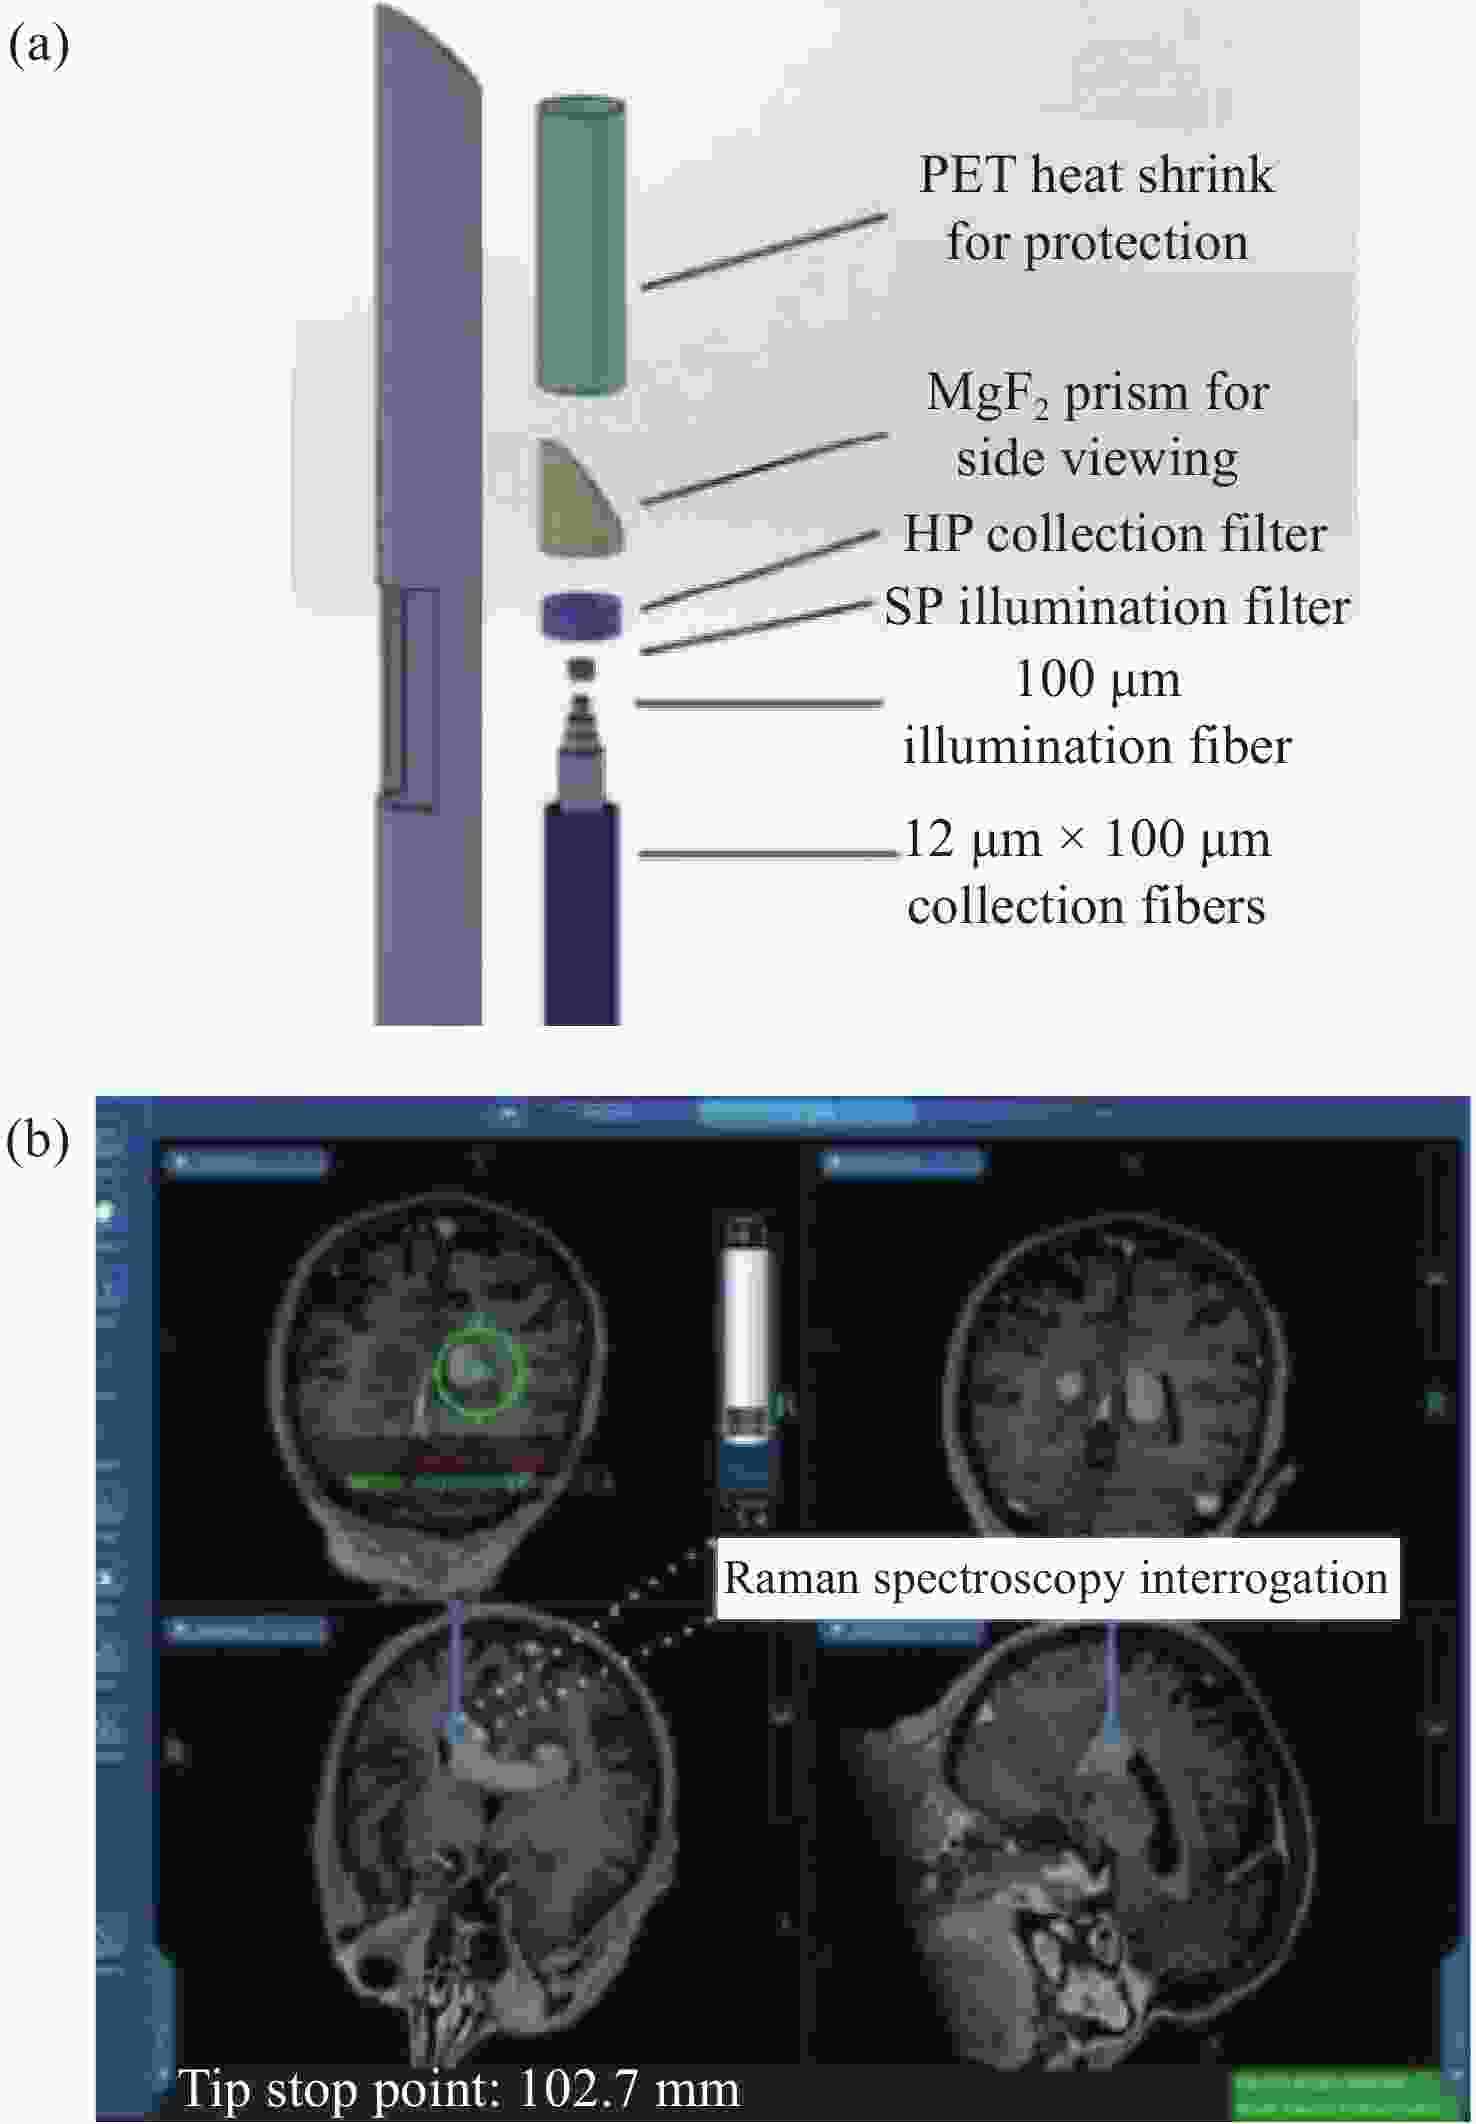
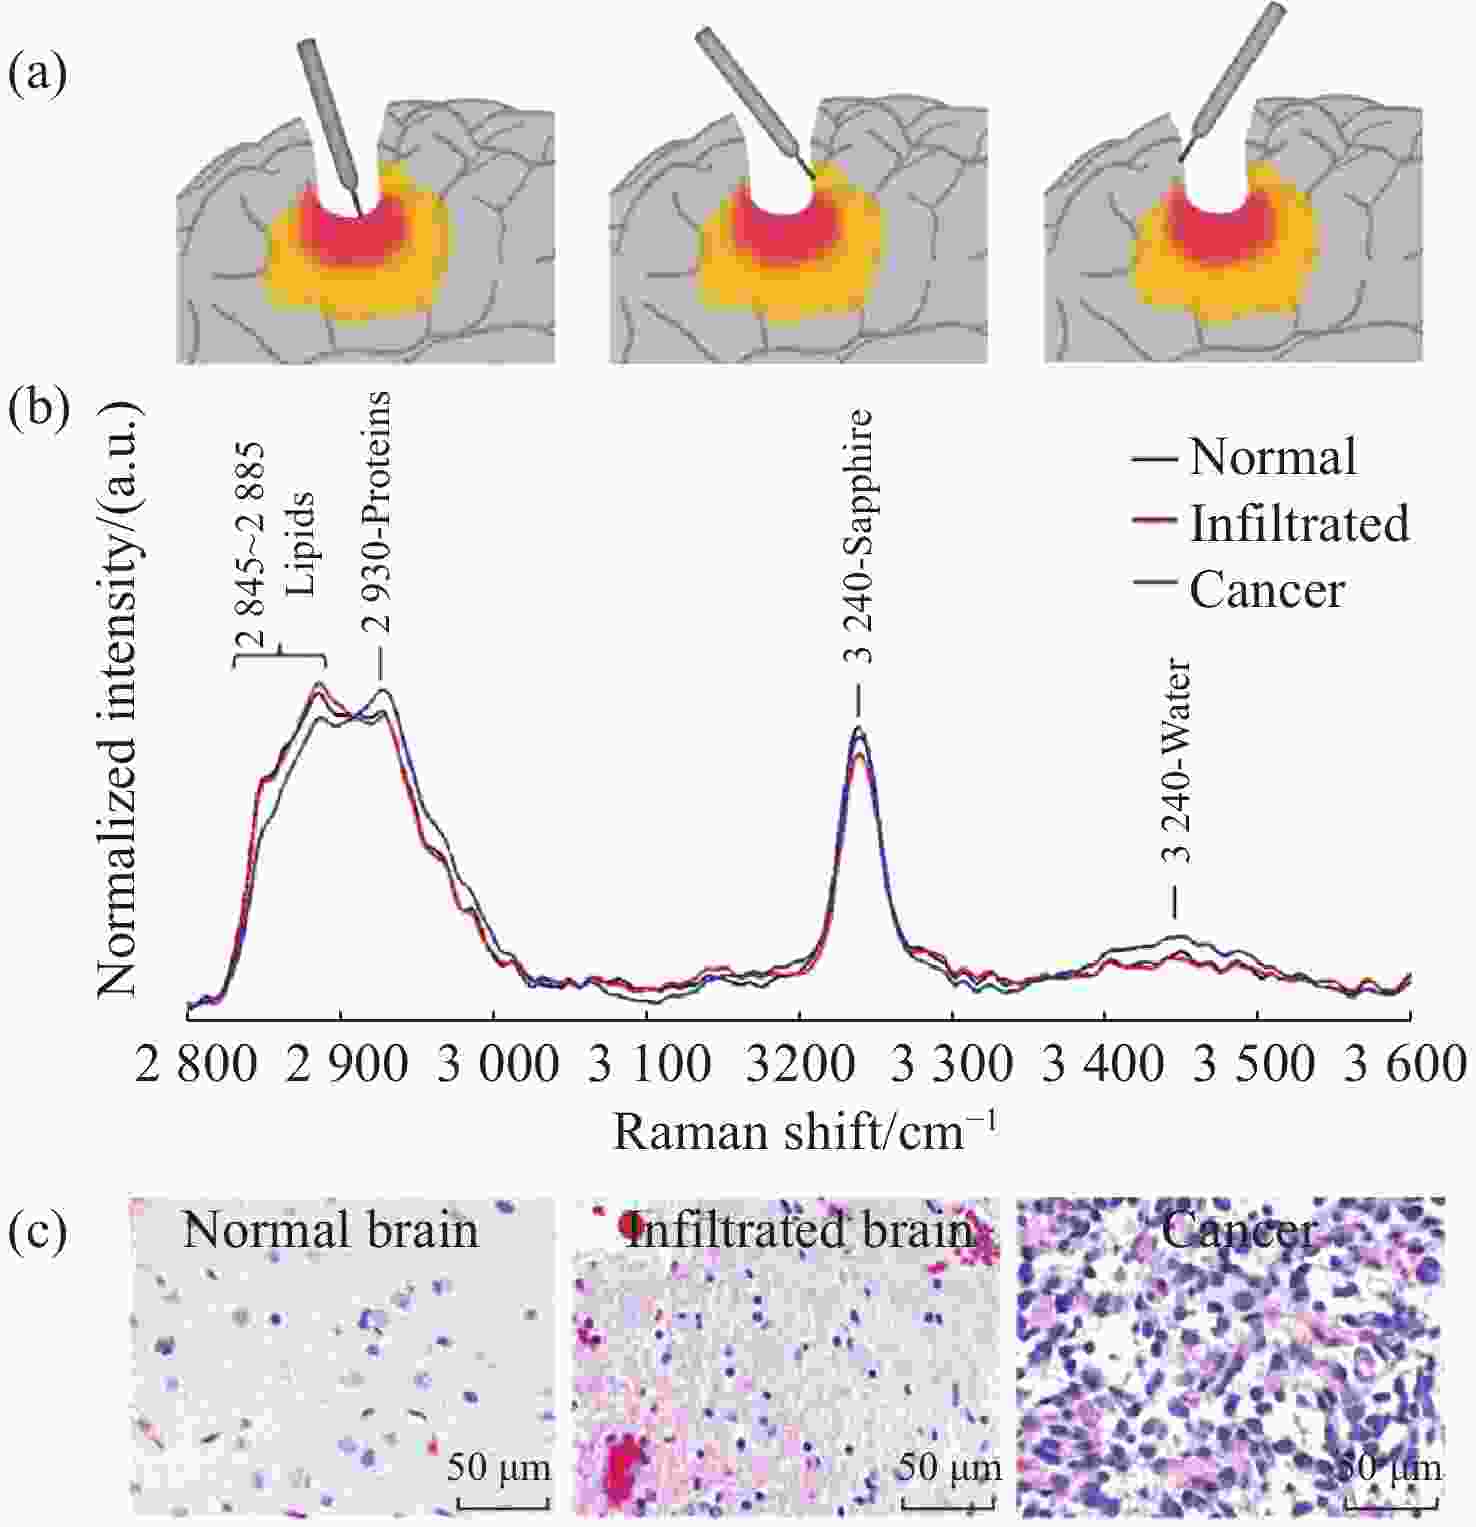
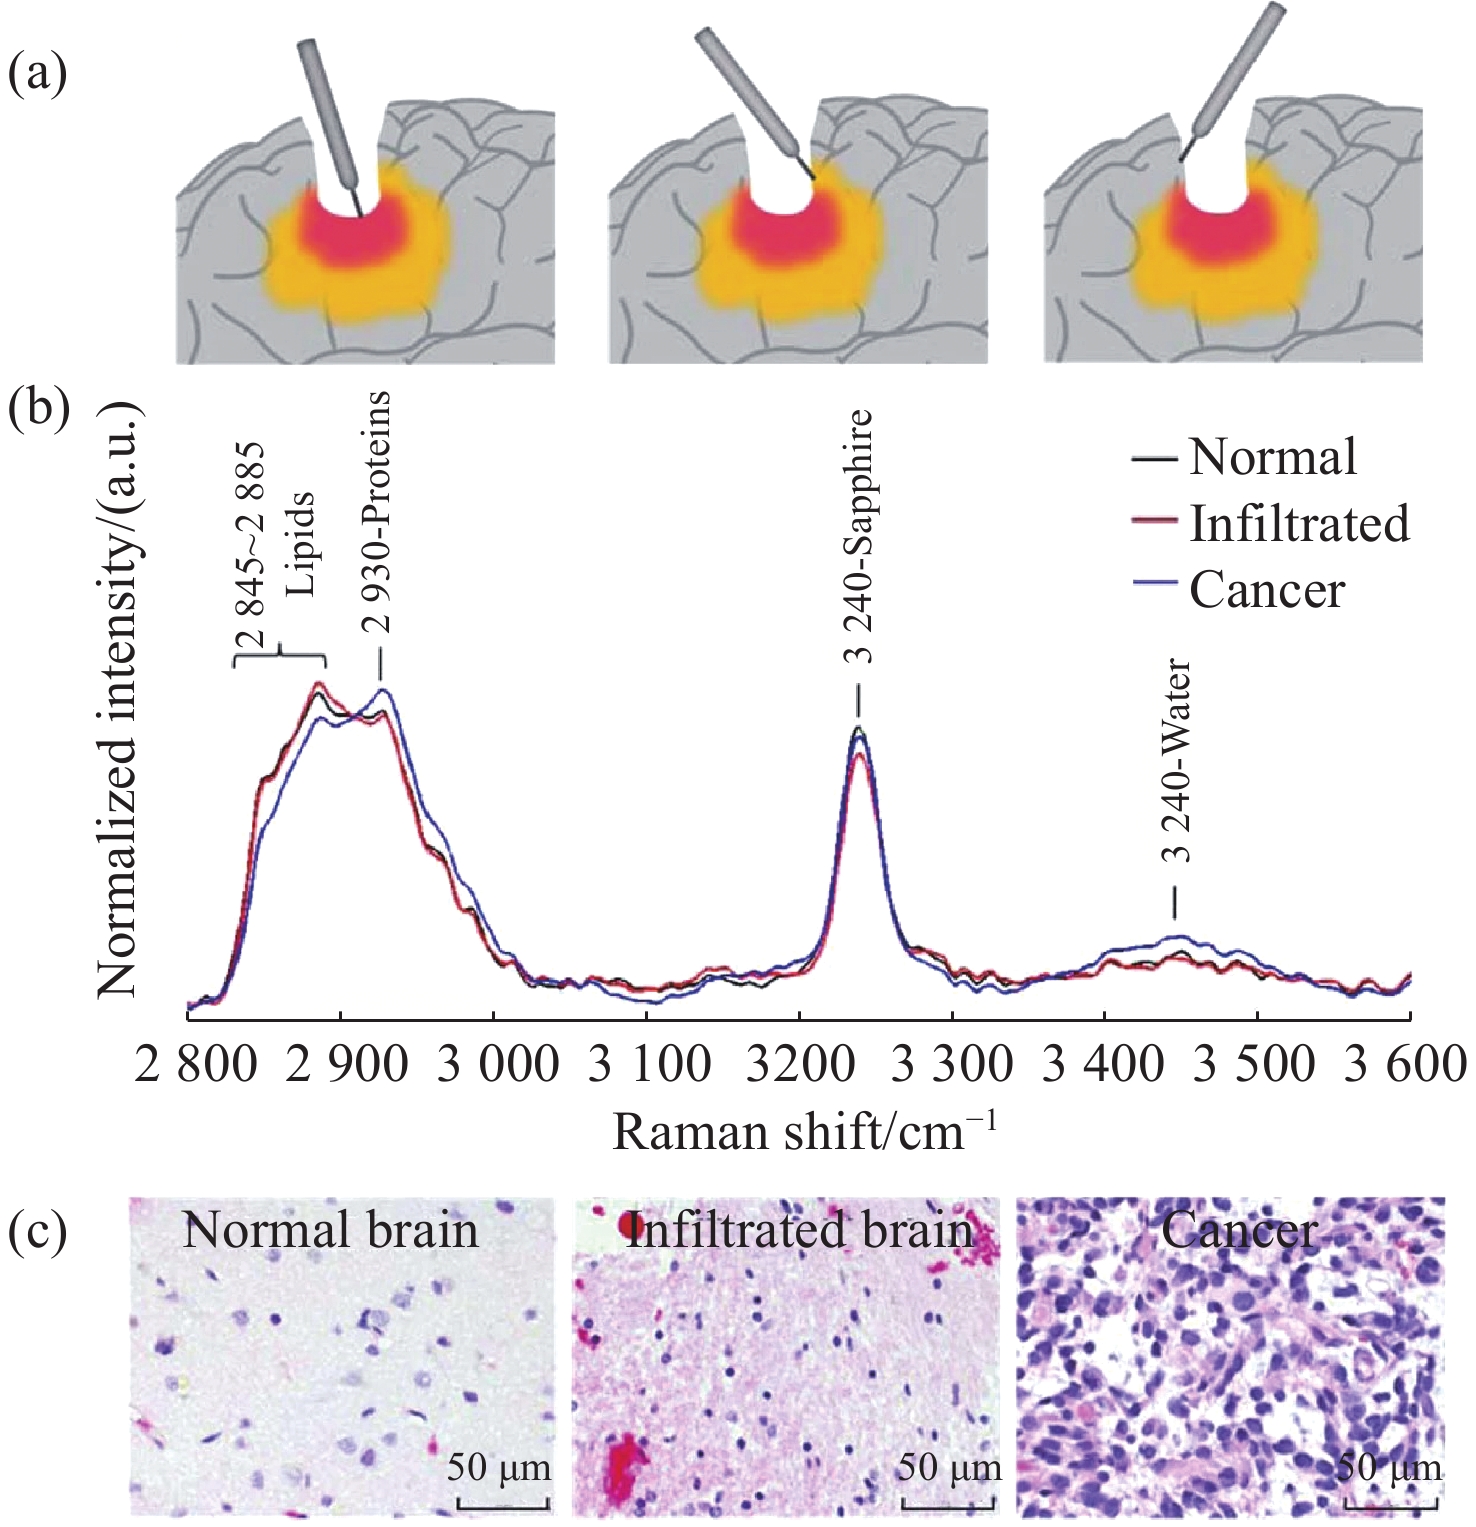
图 10 手持式接触探针在不同组织处的Raman结果。(a)胶质瘤切除术期间,使用手持式接触探针定位致密肿瘤组织(红色)、浸润性组织(黄色)和周围正常组织位置图;(b)在体致密性肿瘤组织、浸润性组织和正常组织的高波数Raman光谱,(c)每种类型组织的H&E染色显微图片[44]
Figure 10. The Raman results of handheld contact probes at different tissue locations. (a) Schematic diagram of in vivo Raman spectral measurements taken in the surgical cavity during glioma resection, using a handheld contact probe to target dense cancerous tissue (red), infiltrated brain tissue (yellow) and surrounding normal brain tissue; (b) In vivo high wavenumber Raman spectra of dense cancer, infiltrated brain and normal brain, averaged over all samples; (c) Representative H&E-stained micrographs for each tissue type[44]
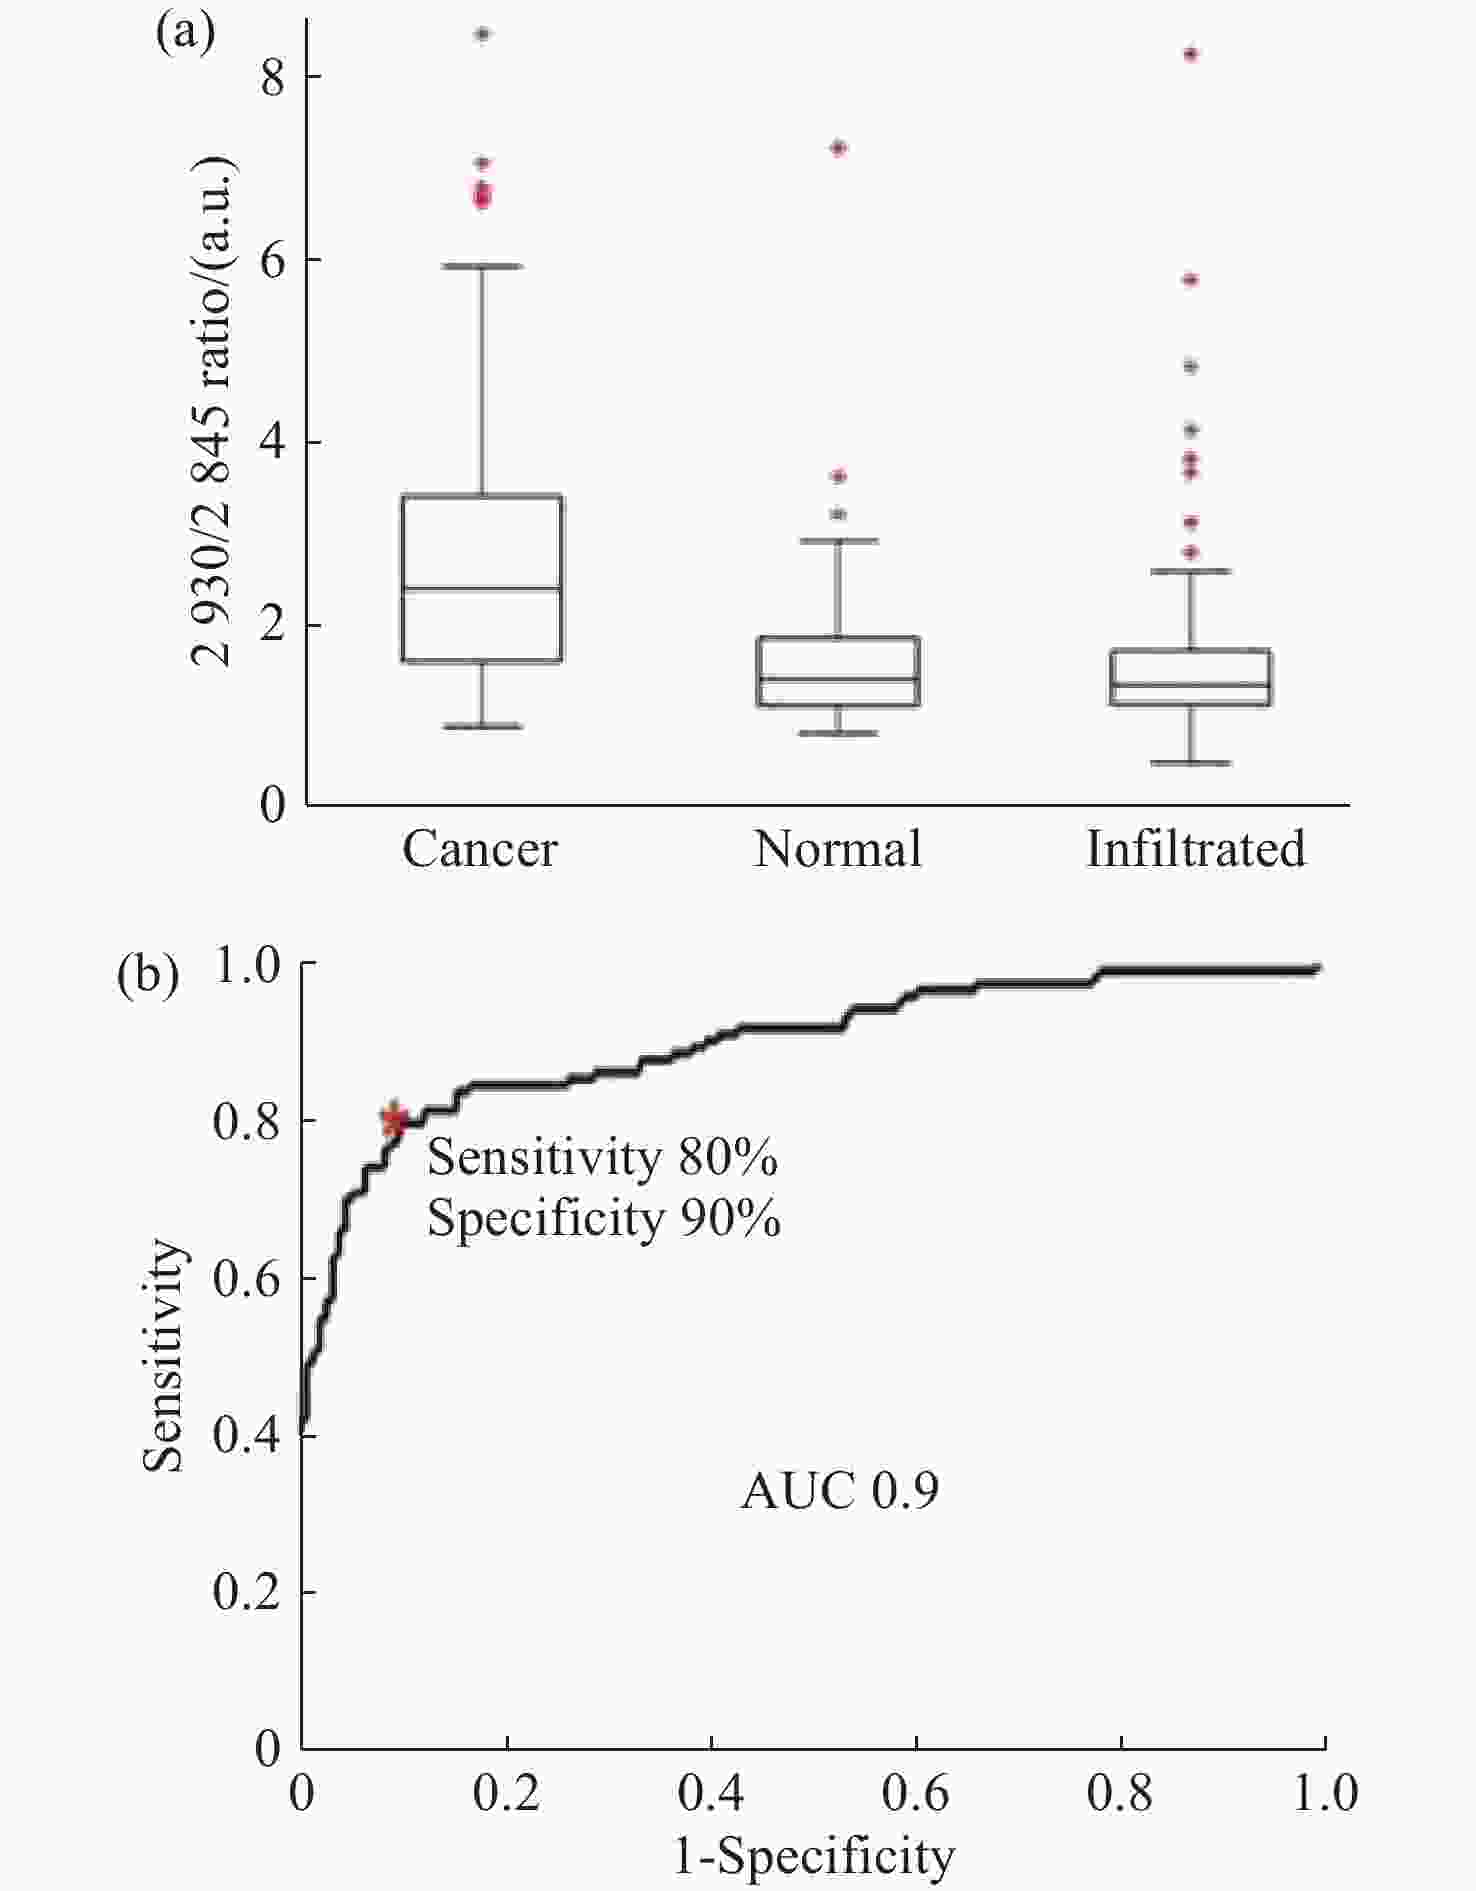
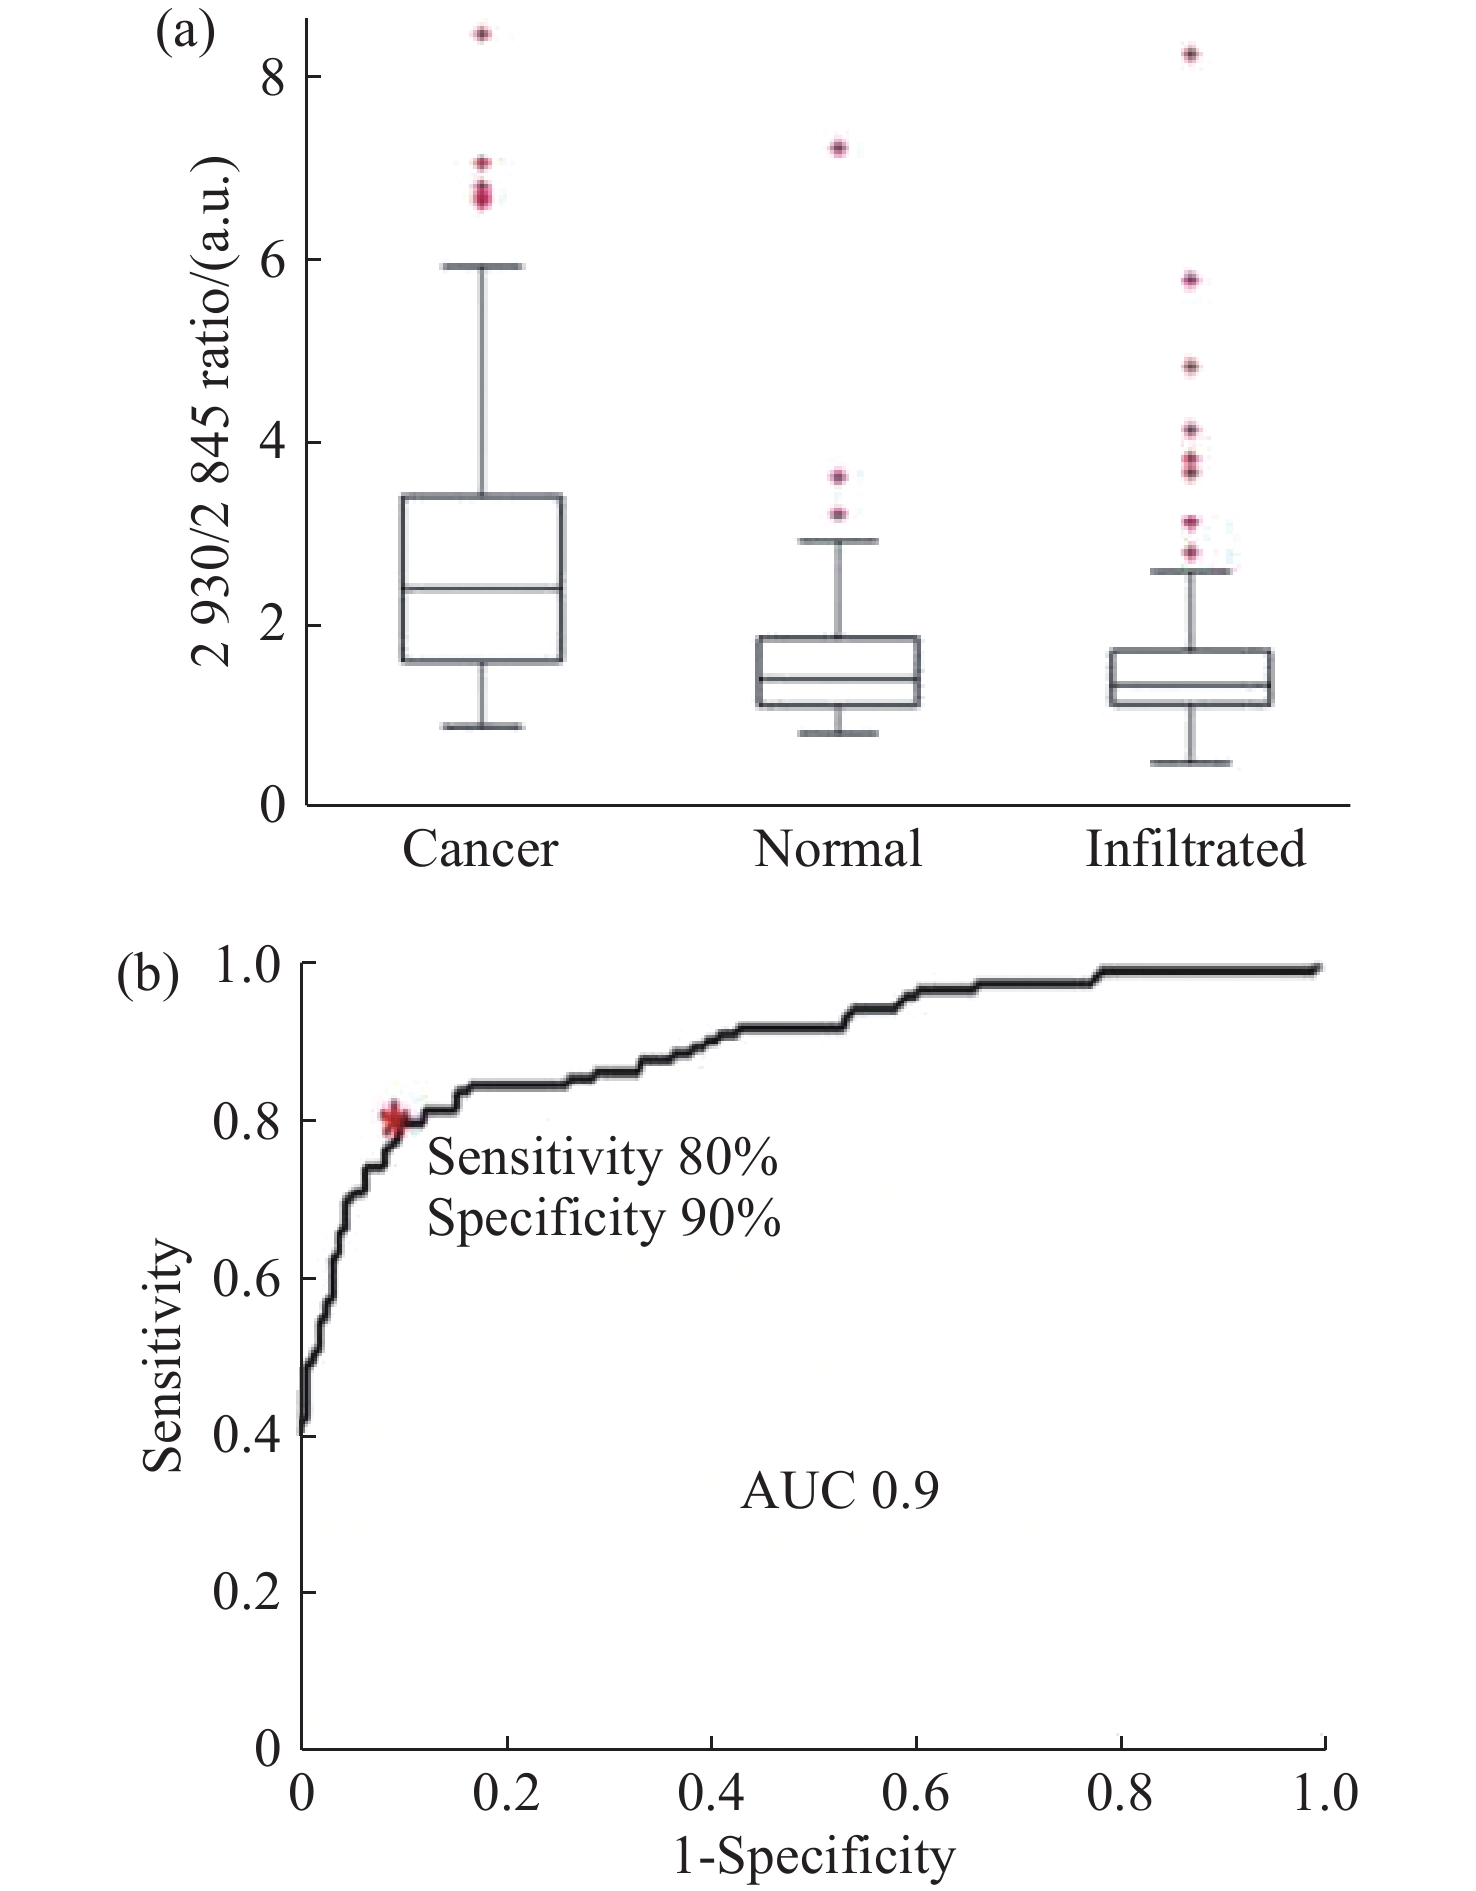
图 11 使用SVM算法对正常组织、浸润组织和致密性肿瘤组织的识别结果。(a)脑胶质瘤患者中,正常脑组织、浸润脑组织和致密型肿瘤脑组织中脂质和蛋白的Raman强度比值(
2930 cm−1∶2845 cm−1)的箱线图;(b)基于SVM算法的受试者特性曲线[44]Figure 11. The identification results of normal brain, infiltrated brain and dense cancer tissue based on SVM algorithm. (a) Boxplots of the Raman intensity ratio of the lipid and protein in the bands of
2930 cm−1:2845 cm−1 for normal brain, infiltrated brain and dense cancer tissue in glioma patients; (b) receiver operating characteristic curve computed by the SVM algorithm[44]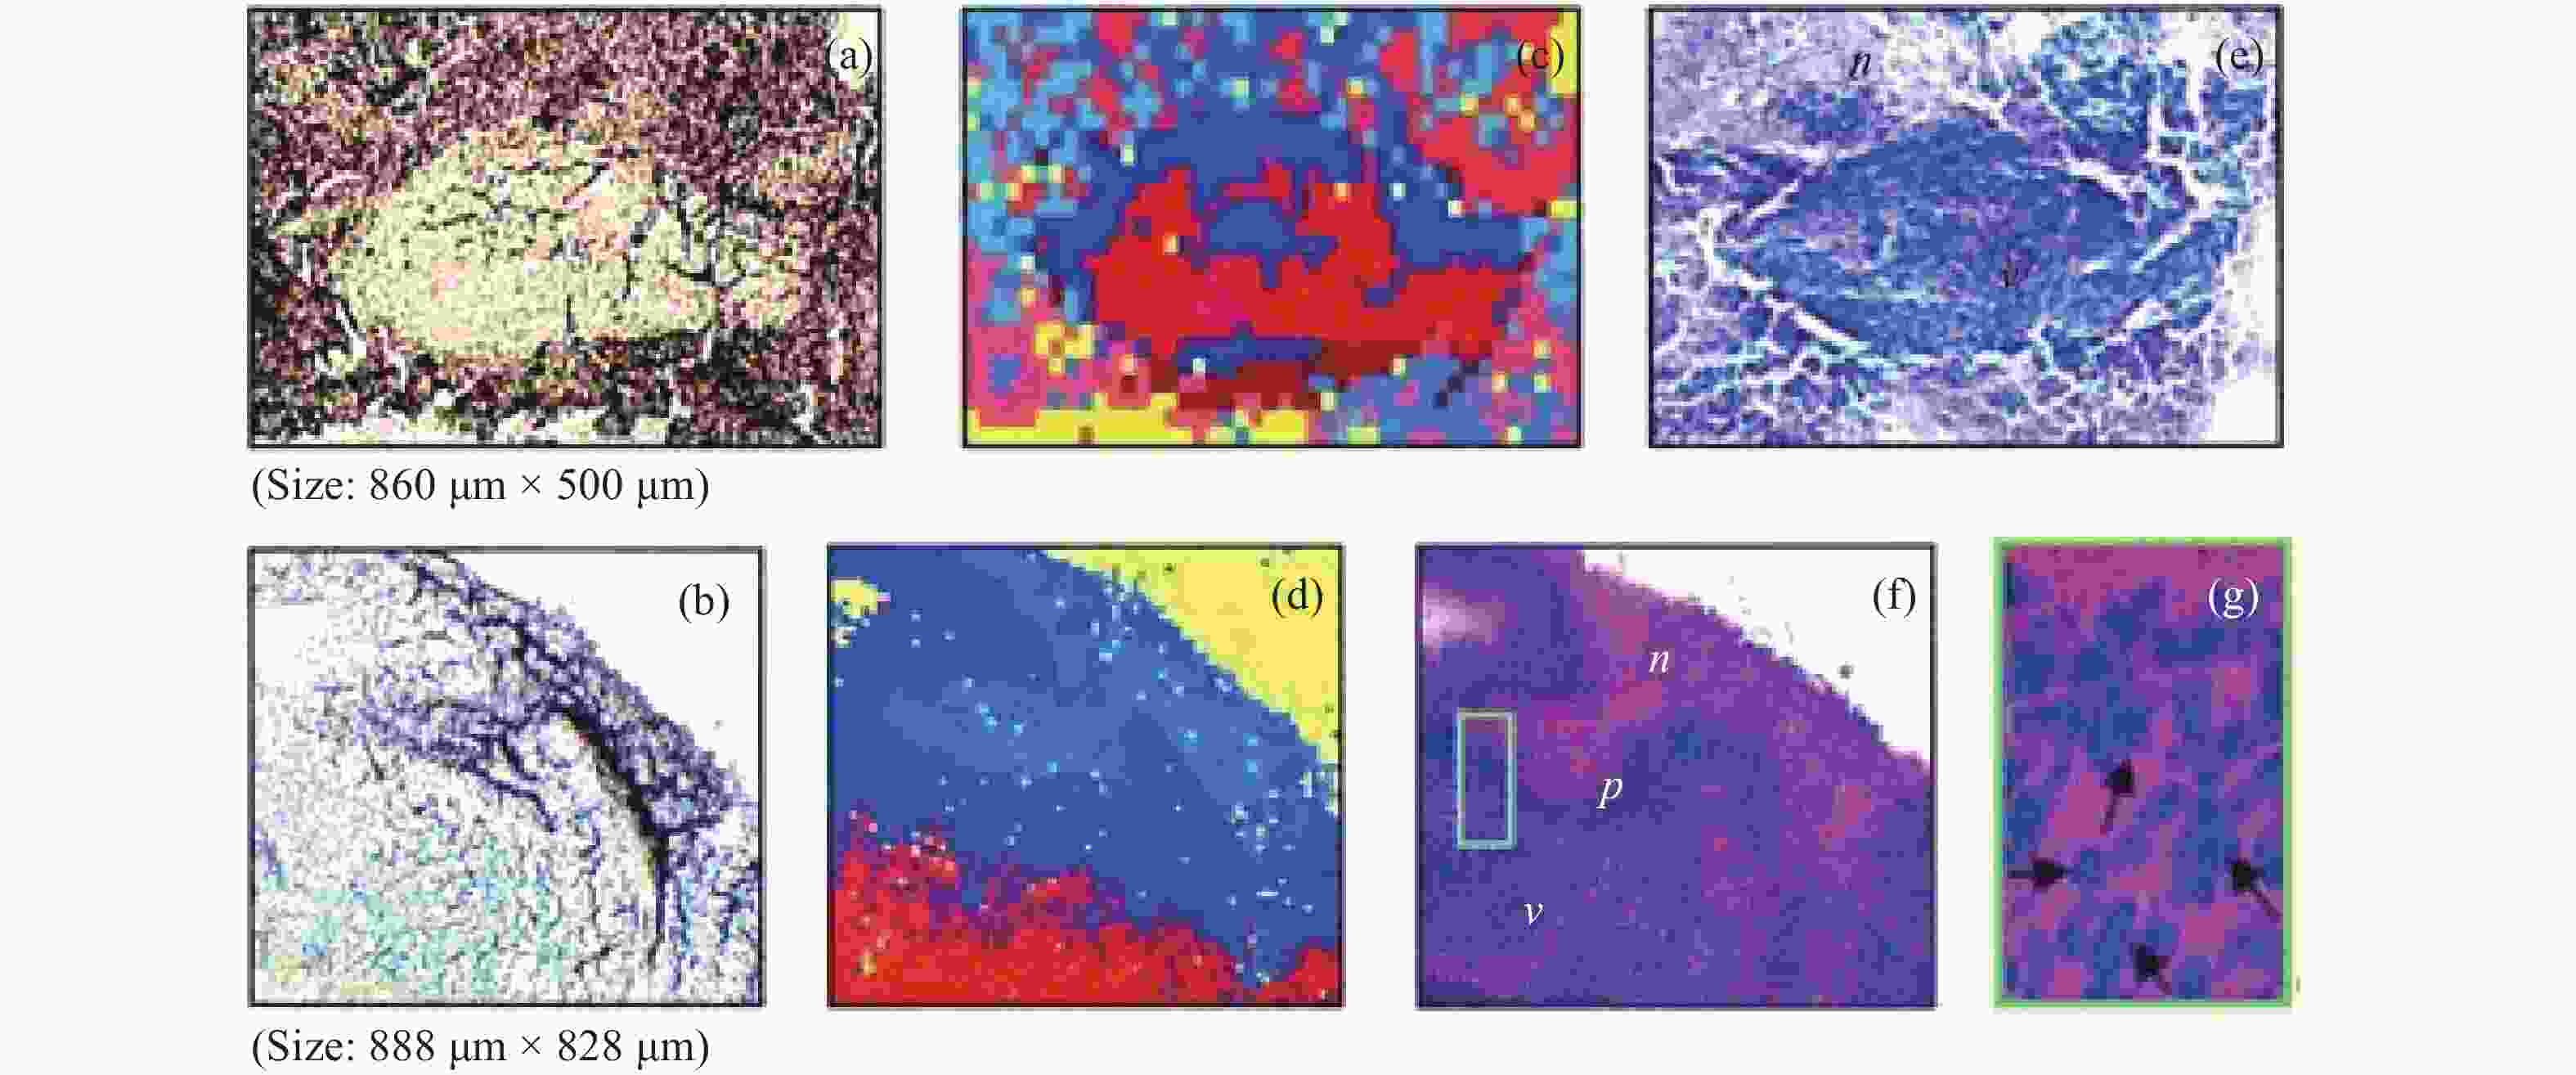
图 2 (a)和(b)为未染色人胶质母细胞瘤冰冻切片在显微镜下的照片;(c)和(d)为Raman光谱绘制的组织切片的伪彩色图(分别对应于(a)和(b))。红色:主要的肿瘤组织区域,蓝色:坏死组织;黄色:未显示区域(边缘冷冻样品);(e)和(f)为H&E染色后照片;(g)为(f)图中绿框处放大后的图片[34]
Figure 2. (a) and (b) are photomicrographs of unstained human glioblastoma cryosections used in Raman mapping experiments; (c) and (d) are pseudo-color maps of Raman spectra of the tissue sections shown in (a) and (b). Red: areas of vital tumor tissue; blue: areas of necrosis; yellow: areas in the scan where no tissue was present (edges, freezing artifacts); (e) and (f) are photomicrographs of the same tissue sections after H&E staining; (g) ×40 magnification of detail marked with a green frame in (f)[34]
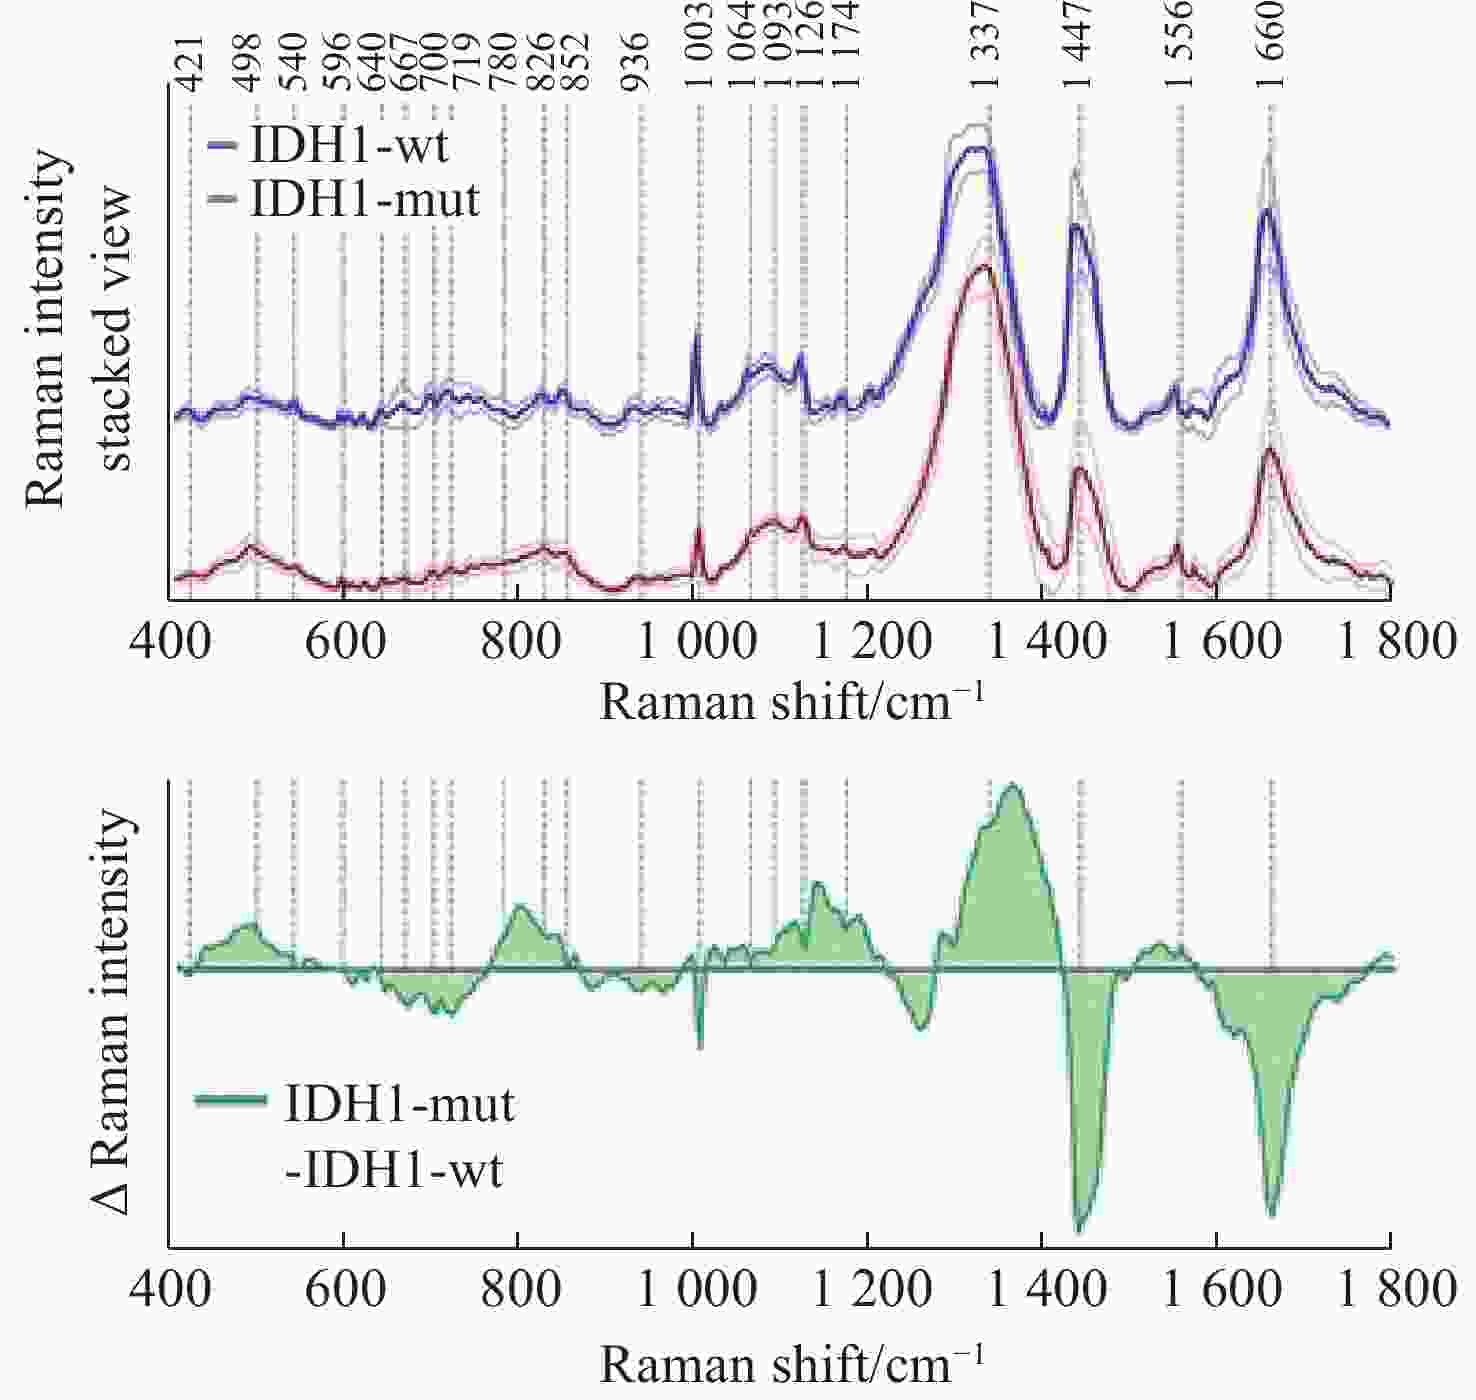
表 1 3种非线性拉曼光谱技术CARS、SRS和SERS的优缺点对比
Table 1. Comparison of advantages and disadvantages of the three nonlinear Raman spectroscopy techniques: CARS, SRS and SERS
拉曼光谱
技术CARS SRS SERS 优点 无标记 无标记、
标准谱克服荧光背景噪声 缺点 易受非共振背景噪声影响、非标准谱、系统复杂 系统复杂、分子选择性强 引入新的金属材料、基底制备工艺复杂  下载: 导出CSV
表 2 不同拉曼光谱技术在脑胶质瘤生物标志物中的应用
Table 2. Application of different Raman spectroscopy techniques in the detection of brain glioma biomarkers
下载: 导出CSV
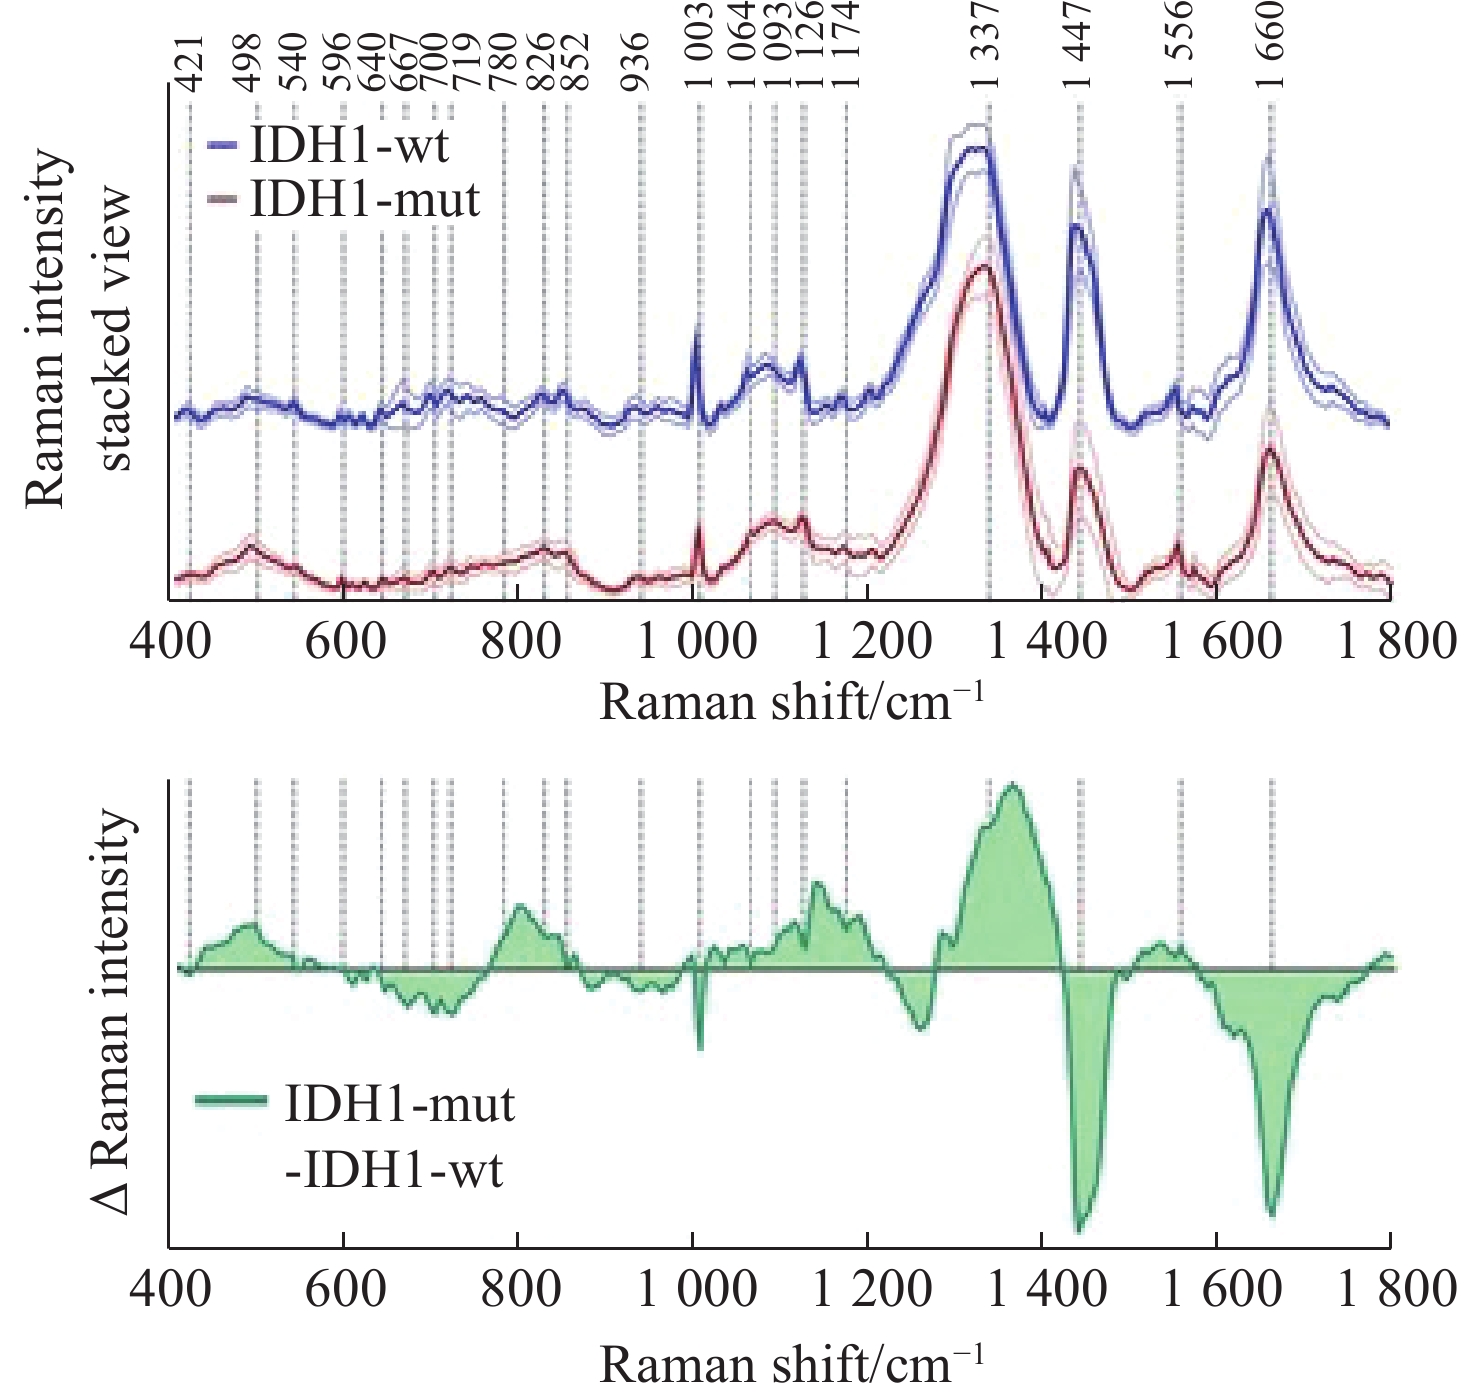
-
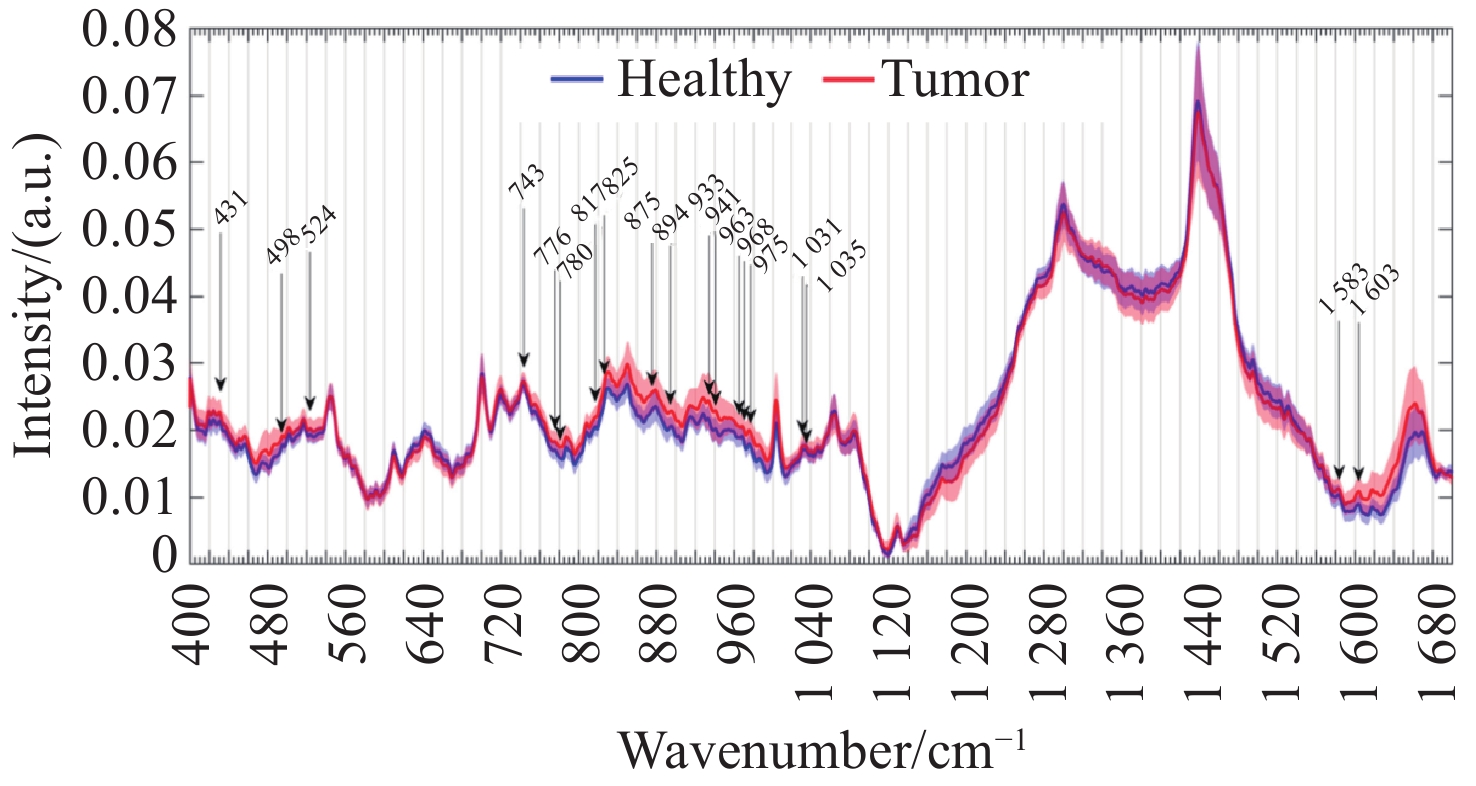
[1] AGUIAR R P, FALCÃO E T, PASQUALUCCI C A, et al. Use of Raman spectroscopy to evaluate the biochemical composition of normal and tumoral human brain tissues for diagnosis[J]. Lasers in Medical Science, 2022, 37(1): 121-133. doi: 10.1007/s10103-020-03173-1 [2] SCHUPPER A J, YONG R L, HADJIPANAYIS C G. The neurosurgeon's armamentarium for gliomas: an update on intraoperative technologies to improve extent of resection[J]. Journal of Clinical Medicine, 2021, 10(2): 236. doi: 10.3390/jcm10020236 [3] GHINDA D C, WU J S, DUNCAN N W, et al. How much is enough-can resting state fMRI provide a demarcation for neurosurgical resection in glioma?[J]. Neuroscience & Biobehavioral Reviews, 2018, 84: 245-261. [4] WU L M, XU D G, WANG Y Y, et al. Study of in vivo brain glioma in a mouse model using continuous-wave terahertz reflection imaging[J]. Biomedical Optics Express, 2019, 10(8): 3953-3962. doi: 10.1364/BOE.10.003953 [5] CHERKASOVA O, PENG Y, KONNIKOVA M, et al. Diagnosis of glioma molecular markers by terahertz technologies[J]. Photonics, 2021, 8(1): 22. doi: 10.3390/photonics8010022 [6] ZHANG Y, YU H Q, LI Y Q, et al. Raman spectroscopy: a prospective intraoperative visualization technique for gliomas[J]. Frontiers in Oncology, 2023, 12: 1086643. doi: 10.3389/fonc.2022.1086643 [7] YOO W S, KIM J H, HAN S M. Multiwavelength Raman characterization of silicon stress near through-silicon vias and its inline monitoring applications[J]. Journal of Micro/Nanolithography, MEMS, and MOEMS, 2014, 13(1): 011205. doi: 10.1117/1.JMM.13.1.011205 [8] SEKAR S K V, MOSCA S, FARINA A, et al. Frequency offset Raman spectroscopy (FORS) for depth probing of diffusive media[J]. Optics Express, 2017, 25(5): 4585-4597. doi: 10.1364/OE.25.004585 [9] PUPPELS G J, DE MUL F F M, OTTO C, et al. Studying single living cells and chromosomes by confocal Raman microspectroscopy[J]. Nature, 1990, 347(6290): 301-303. doi: 10.1038/347301a0 [10] CUI S SH, ZHANG SH, YUE SH H. Raman spectroscopy and imaging for cancer diagnosis[J]. Journal of Healthcare Engineering, 2018, 2018: 8619342. [11] RAUWEL E, AL-ARAG S, SALEHI H, et al. Assessing cobalt metal nanoparticles uptake by cancer cells using live Raman spectroscopy[J]. International Journal of Nanomedicine, 2020, 15: 7051-7062. doi: 10.2147/IJN.S258060 [12] ROBERT B. Resonance Raman spectroscopy[J]. Photosynthesis Research, 2009, 101(2-3): 147-155. doi: 10.1007/s11120-009-9440-4 [13] HOWARD W F, NELSON W H, SPERRY J F. A resonance Raman method for the rapid detection and identification of bacteria in water[J]. Applied Spectroscopy, 1980, 34(1): 72-75. doi: 10.1366/0003702804730790 [14] HAN Y K, QIANG L, GAO Y K, et al. Large-area surface-enhanced Raman spectroscopy substrate by hybrid porous GaN with Au/Ag for breast cancer miRNA detection[J]. Applied Surface Science, 2021, 541: 148456. doi: 10.1016/j.apsusc.2020.148456 [15] ZHANG J, DONG Y H, ZHU W F, et al. Ultrasensitive detection of circulating tumor DNA of lung cancer via an enzymatically amplified SERS-based frequency shift assay[J]. ACS Applied Materials & Interfaces, 2019, 11(20): 18145-18152. [16] ANDREI C C, MORAILLON A, LARQUET E, et al. SERS characterization of aggregated and isolated bacteria deposited on silver-based substrates[J]. Analytical and Bioanalytical Chemistry, 2021, 413(5): 1417-1428. doi: 10.1007/s00216-020-03106-5 [17] CHEN H, DAS A, BI L Y, et al. Recent advances in surface-enhanced Raman scattering-based microdevices for point-of-care diagnosis of viruses and bacteria[J]. Nanoscale, 2020, 12(42): 21560-21570. doi: 10.1039/D0NR06340A [18] JAWORSKA A, FORNASARO S, SERGO V, et al. Potential of surface enhanced Raman spectroscopy (SERS) in therapeutic drug monitoring (TDM). A critical review[J]. Biosensors, 2016, 6(3): 47. doi: 10.3390/bios6030047 [19] HUNTER R, SOHI A N, KHATOON Z, et al. Optofluidic label-free SERS platform for rapid bacteria detection in serum[J]. Sensors and Actuators B: Chemical, 2019, 300: 126907. doi: 10.1016/j.snb.2019.126907 [20] ZHANG B Y, YIN P J, HU Y H, et al. Highly accurate and label-free discrimination of single cancer cell using a plasmonic oxide-based nanoprobe[J]. Biosensors and Bioelectronics, 2022, 198: 113814. doi: 10.1016/j.bios.2021.113814 [21] DEY P, VAIDEANU A, MOSCA S, et al. Surface enhanced deep Raman detection of cancer tumour through 71 mm of heterogeneous tissue[J]. Nanotheranostics, 2022, 6(3): 337-349. doi: 10.7150/ntno.71510 [22] POTMA E O, DE BOEIJ W P, VAN HAASTERT P J M, et al. Real-time visualization of intracellular hydrodynamics in single living cells[J]. Proceedings of the National Academy of Sciences of the United States of America, 2001, 98(4): 1577-1582. [23] STEUWE C, PATEL I I, UL-HASAN M, et al. CARS based label-free assay for assessment of drugs by monitoring lipid droplets in tumour cells[J]. Journal of Biophotonics, 2014, 7(11-12): 906-913. doi: 10.1002/jbio.201300110 [24] WANG H W, LANGOHR I M, STUREK M, et al. Imaging and quantitative analysis of atherosclerotic lesions by CARS-based multimodal nonlinear optical microscopy[J]. Arteriosclerosis, Thrombosis, and Vascular Biology, 2009, 29(9): 1342-1348. doi: 10.1161/ATVBAHA.109.189316 [25] KISS N, KROLOPP Á, LŐRINCZ K, et al. Stain-free histopathology of basal cell carcinoma by dual vibration resonance frequency CARS microscopy[J]. Pathology & Oncology Research, 2018, 24(4): 927-930. [26] WEI L, YU Y, SHEN Y H, et al. Vibrational imaging of newly synthesized proteins in live cells by stimulated Raman scattering microscopy[J]. Proceedings of the National Academy of Sciences of the United States of America, 2013, 110(28): 11226-11231. [27] OZEKI Y, UMEMURA W, OTSUKA Y, et al. High-speed molecular spectral imaging of tissue with stimulated Raman scattering[J]. Nature Photonics, 2012, 6(12): 845-851. doi: 10.1038/nphoton.2012.263 [28] SAAR B G, FREUDIGER C W, REICHMAN J, et al. Video-rate molecular imaging in vivo with stimulated Raman scattering[J]. Science, 2010, 330(6009): 1368-1370. doi: 10.1126/science.1197236 [29] FU D, LU F K, ZHANG X, et al. Quantitative chemical imaging with multiplex stimulated Raman scattering microscopy[J]. Journal of the American Chemical Society, 2012, 134(8): 3623-3626. doi: 10.1021/ja210081h [30] ZHANG R R, KUO J S. Detection of human brain tumor infiltration with quantitative stimulated Raman scattering microscopy[J]. Neurosurgery, 2016, 78(4): N9-N11. [31] LU F K, CALLIGARIS D, OLUBIYI O I, et al. Label-free neurosurgical pathology with stimulated Raman imaging[J]. Cancer Research, 2016, 76(12): 3451-3462. doi: 10.1158/0008-5472.CAN-16-0270 [32] REINECKE D, VON SPRECKELSEN N, MAWRIN C, et al. Novel rapid intraoperative qualitative tumor detection by a residual convolutional neural network using label-free stimulated Raman scattering microscopy[J]. Acta Neuropathologica Communications, 2022, 10(1): 109. doi: 10.1186/s40478-022-01411-x [33] TASHIBU K. Analysis of water content in rat brain using Raman spectroscopy[J]. No To Shinkei, 1990, 42(10): 999-1004. [34] KOLJENOVIĆ S, CHOO-SMITH L P, SCHUT T C B, et al. Discriminating vital tumor from necrotic tissue in human glioblastoma tissue samples by Raman spectroscopy[J]. Laboratory Investigation, 2002, 82(10): 1265-1277. doi: 10.1097/01.LAB.0000032545.96931.B8 [35] 付荣荣, 鲍甜恬, 田永胜, 等. 基于子成分分解的脑电信号去噪方法比较研究[J]. 计量学报,2019,40(4):708-713. doi: 10.3969/j.issn.1000-1158.2019.04.27FU R R, BAO T T, TIAN Y SH, et al. Comparative study on denoising methods of EEG signals based on subcomponent decomposition[J]. Acta Metrologica Sinica, 2019, 40(4): 708-713. (in Chinese). doi: 10.3969/j.issn.1000-1158.2019.04.27 [36] KAST R E, AUNER G W, ROSENBLUM M L, et al. Raman molecular imaging of brain frozen tissue sections[J]. Journal of Neuro-Oncology, 2014, 120(1): 55-62. doi: 10.1007/s11060-014-1536-9 [37] LOUIS D N, OHGAKI H, WIESTLER O D, et al. The 2007 WHO classification of tumours of the central nervous system[J]. Acta Neuropathologica, 2007, 114(2): 97-109. doi: 10.1007/s00401-007-0243-4 [38] BELEITES C, GEIGER K, KIRSCH M, et al. Raman spectroscopic grading of astrocytoma tissues: using soft reference information[J]. Analytical and Bioanalytical Chemistry, 2011, 400(9): 2801-2816. doi: 10.1007/s00216-011-4985-4 [39] UCKERMANN O, YAO W M, JURATLI T A, et al. IDH1 mutation in human glioma induces chemical alterations that are amenable to optical Raman spectroscopy[J]. Journal of Neuro-Oncology, 2018, 139(2): 261-268. [40] RIVA M, SCIORTINO T, SECOLI R, et al. Glioma biopsies classification using Raman spectroscopy and machine learning models on fresh tissue samples[J]. Cancers, 2021, 13(5): 1073. doi: 10.3390/cancers13051073 [41] UPRETI K, VERMA M, AGRAWAL M, et al. Prediction of mechanical strength by using an artificial neural network and random forest algorithm[J]. Journal of Nanomaterials, 2022, 2022: 7791582. [42] KIRSCH M, SCHACKERT G, SALZER R, et al. Raman spectroscopic imaging for in vivo detection of cerebral brain metastases[J]. Analytical and Bioanalytical Chemistry, 2010, 398(4): 1707-1713. doi: 10.1007/s00216-010-4116-7 [43] JERMYN M, MOK K, MERCIER J, et al. Intraoperative brain cancer detection with Raman spectroscopy in humans[J]. Science Translational Medicine, 2015, 7(274): 274ra19. [44] JERMYN M, DESROCHES J, MERCIER J, et al. Raman spectroscopy detects distant invasive brain cancer cells centimeters beyond MRI capability in humans[J]. Biomedical Optics Express, 2016, 7(12): 5129-5137. doi: 10.1364/BOE.7.005129 [45] DESROCHES J, LEMOINE É, PINTO M, et al. Development and first in-human use of a Raman spectroscopy guidance system integrated with a brain biopsy needle[J]. Journal of Biophotonics, 2019, 12(3): e201800396. [46] DESROCHES J, JERMY M, PINTO M, et al. A new method using Raman spectroscopy for in vivo targeted brain cancer tissue biopsy[J]. Scientific Reports, 2018, 8: 1792. doi: 10.1002/jbio.201800396 [47] ZHOU Y, LIU CH H, WU B L, et al. Optical biopsy identification and grading of gliomas using label-free visible resonance Raman spectroscopy[J]. Journal of Biomedical Optics, 2019, 24(9): 095001. [48] EVANS C L, XU X Y, KESARI S, et al. Chemically-selective imaging of brain structures with CARS microscopy[J]. Optics Express, 2007, 15(19): 12076-12087. doi: 10.1364/OE.15.012076 [49] CAMP C H JR, LEE Y J, HEDDLESTON J M, et al. High-speed coherent Raman fingerprint imaging of biological tissues[J]. Nature Photonics, 2014, 8(8): 627-634. doi: 10.1038/nphoton.2014.145 [50] FREUDIGER C W, MIN W, SAAR B G, et al. Label-free biomedical imaging with high sensitivity by stimulated Raman scattering microscopy[J]. Science, 2008, 322(5909): 1857-1861. doi: 10.1126/science.1165758 [51] JI M B, LEWIS S, CAMELO-PIRAGUA S, et al. Detection of human brain tumor infiltration with quantitative stimulated Raman scattering microscopy[J]. Science Translational Medicine, 2015, 7(309): 309ra163. [52] LI J W, WANG CH D, YAO Y, et al. Label-free discrimination of glioma brain tumors in different stages by surface enhanced Raman scattering[J]. Talanta, 2020, 216: 120983. doi: 10.1016/j.talanta.2020.120983 [53] TANAHASHI K, NATSUME A, OHKA F, et al. Assessment of tumor cells in a mouse model of diffuse infiltrative glioma by Raman spectroscopy[J]. BioMed research international, 2014, 2014: 860241. [54] BARKUR S, BANKAPUR A, PRADHAN M, et al. Probing differentiation in cancer cell lines by single-cell micro-Raman spectroscopy[J]. Journal of Biomedical Optics, 2015, 20(8): 085001. doi: 10.1117/1.JBO.20.8.085001 [55] ITURRIOZ-RODRÍGUEZ N, DE PASQUALE D, FIASCHI P, et al. Discrimination of glioma patient-derived cells from healthy astrocytes by exploiting Raman spectroscopy[J]. Spectrochimica Acta Part A: Molecular and Biomolecular Spectroscopy, 2022, 269: 120773. doi: 10.1016/j.saa.2021.120773 [56] ZHAO J, LIU X Y, ZHOU Y, et al. Surface-enhanced Raman scattering technology based on TiO2/Nb2C coated microfluidic chip for monitoring glioma cells invasion in real time[J]. Chinese Chemical Letters, 2023, 34(6): 107895. doi: 10.1016/j.cclet.2022.107895 [57] LARION M, DOWDY T, RUIZ-RODADO V, et al. Detection of metabolic changes induced via drug treatments in live cancer cells and tissue using Raman imaging microscopy[J]. Biosensors, 2018, 9(1): 5. doi: 10.3390/bios9010005 [58] YUAN Y H, SHAH N, ALMOHAISIN M I, et al. Assessing fatty acid-induced lipotoxicity and its therapeutic potential in glioblastoma using stimulated Raman microscopy[J]. Scientific Reports, 2021, 11(1): 7422. doi: 10.1038/s41598-021-86789-9 [59] ZACHARIAH M A, OLIVEIRA-COSTA J P, CARTER B S, et al. Blood-based biomarkers for the diagnosis and monitoring of gliomas[J]. Neuro-Oncology, 2018, 20(9): 1155-1161. doi: 10.1093/neuonc/noy074 [60] SILANTYEV A S, FALZONE L, LIBRA M, et al. Current and future trends on diagnosis and prognosis of glioblastoma: from molecular biology to proteomics[J]. Cells, 2019, 8(8): 863. doi: 10.3390/cells8080863 [61] SURMAN M, STĘPIEŃ E, HOJA-ŁUKOWICZ D, et al. Deciphering the role of ectosomes in cancer development and progression: focus on the proteome[J]. Clinical & Experimental Metastasis, 2017, 34(3-4): 273-289. [62] GOURLAY J, MOROKOFF A P, LUWOR R B, et al. The emergent role of exosomes in glioma[J]. Journal of Clinical Neuroscience, 2017, 35: 13-23. doi: 10.1016/j.jocn.2016.09.021 [63] MANGANO K, MAZZON E, BASILE M S, et al. Pathogenic role for macrophage migration inhibitory factor in glioblastoma and its targeting with specific inhibitors as novel tailored therapeutic approach[J]. Oncotarget, 2018, 9(25): 17951-17970. doi: 10.18632/oncotarget.24885 [64] NAKAGAWA H, YAMADA M, KANAYAMA T, et al. Myelin basic protein in the cerebrospinal fluid of patients with brain tumors[J]. Neurosurgery, 1994, 34(5): 825-833. [65] KWON H, OH S, JIN X, et al. Cancer metabolomics in basic science perspective[J]. Archives of Pharmacal Research, 2015, 38(3): 372-380. doi: 10.1007/s12272-015-0552-4 [66] ALI J S, AIN N U, NAZ S, et al. Biomarker selection and imaging design in cancer: a link with biochemical pathways for imminent engineering[J]. Heliyon, 2020, 6(2): e03340. doi: 10.1016/j.heliyon.2020.e03340 [67] BULIK M, JANCALEK R, VANICEK J, et al. Potential of MR spectroscopy for assessment of glioma grading[J]. Clinical Neurology and Neurosurgery, 2013, 115(2): 146-153. doi: 10.1016/j.clineuro.2012.11.002 [68] STADLBAUER A, GRUBER S, NIMSKY C, et al. Preoperative grading of gliomas by using metabolite quantification with high-spatial-resolution proton MR spectroscopic imaging[J]. Radiology, 2006, 238(3): 958-969. doi: 10.1148/radiol.2382041896 [69] FUJITA Y, KOHTA M, SASAYAMA T, et al. Intraoperative 3-T magnetic Resonance spectroscopy for detection of proliferative remnants of glioma[J]. World Neurosurgery, 2020, 137: 149-157. doi: 10.1016/j.wneu.2020.01.217 [70] MÖRÉN L, BERGENHEIM A T, GHASIMI S, et al. Metabolomic screening of tumor tissue and serum in glioma patients reveals diagnostic and prognostic information[J]. Metabolites, 2015, 5(3): 502-520. doi: 10.3390/metabo5030502 [71] KRUCHKO C, GITTLEMAN H, RUHL J, et al. Cancer collection efforts in the United States provide clinically relevant data on all primary brain and other CNS tumors[J]. Neuro-Oncology Practice, 2019, 6(5): 330-339. doi: 10.1093/nop/npz029 [72] DANG L, WHITE D W, GROSS S, et al. Cancer-associated IDH1 mutations produce 2-hydroxyglutarate[J]. Nature, 2010, 465(7300): 966-966. [73] MIAO X X, FANG Q Q, XIAO X, et al. Integrating cycled enzymatic DNA amplification and surface-enhanced Raman scattering for sensitive detection of circulating tumor DNA[J]. Frontiers in Molecular Biosciences, 2021, 8: 676065. doi: 10.3389/fmolb.2021.676065 [74] ZHOU Y, LIU CH H, WU B L, et al. Invited article: molecular biomarkers characterization for human brain glioma grading using visible resonance Raman spectroscopy[J]. APL Photonics, 2018, 3(12): 120802. doi: 10.1063/1.5036637 [75] QUESNEL A, COLES N, ANGIONE C, et al. Glycosylation spectral signatures for glioma grade discrimination using Raman spectroscopy[J]. BMC Cancer, 2023, 23(1): 174. doi: 10.1186/s12885-023-10588-w [76] GE M L, WANG Y Y, ZHANG F, et al. Study of low-frequency spectroscopic characteristics of γ-aminobutyric acid with THz and low-wavenumber Raman spectroscopy[J]. Spectrochimica Acta Part A: Molecular and Biomolecular Spectroscopy, 2024, 305: 123550. doi: 10.1016/j.saa.2023.123550 -

 下载:
下载:


计量
- 文章访问数: 576
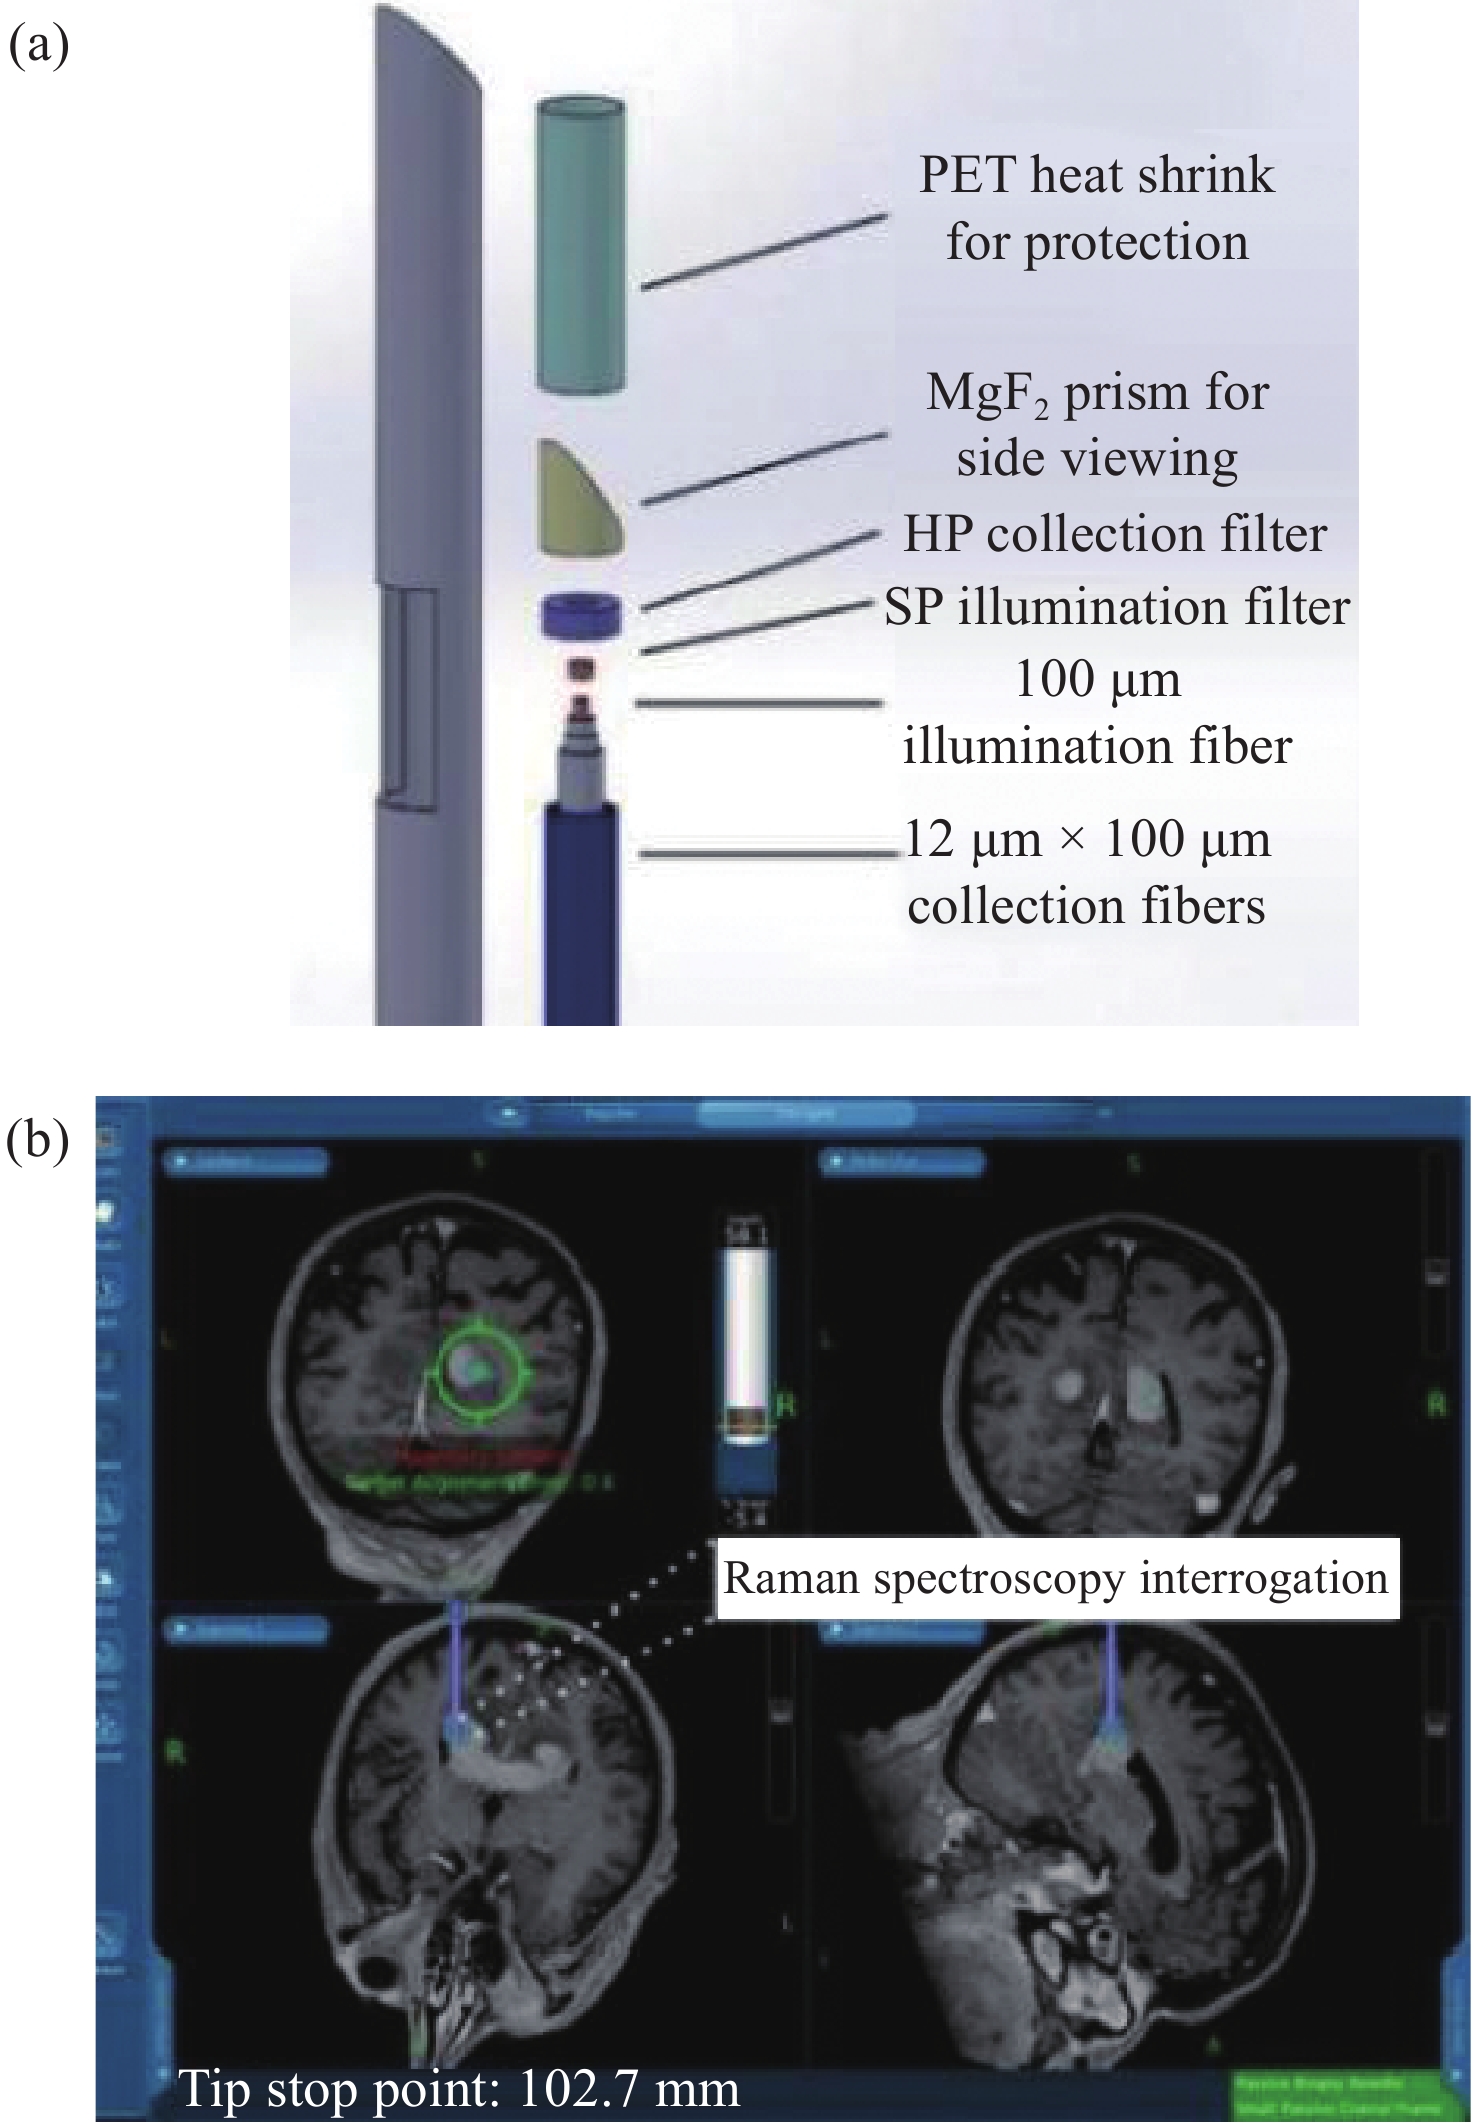
- HTML全文浏览量: 320
- PDF下载量: 233
- 被引次数: 0
