Processing math: 100%

留言板

尊敬的读者、作者、审稿人, 关于本刊的投稿、审稿、编辑和出版的任何问题, 您可以本页添加留言。我们将尽快给您答复。谢谢您的支持!

姓名
邮箱
手机号码
标题
留言内容
验证码

Analysis of the relationship between the mode shapes of a landmine’s upper casing and its laser speckle interference signal

ZHANG Xiao-qing WANG Chi LI Jin-hui LUO Xin-yu YU Ying-jie

ZHANG Xiao-qing, WANG Chi, LI Jin-hui, LUO Xin-yu, YU Ying-jie. Analysis of the relationship between the mode shapes of a landmine’s upper casing and its laser speckle interference signal[J]. Chinese Optics, 2022, 15(4): 812-824. doi: 10.37188/CO.EN.2022-0001
Citation: ZHANG Xiao-qing, WANG Chi, LI Jin-hui, LUO Xin-yu, YU Ying-jie. Analysis of the relationship between the mode shapes of a landmine’s upper casing and its laser speckle interference signal[J]. Chinese Optics, 2022, 15(4): 812-824. doi: 10.37188/CO.EN.2022-0001
张小青, 王驰, 李金辉, 罗欣宇, 于瀛洁. 雷体罩模态振型与激光散斑干涉信号的关系解析[J]. 中国光学(中英文), 2022, 15(4): 812-824. doi: 10.37188/CO.EN.2022-0001
引用本文: 张小青, 王驰, 李金辉, 罗欣宇, 于瀛洁. 雷体罩模态振型与激光散斑干涉信号的关系解析[J]. 中国光学(中英文), 2022, 15(4): 812-824. doi: 10.37188/CO.EN.2022-0001

Analysis of the relationship between the mode shapes of a landmine’s upper casing and its laser speckle interference signal

doi: 10.37188/CO.EN.2022-0001
Funds: Supported by the National Natural Science Foundation of China (No. 62175144, No. 61773249); the Science and Technology on Near-Surface Detection Laboratory (No. TCGZ2020C003); Shanghai Science and Technology Innovation Action Plan (No. 20142200100)
More Information
    Author Bio:

    Xiao-qing ZHANG (1984—), female, M.S. She was born in Shangyu, Zhejiang in 1984 and received a M.S. degree in Communication and Information Systems from Nanchang Hangkong University in 2007. She is currently pursuing a PhD degree in the School of Mechatronic Engineering and Automation, Shanghai University. In the meantime, she works in Tongji Zhejiang College in the Jiaxing city of Zhejiang. Her research area is optical detection technology, signal and information processing. E-mail: zxq2018@shu.edu.cn

    Chi WANG (1982—), male, Ph.D. He was born in Taikang, Henan in 1982, and received his Ph.D. degree in measurement technology and instruments from Tianjin University in 2009. Currently, he is a professor in the School of Mechatronic Engineering and Automation, Shanghai University. His main research interests include optical detection technology. E-mail: wangchi@shu.edu.cn

    Corresponding author: wangchi@shu.edu.cn

雷体罩模态振型与激光散斑干涉信号的关系解析

详细信息
  • 中图分类号: TN247; TN249

  • 摘要:

    本文研究了塑壳雷体罩的振型与激光散斑干涉信号之间的映射关系。根据薄圆板的振动方程,建立了地雷上壳体的振型函数。基于激光剪切散斑干涉原理和CCD相机的时间平均法,将振型的离面位移映射到干涉激光的相位。建立的映射关系表明地雷的不同振型对应于独特的贝塞尔条纹。此外,还模拟分析了两种模式的贝塞尔条纹,并进行了实验验证,数值计算和实验结果均验证了理论结论。本文研究为实现声光探雷的快速扫描技术提供了理论依据。


  • As a kind of low-cost defense weapon in wartime, landmines have been widely used in previous wars. Landmines have always been a severe threat to the people’s live of those mined countries or regions[1]. Therefore, eliminating hidden dangers caused by landmines has become a global problem that all countries in the world face. Landmine detection remains a worldwide problem to this day, especially for the detection of buried plastic landmines. The difference in electrical characteristics between plastic-cased landmines and the surrounding soil is relatively small, making it difficult for commonly used metal-cased landmine detectors to detect plastic-cased landmines. From the 1940s to the 1950s, a large number of plastic-cased landmines began to appear when the metal shells of landmines were gradually replaced by plastic shells[2]. Due to the limitation of these detection mechanisms, it is difficult to distinguish whether the buried objects are plastic-cased landmines or bricks, rocks, and other interfering objects. Using UAV-based Optical Data Fusion, landmine detection probability can be preliminarily estimated[3]. The methods of detecting the chemical composition of explosives such as hyperspectral images[4], Neutron challenge[5], and Raman spectroscopy[6] developed in recent years have strong identification capabilities, but the system is complicated and expensive, and the detected signal is extremely weak, leading to the problems relating to long detection (signal accumulation) time and a high misdetection rate. It is possible to overcome the difficulty of detecting plastic-cased landmines containing very low metal contents by improving the sensitivity of metal landmine detectors. However, many shrapnel, shell and other metal interferences in a minefield can cause high false positives. Biological mine detection methods, such as the passive method using Honeybee-based on-site explosive sampling, can only estimate the total explosive load in a certain area but cannot locate the mine’s location[7].

    Acoustic-to-seismic landmine detection technology based on the unique mechanical properties of landmines and the principle of acoustic-to-seismic coupling shows good application prospects, especially in the safe and effective detection of plastic-cased landmines. The acoustic-to-seismic coupling[8-10] refers to when sound waves propagating in the air are incident on the ground. In addition to most of the energy reflected into the air by the ground surface, a small proportion is coupled to propagate underground due to the influence of soil porosity. This forms seismic waves with different compositions such as transverse waves and fast and slow longitudinal waves. The air cavity and fuze in the landmine structure make its acoustic compliance (the deformation caused by per unit stress, commonly known as flexibility) much greater than the acoustic compliance of the surrounding soil. The "soil-landmine" system can produce the equivalent “Mass-spring" resonance phenomenon under the influence of seismic waves. Sabatier J. M and Donskoy et al.[11-13]successively established linear and nonlinear resonance models for acoustic-to-seismic landmine detection; Zagrai et al.[14-15] studied the multi-mode mechanism of landmine vibration response; Alberts et al.[16] studied the impact of landmine burial depth on resonance frequency. These studies have indicated the feasibility of acoustic-to-seismic landmine detection based on the mechanical properties of landmines and the principle of acoustic-to-seismic coupling. However, due to the low efficiency of acoustic-to-seismic coupling, the ground surface vibration excited by sound waves is still very weak even when the landmine resonates. Measuring the characteristic signals of landmines accurately and quickly has always been a key problem that limits the research of acoustic-to-seismic landmine detection systems.

    Laser interferometric vibration detection technology has a good application prospect in acoustic-to-seismic landmine detection due to its of highly precise and non-contact mechanism. Qiukun Zhang et al.[17] studied that the vibration measurement technology of high-performance optical coherence velocimeter can achieve nanometer-level accuracy; Xiang and Sabatier[18-19] used a single-beam laser Doppler vibrometer for acoustic-to-seismic landmine detection; Wang Chi research group[20-21] studied the landmine’s mode shape based on laser self-mixing vibrometer; Rajesh et al.[22] used the ultrasonic Doppler vibrometer array for landmine detection, which increased the vibration measurement rate to a certain extent, but the array had the disadvantages in its bulky size and high cost. In this paper, based on the multi-model resonance phenomenon of a landmine’s upper casing under the sound wave excitation, laser speckle interferometric vibration measurement technology based on a time average is used to study the relationship between the mode shapes of the landmine’s upper casing and the Bessel signals, providing theoretical evidence for realizing the rapid scanning technology of acoustic-optics landmine detection.

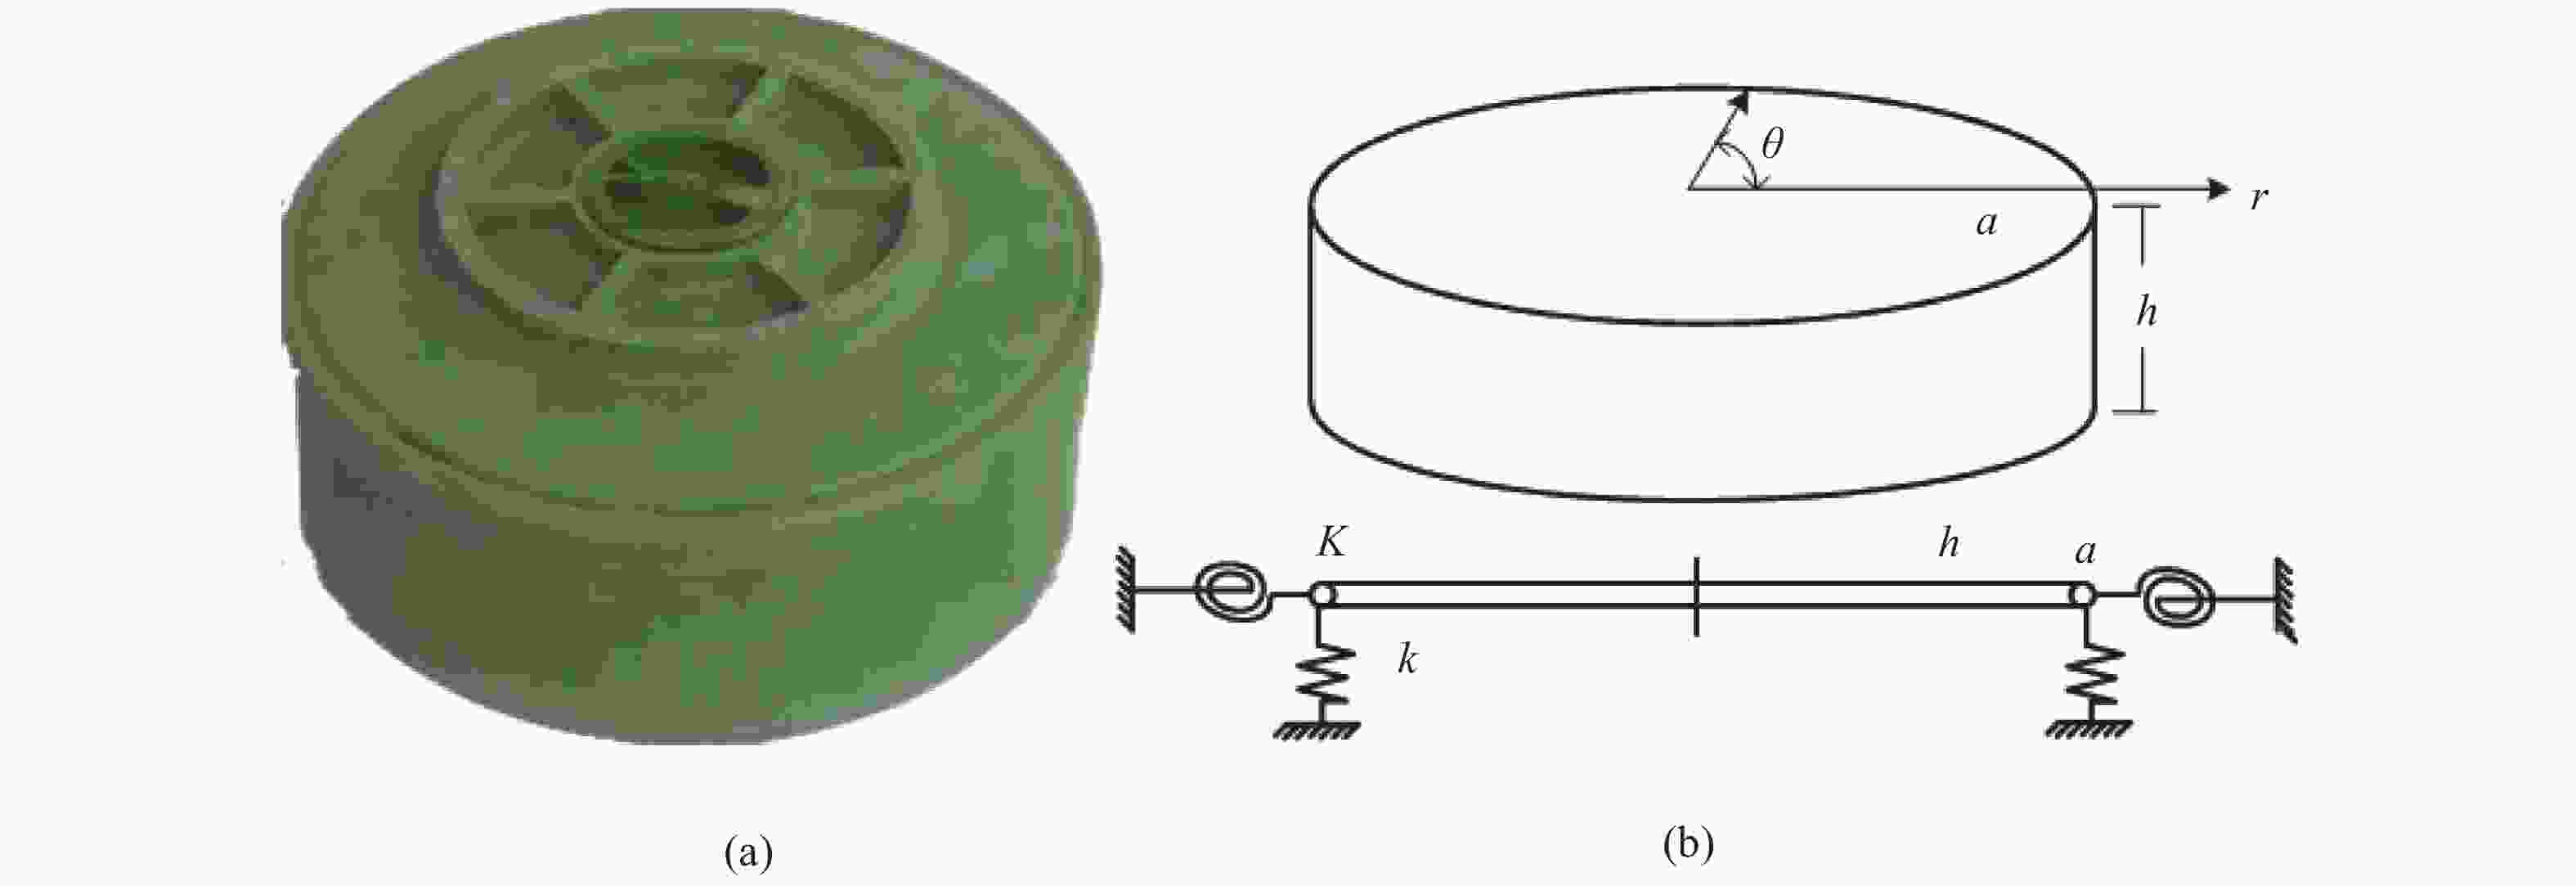
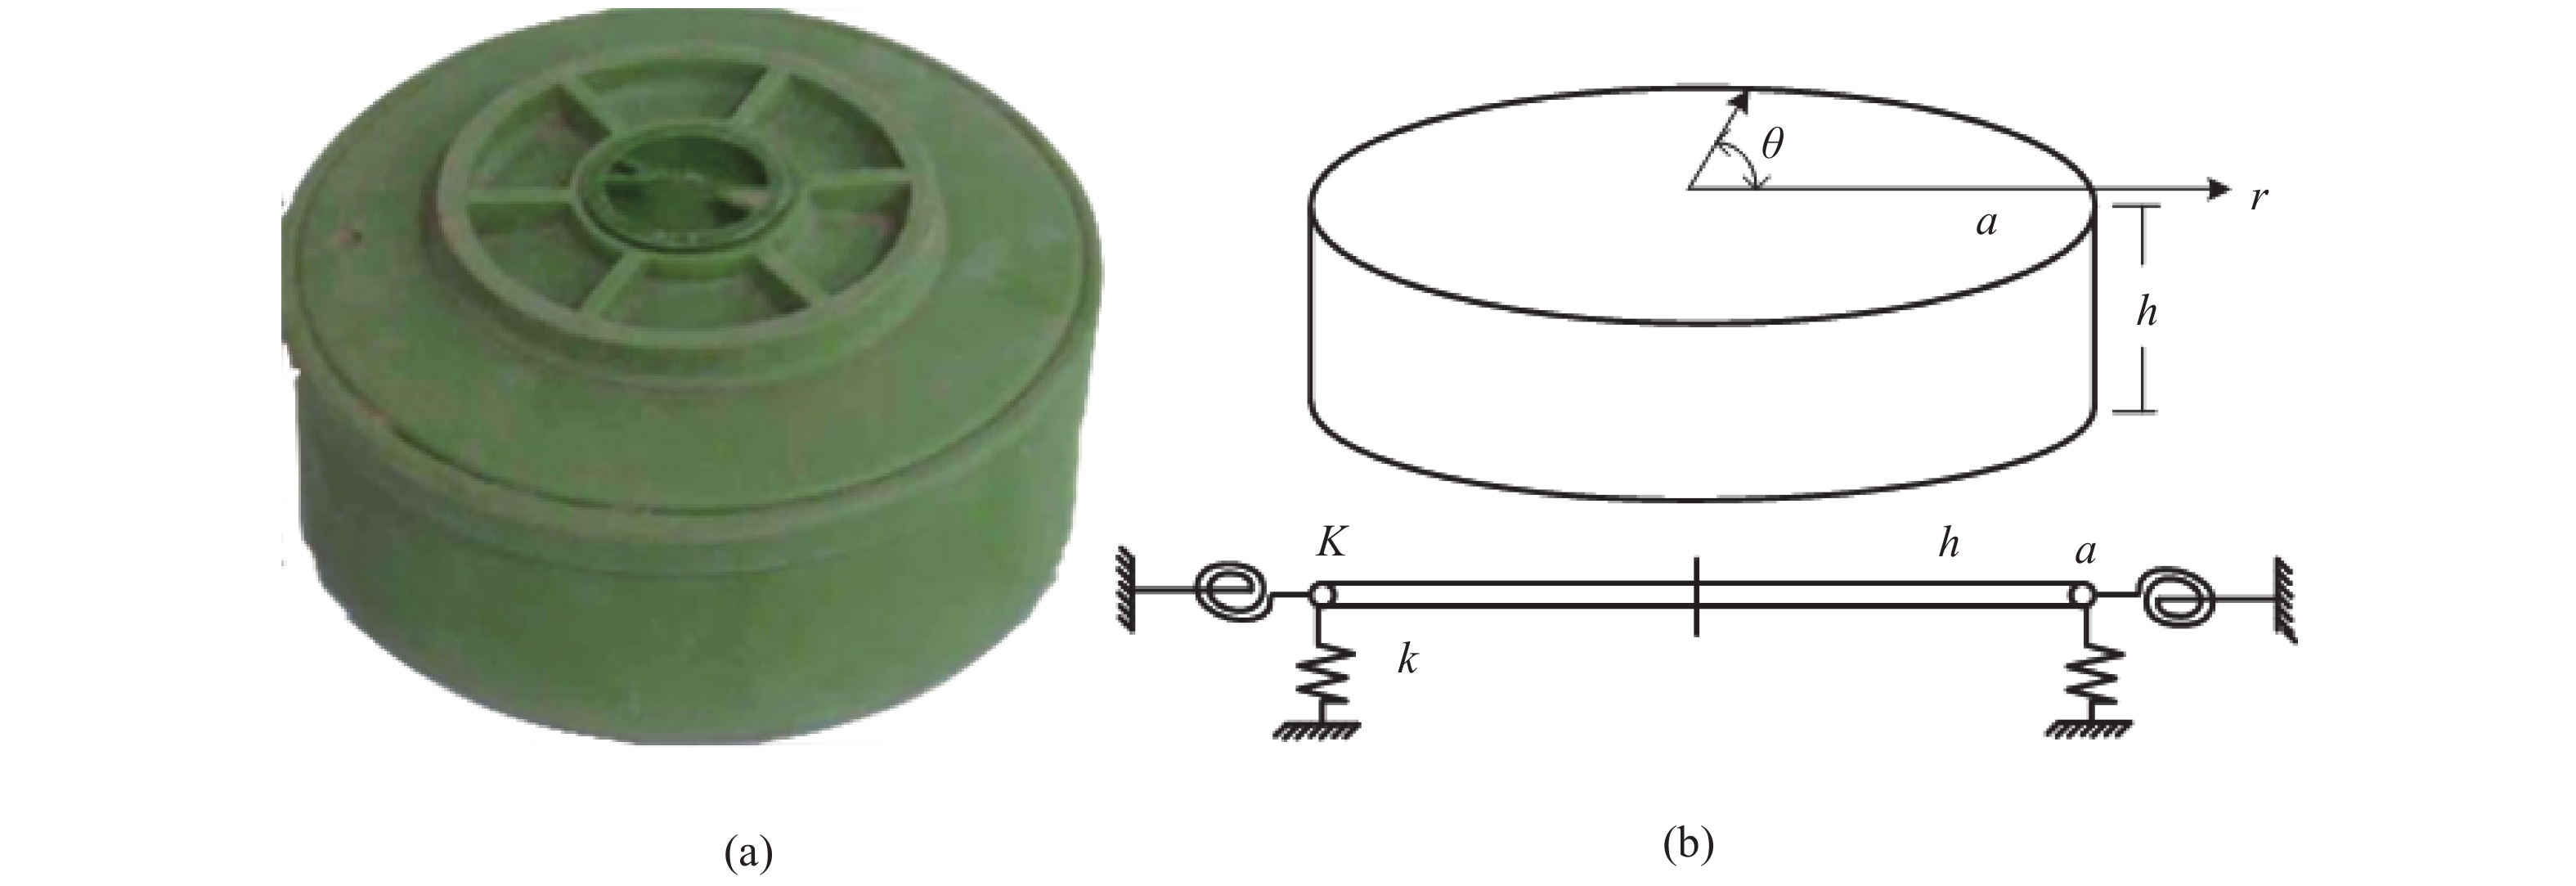
    According to literatures [14-15], the main vibration mode characteristics of landmines are mainly determined by the upper surface of landmines, i.e., the landmine’s upper casing. To facilitate the analysis of the multi-mode vibration phenomena of landmines, the characteristics of the three-dimensional vibration mode shapes of landmines are simplified to the characteristics of the two-dimensional vibration mode shape of the plane structures where the burying depth is assumed to be 0 to remove the restriction of the soil above the landmine. As shown in Fig. 1, the landmine’s upper casing is equivalent to a cylindrical thin circular plate structure in polar coordinates Orθ, with a radius of a and a thickness of h. Two continuous boundary constrained springs are arranged on the boundary of the plate structure at r=a, namely linear displacement spring k and rotation constrained spring K. For a circular planar structure, the (m,n) mode can be used to represent the vibration mode.

    Figure  1.  Analytical object and model of landmine’s multi-modal vibration characteristics. (a) Anti-tank plastic landmine; (b) equivalent cylindrical thin circular plate

    In a certain 1st order state, where m represents the number of pitch diameters of the structure, and n represents the number of pitch circles of the structure. Theoretically, the point with a value of 0 in the mode shape is called a node, i.e., the intersection of the mode shape and the undeformed point in the original structure. The pitch diameter refers to the diameter with a value of 0 in the vibration mode, i.e., the lines composed of nodes. The pitch circle refers to the circle with a value of 0 in the vibration mode. As shown in Fig. 2 (Color online), when a landmine is excited by an external vibration with a certain frequency, the surface of its upper casing will produce a unique multi-modal vibration phenomenon. In Fig. 2, green represents pitch diameter, red represents pitch circle.

    Figure  2.  Contour diagrams of landmine mode shapes. (a) (0,1) mode; (b) (0,2) mode; (c) (1,1) mode

    The mode shapes of landmines are thoroughly analyzed according to literatures [14-15]. When the landmine’s upper casing is subjected to external forces, the vibration equation of the thin circular plate can be expressed as:

    D4w(r,θ,t)+ρh2w(r,θ,t)t2=p(r,θ,t), (1)

    where represents the Hamiltonian operator, 2=2r2+rr+2r2θ2 , ρ is the equivalent landmine density, and h is the equivalent landmine thickness. D=Eh3[12(1ν2)] represents the bending stiffness, where E is Young’s modulus, and ν is Poisson’s ratio. Assuming the harmonic excitation with the frequency w, p(r,θ,t)=P(r,θ,t)ejwt represents the applied external force. The displacement can be decomposed into the following forms through variable separations:

    w(r,θ,t)=Wmn(r,θ)Tmn(t)=mnWmn(r,θ)Tmn(t), (2)

    where Tmn is a time function, and Wmn(r,θ) is the mode shape function. Based on the mathematical model of the thin circular plate structure, its vibration function can be written as:

    Wmn(r,θ)=Amn[Jn(λmnra)+CmnIn(λmnra)]cos(nθ)n0, (3)

    where Jn and In are the first kind and second kind Bessel functions, and a is the radius of the thin circular plate. Let the modal shape function equal to zero, and the following equation can be obtained:

    {Amn[Jn(λmnra)+CmnIn(λmnra)]=0cos(nθ)=0. (4)

    According to equation (4), combined with the values of the points whose amplitudes are 0, when r=r1,r2,r3,rm, the value of the mode shape function is 0, and m is the number of pitch circles. When θ=θ1,θ2,θ3θn, the value of the mode shape function is 0, and n is the number of pitch diameters. Cmn and Amn are coefficients that depend on m and n, and λmn is the ath positive root of the m-order Bessel function Jn=0.

    For elastic boundaries, the boundary conditions are:

    Mr(a,θ)=KW(a,θ)r, (5)
    Vr(a,θ)=kW(a,θ). (6)

    Mr and Vr are the bending moments at the corresponding positions. According to the plate and shell vibration theory, the following expressions apply:

    Mr(a,θ)=D[2W(a,θ)r2+ν(1rW(a,θ)r+1r22W(a,θ)θ2)], (7)
    Vr(a,θ)=D[2W(a,θ)r2+(1ν)1rθ(1r2W(a,θ)rθ1r22W(a,θ)θ2)]. (8)

    According to equations (7) and (8), equations (5) and (6) can be expressed in terms of W(a, θ). Then the parameters Cmn and Amn can be obtained by substituting equation (3) into equations (5) and (6).

    The parameter Amn of the mode shape function can be obtained by the following equation:

    2π0a0ρhWmn(r,θ)Wpq(r,θ)rdrdθ=mMδmpδnq, (9)

    where δ is the Kronecker number, and when m = p, δmp = 1; when m ≠ p, δmp=0. mM is the mass of the thin circular plate. According to the equation (9), Amn can be expressed as:

    Amn=1πa22π0a0[(Jn(λmnra)+CmnIn(λmnra))cos(nθ)2rdrdθ]0.5. (10)

    The mode shape function Wmn(r, θ) can be obtained by substituting Cmn, Amn and λmn into equation (3). The complex "soil-mine" system can be described by a relatively simple and direct mathematical equation, which provides a theoretical basis for the analysis of the mode shapes of the landmine’s upper casing and its application in the acoustic-to-seismic landmine detection system.

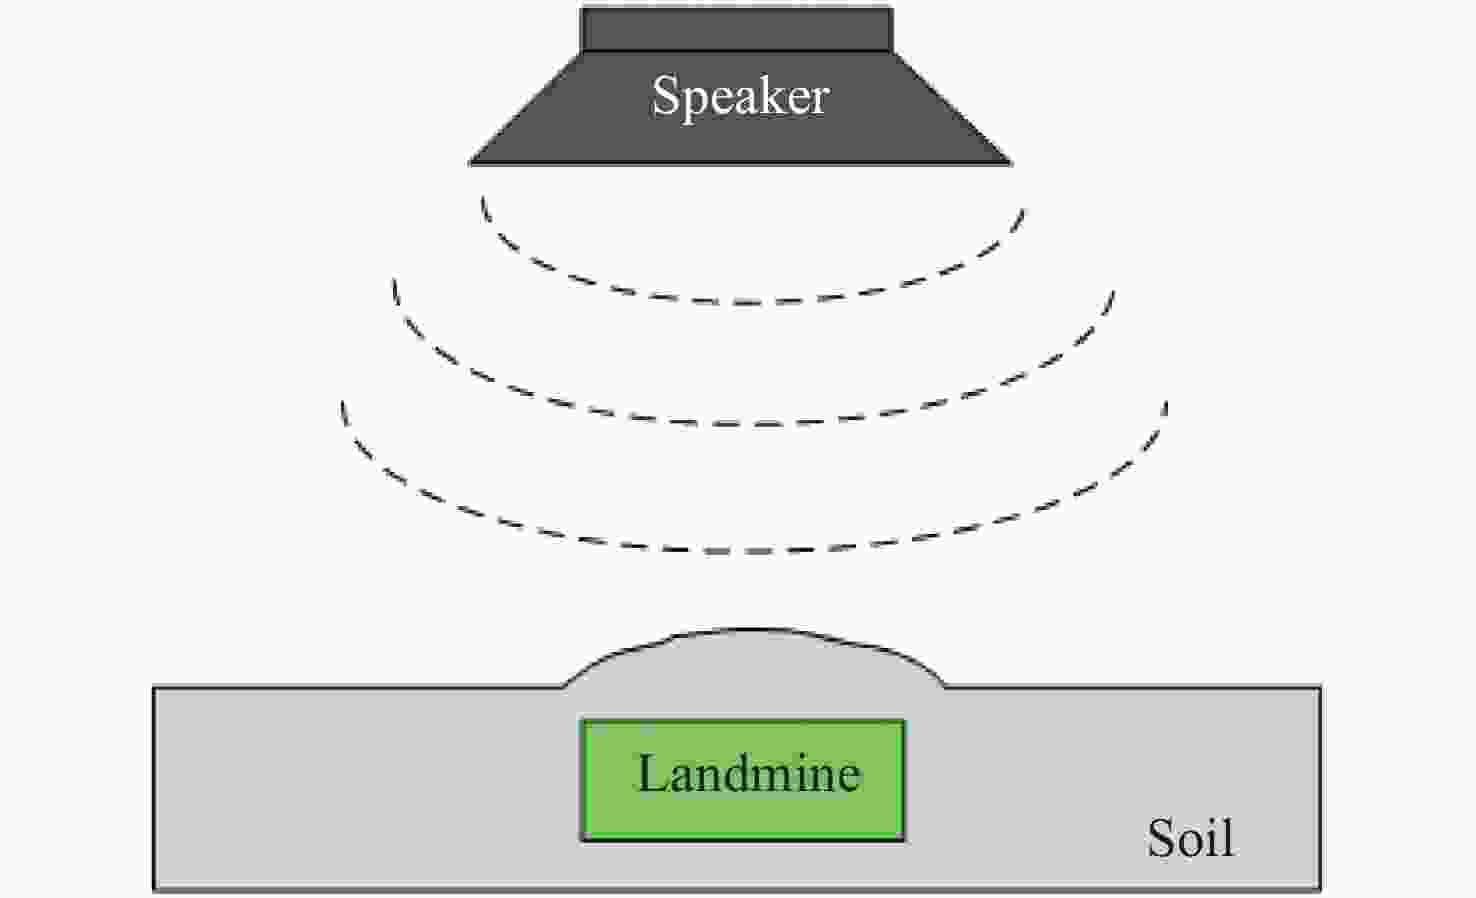
    Electronic Speckle-Shearing Patten Interferometry (ESSPI) is a new technique for measuring displacement derivative developed after electronic speckle interference and is widely used in the field of non-destructive testing[23-25]. For the measurement of the deformation caused by the vibration of the object, laser shearing speckle interferometry is often combined with the time-average method of a CCD camera[26-27]. Consequently, the use of high-energy sound wave pulses or vibration exciters to excite the vibration energy close to the landmine location will cause abnormal changes in the ground surface vibration under the resonant movement of the landmine (Fig. 3). The laser beam is projected to the location where the landmine is buried, and the high-resolution CCD camera system is used to record the speckle interference fringes containing the surface vibration information in real time. The interference fringes are analyzed and processed to obtain small vibration signals on the ground surface, and then the existence of buried landmines can be determined.

    Figure  3.  Vibration deformation schematic diagram of the soil surface with and without landmine under the excitation of sound waves

    The speckle interference fringe obtained by the time-average method of a CCD camera is modulated by the zero-order Bessel function, that is, Bessel fringe[28]. Thus, studying the mapping relationship between the mode shapes of the landmine’s upper casing and the Bessel fringes can further study the information such as the type and size of the landmine, as well as the rapid identification method. The following is the analysis of mapping relationship between the function of the mode shape of the landmine’s upper casing and the Bessel fringes.

    To analyze the mapping relationship between the mode shape of the mine cover and the Bessel fringe, the optical path of laser speckle interferometry measurement on the mode shapes of the landmine’s upper casing is shown in Fig. 4(Color online). Assuming that the shearing direction is in the x direction. Laser S(xs,ys,zs) irradiates on the measured landmine’s upper casing. The two points P1(x,y,z) and P2(x+δx,y,z) on the surface of the landmine’s upper casing spaced apart by δx are imaged and interfered with each other at the same point C(xc,yc,zc) on the CCD camera after passing through the shearing device, where δx is the shear amount in the x direction. After the landmine’s upper casing is excited by sound waves, point P1(x,y,z) moves to P1(x+u,y+v,z+w) and point P2(x+δx,y,z) moves to P2(x+δx+u+δu,y+v+δv,z+w+δw). The distance between P1 and P2 is (δu, δv, δw).

    Figure  4.  The optical path of laser speckle interferometry measurement on the mode shapes of the landmine’s upper casing

    According to our preliminary research and analysis[28], it is assumed that the intensity of speckle interference obtained by the time averaging method based on a CCD camera is I(x, y), and its expression is as follows:

    I(x,y)=2Re[g1(x,y)g2(x,y)][1J0(Δϕ(x,y))]. (11)

    In the formula, 2Re[g1(x,y)g2(x,y)] is random speckle noise, J0 is the zero-order Bessel function of the first kind, and Δφ(x,y) is the phase difference of the interference laser due to the vibration deformation of the landmine’s upper casing.

    In order to facilitate the correlation between the shear speckle interferometry theory and the multi-modal vibration characteristics of mines, the vibration mode function is transformed from the polar coordinate system to the Cartesian coordinate system xOy, that is: x=rcosθy=rsinθ .

    r=x2+y2,θ=arcsinyx2+y2. (12)

    The equation of the mode shape function of the landmine’s upper casing in the Cartesian coordinate system can be obtained as equation (13) by substituting equation (12) into equation (3).

    Wmn(x,y)=Amn[Jn(λmnx2+y2a)+CmnIn(λmnx2+y2a)]cos(narcsinyx2+y2). (13)

    According to literature [29], the relationship between the pure phase change caused by the out-off-plane displacement of the landmine’s upper casing and the derivative of the out-off-plane displacement is as follows:

    Δφ(x,y)=Wmn(x,y)x4πλδx. (14)

    In the formula (11), since 1J0(Δφ(x,y)) is a value that changes in a period, the resulting speckle interferogram is a light and dark speckle fringe pattern produced by 1J0(Δφ(x,y)) modulation, that is Bessel fringe. It is possible to calculate the phase change caused by the vibration of the out-off-plane deformation through observing the obtained Bessel fringe. Then, the amount of change in the gradient of the out-off-plane displacement of the landmine’s upper casing can be obtained. As a result, the vibration deformation of the landmine’s upper casing can be determined. Where there is a constant shear amount, the Bessel fringe order increases as the displacement gradient is larger.

    The landmine’s upper casing is equivalent to a thin circular plate structure with elastic supports and it has the mode function Wmn(x,y). The numerical analysis is based on the mapping relationship between the mode shapes of landmine and Bessel fringes, which is formula (13).

    The simulation parameter setting is shown in Table 1. The radius of the landmine’s upper casing a=13.5 cm, Poisson’s ratio υ=0.33, Young’s modulus E=17×1019 Pa, and laser wavelength λ=658 nm. To clearly display the fringe series in the Bessel fringe pattern, the shear amount is set to 6 mm, and the Cartesian coordinate system is established with the center of the thin circular plate as the origin. The shearing direction of the laser speckle interference is in the x direction. Assuming that there is a circle and 0 pitch diameters in the thin circular plate, i.e., the (0,1) order mode. The simulation results are shown in Fig 5, 7, 9(a) (Color online), while the mode simulation results for the (0,2) order mode are shown in Figs. 6, 8, 9(b) (Color online).

    Table  1.  Simulation parameter setting
    ParameterSimulation settings
    Transverse stiffness ratio1000
    Poisson’s ratio:υ0.33
    Young’s modulus: E17×1019 Pa
    The radius of the landmine’s upper casing:a13.5 cm
    Laser wavelength:λ658 nm
    Shear amount:δx6 mm
    Image size512×512
    Mode(0,1) order, (0,2) order
     | Show Table
    DownLoad: CSV
    Figure  5.  Vibration diagram under (0,1) mode. (a) Three-dimensional vibration mode diagram; (b) contour map
    Figure  6.  Vibration diagram under (0,2) mode. (a) Three-dimensional vibration mode diagram; (b) contour map
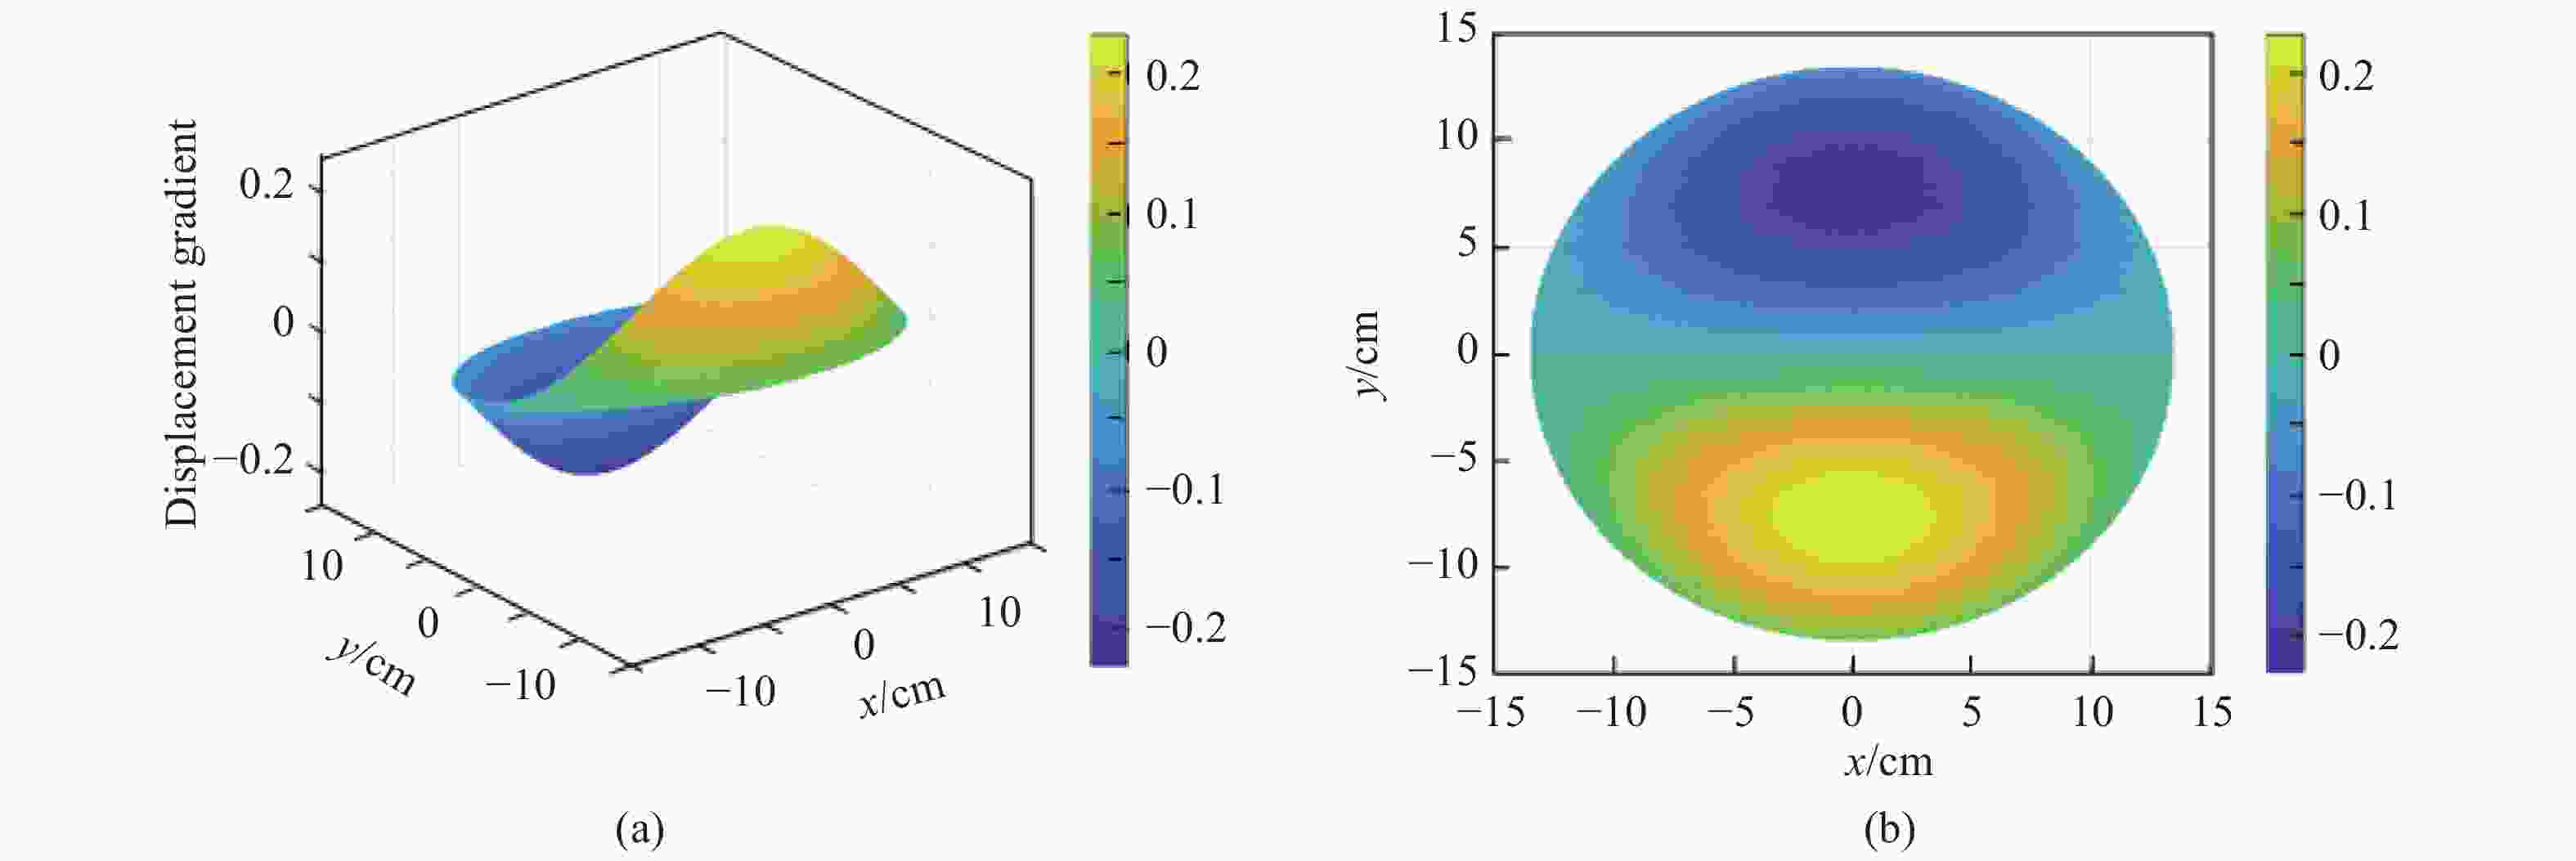
    Figure  7.  Vibration displacement gradient change under the (0,1) mode. (a) Three-dimensional diagram of the displacement gradient change; (b) contour map
    Figure  8.  Vibration displacement gradient change under the (0,2) mode. (a) Three-dimensional diagram of displacement gradient change; (b) contour map

    Figs. 5 and 6 show the (0,1) and (0,2) order landmine vibration patterns, respectively. The vibration amplitude of the (0,1) order mode decreases from the center to the surroundings with a maximum value of 2.1573 mm at the center of the mine. Due to the existence of two pitch circles in the (0,2) order mode, the vibration amplitude changes suddenly at the first pitch circle line then increases from there to the center. Its amplitude reaches a maximum of 2.8099 mm at the center of the mine, which is an increase of 0.6526 mm compared to the maximum amplitude of the (0,1) order mode.

    Figs. 7 and 8 show the (0,1) and (0,2) order modes’ vibration displacement gradient changes, respectively. Since the shear direction of the laser speckle interference is set to the x direction, the vibration displacement gradient is obtained by calculating the first-order partial derivative of the landmine vibration mode function with respect to x. Since the mode shapes of landmines are evenly symmetric about y=0, the displacement gradient change of the (0,1) order mode shape obtained by calculating the first-order partial derivative with respect to x is oddly symmetric about y=0. The maximum absolute value of the gradient change is 0.2285. It is obvious from the contour map in Fig. 7 (b) that at y=0, the displacement gradient change is always zero regardless of any change in x. The two displacement gradients with odd symmetry increase or decrease from the point where of x=0 cm and y=±7.752 cm to the surroundings, respectively. As shown in Fig. 8, the first section circular vibration mode of the (0,2) order is evenly symmetrical about y=0, and its displacement gradient change is oddly symmetrical at that same point. The maximum absolute value of the gradient change is 0.7064, an increase of approximately 0.4779 compared to the maximum absolute displacement gradient of the (0,1) order mode. Similarly, at y=0, the displacement gradient change is constantly 0 for any change of x. The two displacement gradients with odd symmetry increase or decrease from the point with the coordinate where x=0 cm and y=±4.377 cm to the surroundings, respectively. Compared with the center position of the (0,1) order, the y coordinate of the (0,2) order is offset by 3.375 cm toward the center.

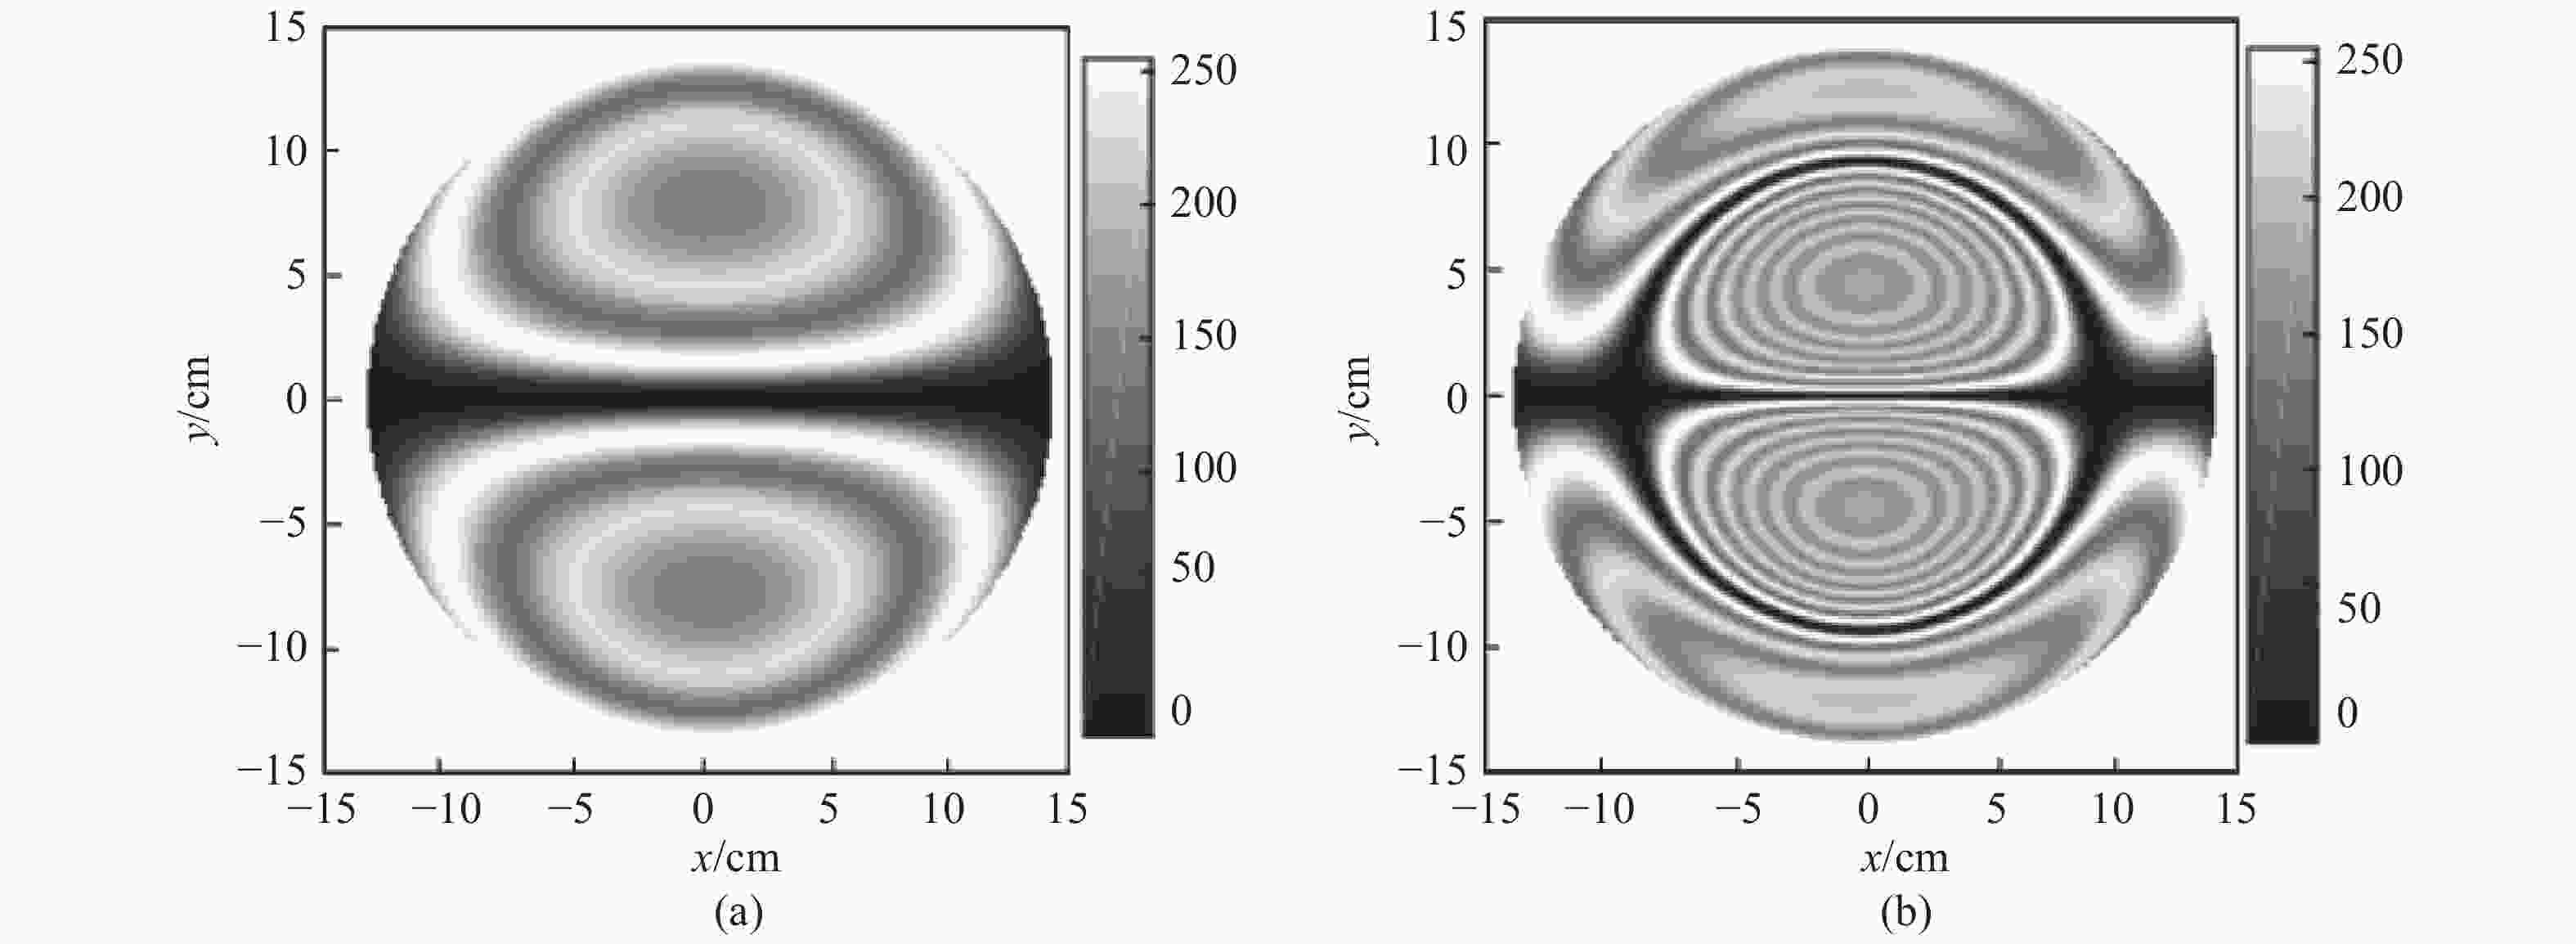
    Fig.9 shows the mode shapes of the landmine based on speckle interference fringes of the (0,1) and (0,2) order modes, respectively. It can be seen from Fig. 7 that the displacement gradient generated before and after the interference laser vibration in the (0,1) order mode is oddly symmetrical about y=0. At y= 0, with the change of x, the displacement gradient change is always 0. Therefore, Fig. 9(a) shows symmetrical butterfly-shaped interference fringes with dark fringes at y=0. Since the maximum displacement gradient is 0.2285, the Bessel fringe order is about 2. Similarly, the Bessel fringe at the first pitch circle in Fig.9(b) is symmetrically butterfly-shaped where y=0 with the dark fringe appearing at y=0. Since the maximum displacement gradient is 0.7064, which is approximately 3 times the maximum displacement gradient of the (0, 1) order mode, the Bessel fringe order is about 6.

    Figure  9.  Mine modal shapes based on speckle interference fringes. (a) Under the (0,1) mode; (b) under the (0,2) mode

    According to the literatures [14-15], landmines will produce different resonance phenomena in different soil environments, different buried depths, different frequencies, and different decibel levels of sound wave excitation, leading to different degrees of vibration and deformation of the soil surface above buried landmines, i.e., different displacement gradient changes. The order of Bessel fringe series is related to the displacement gradient and the shear amount. Therefore, when using laser speckle interferometry to carry out mine detection experiments, the order of interference fringes such as the (0,1) order mode will change based on the actual measurement situation, but the overall shape should be symmetrically butterfly-shaped interference fringes.

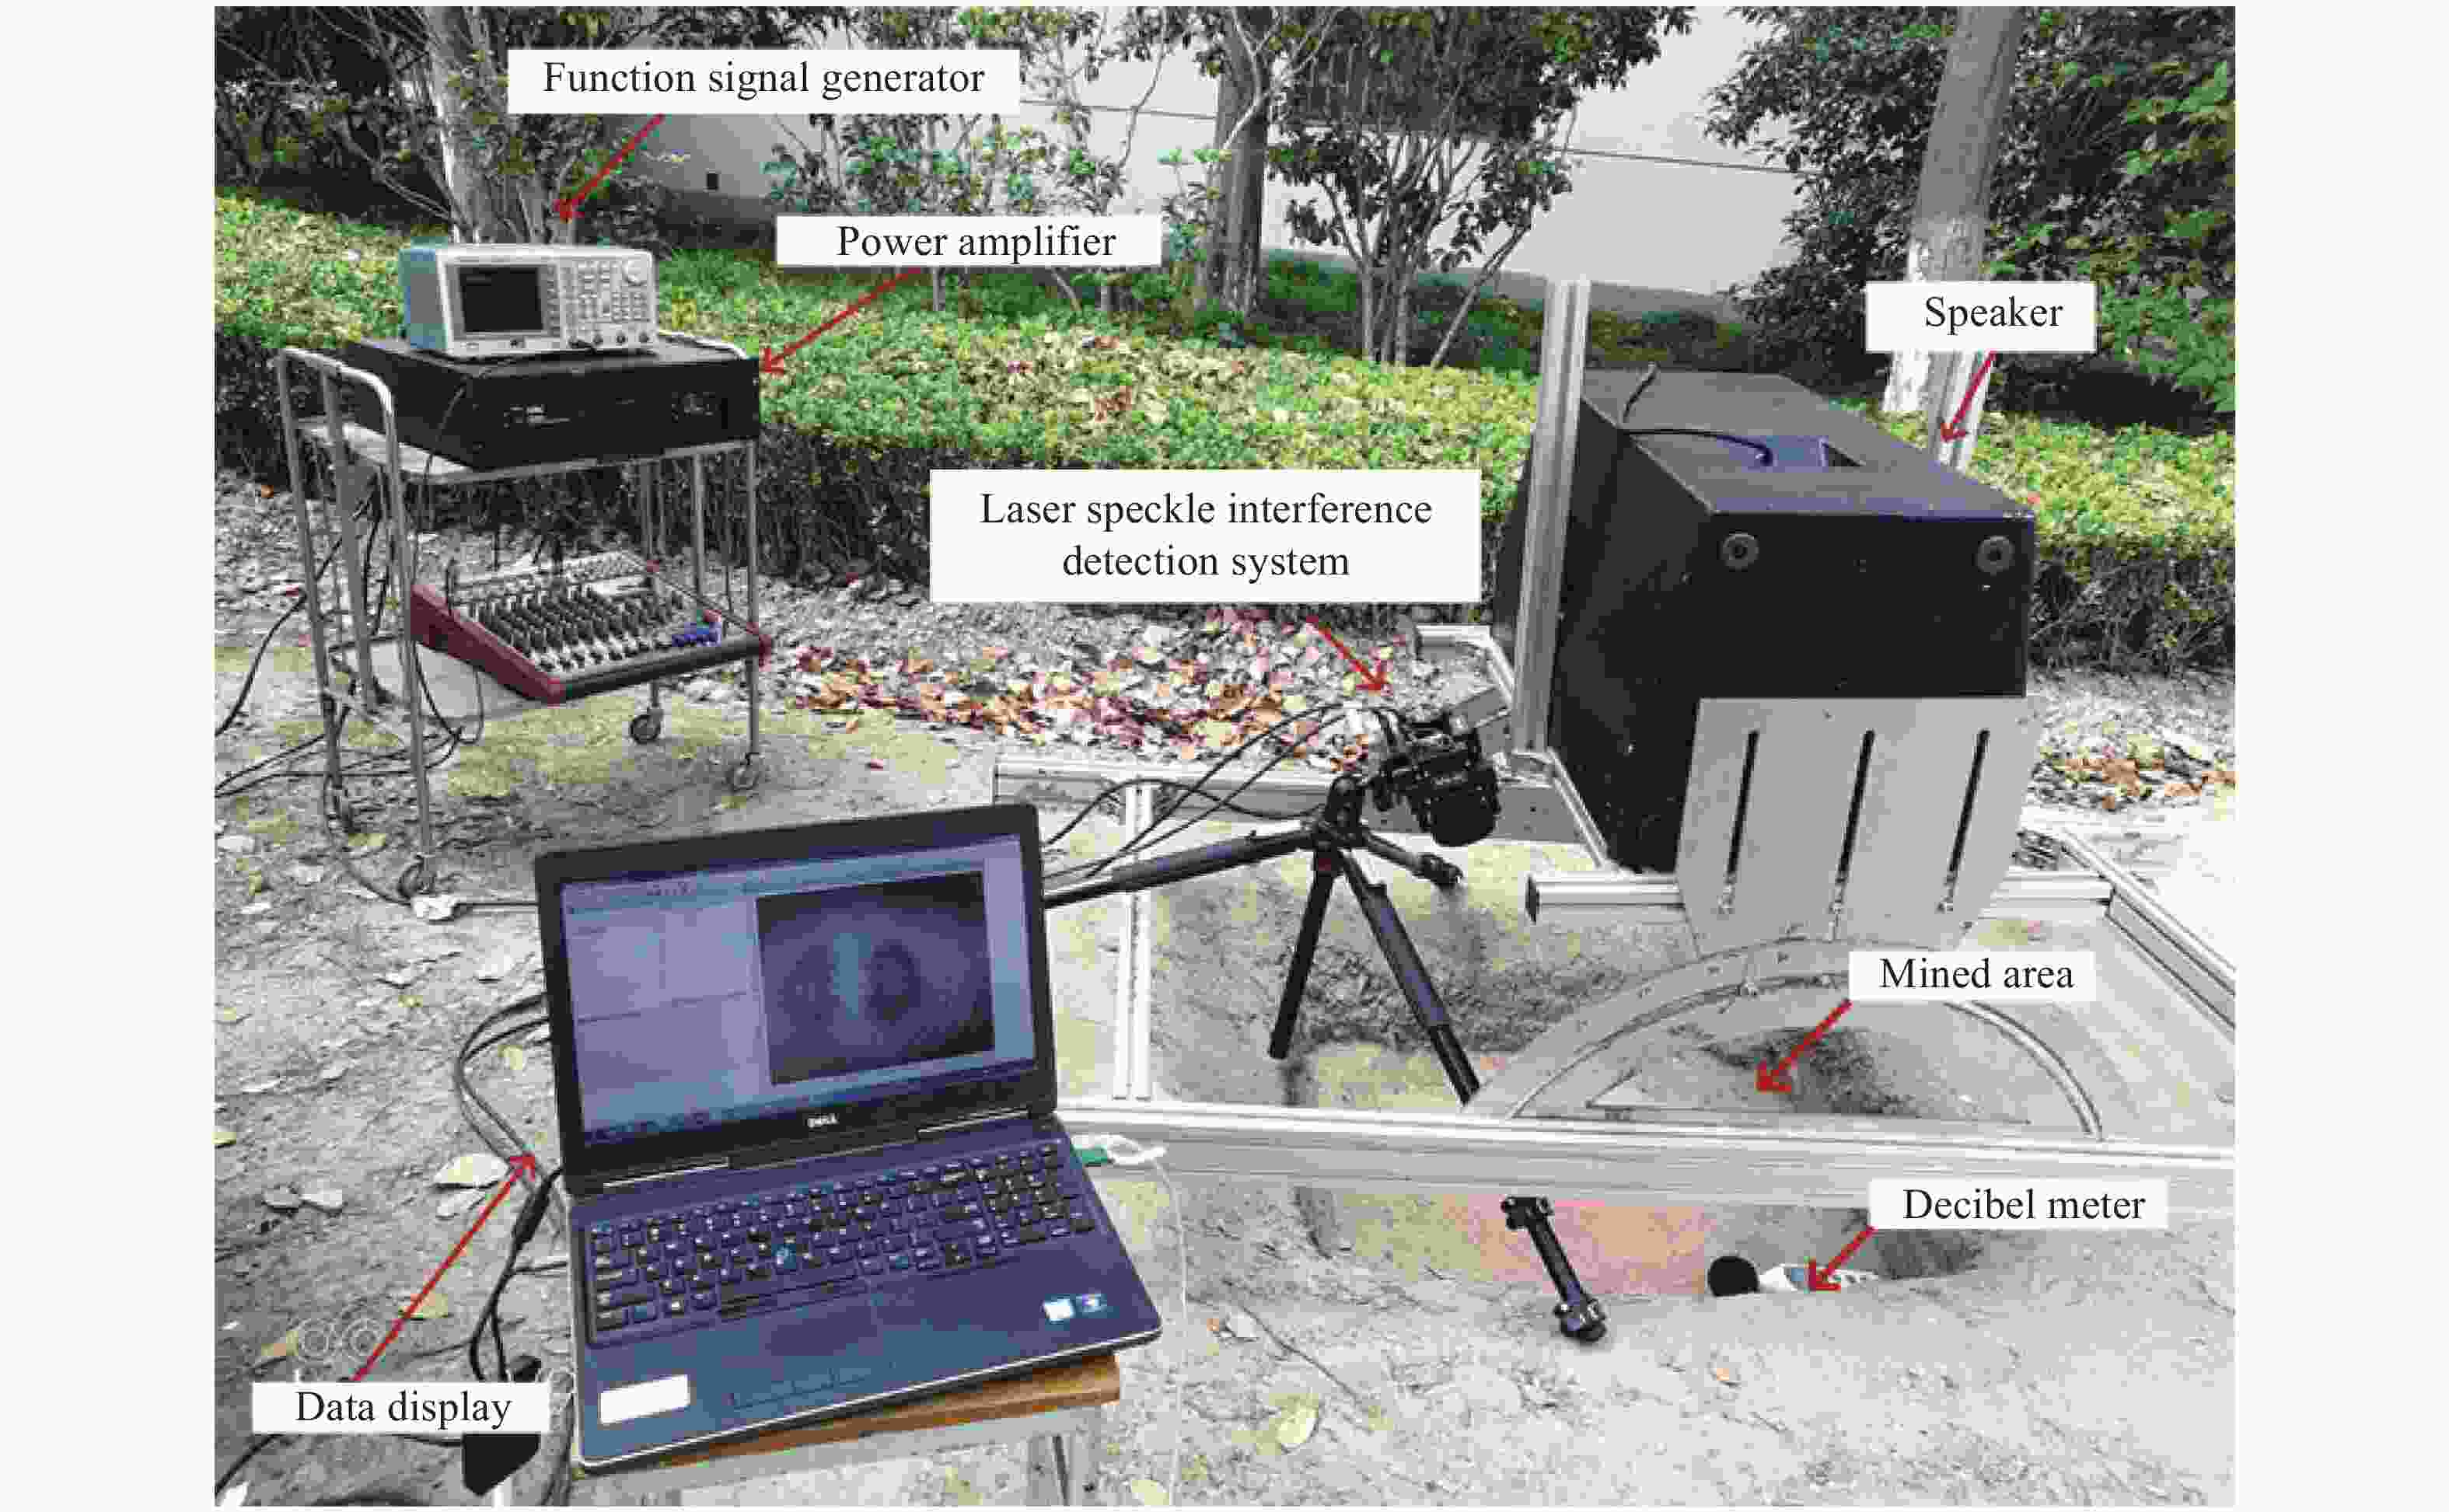
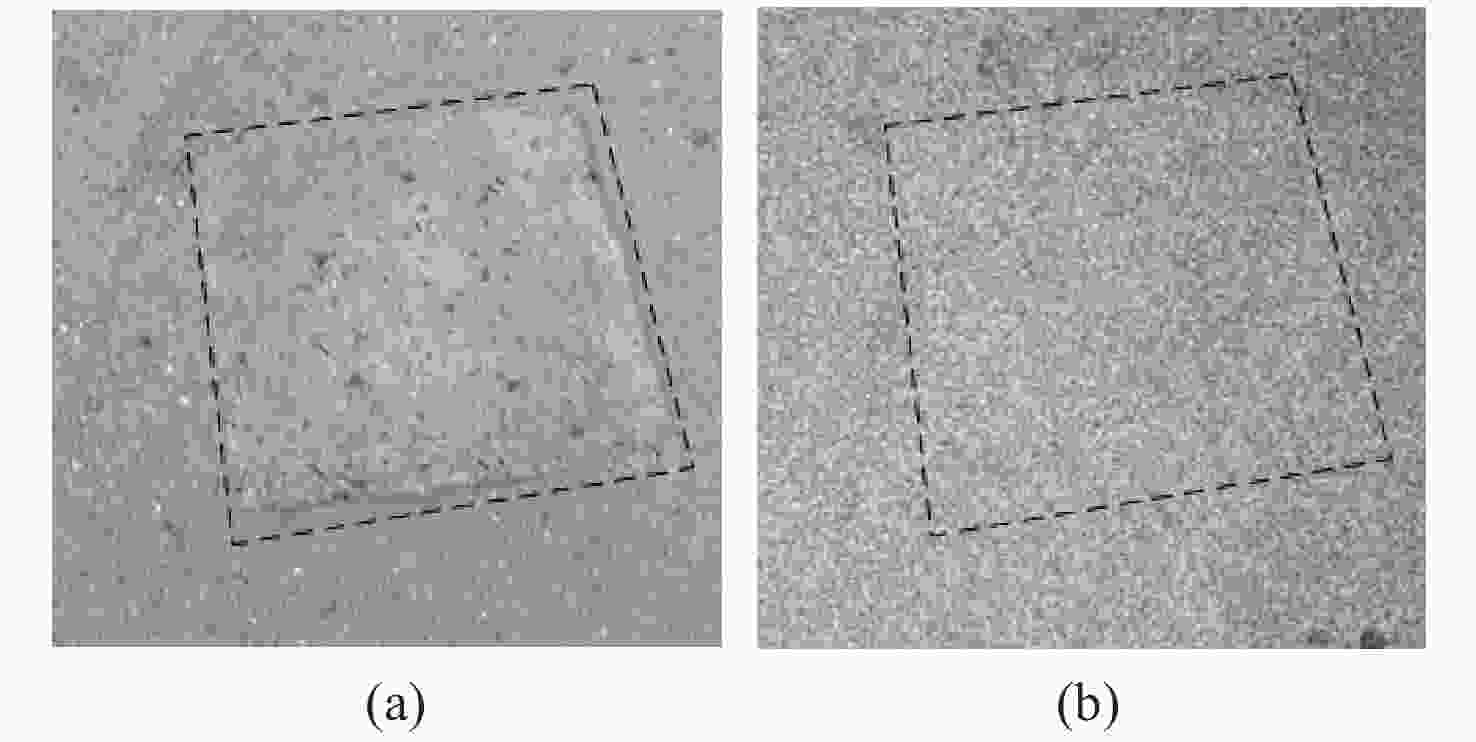
    For the purpose of carrying out experimental verification analysis, a landmine detection experimental system based on laser speckle measurement was built up as shown in Fig. 10. The sound source excitation system composed of a function signal generator, a speaker and a power amplifier were used to excite high-intensity low-frequency sound waves. The laser speckle interference detection system was used for speckle interference detection of surface vibrations. The decibel meter was used to measure the sound pressure level of the sound wave. The interference laser wavelength was 658 nm. The type-69 plastic case coach mine, the type-72 anti-personnel coach mine and the Brick were taken as the sample to be tested. The samples were buried in dry or wet sand at a depth of 2 cm. The shear amount δx was set to 12.122 mm in the x direction in all experiments, except for the experiment of the type-69 plastic case coach mine buried in wet sand wherein the shear amount was 10.935 mm. The frequencies of the sound were 110 Hz for the type-69 plastic case coach mine and 145 Hz for the type-72 anti-personnel coach mine and brick. The test results are shown in Fig. 11~15 (Color online).

    Figure  10.  Acousto-optic mine detection experimental system based on laser speckle measurement
    Figure  11.  (a) The type-69 plastic case coach mine in dry sand. Bessel fringes obtained with different excitation sound frequencies and different sound pressure levels. (b) 110 Hz, 100 dB; (c) 110 Hz, 95 dB; (d) 110 Hz, 90 dB
    Figure  12.  Bessel fringes of the type-69 plastic case coach mine in wet sand with different excitation sound frequencies and different sound pressure levels. (a) 110 Hz, 100 dB; (b) 110 Hz, 95 dB; (c) 110 Hz, 90 dB
    Figure  13.  (a) Type 72 anti-personnel coach mine, and it’s Bessel fringes obtained with different excitation sound frequencies and different sound pressure levels. (b) 145 Hz, 100 dB; (c) 145 Hz, 98 dB; (d) 145 Hz, 95 dB
    Figure  14.  (a) Brick in dry sand and (b) it’s speckle interferometer detection results obtained with the excitation sound frequency of 145 Hz and the sound pressure level of 100 dB
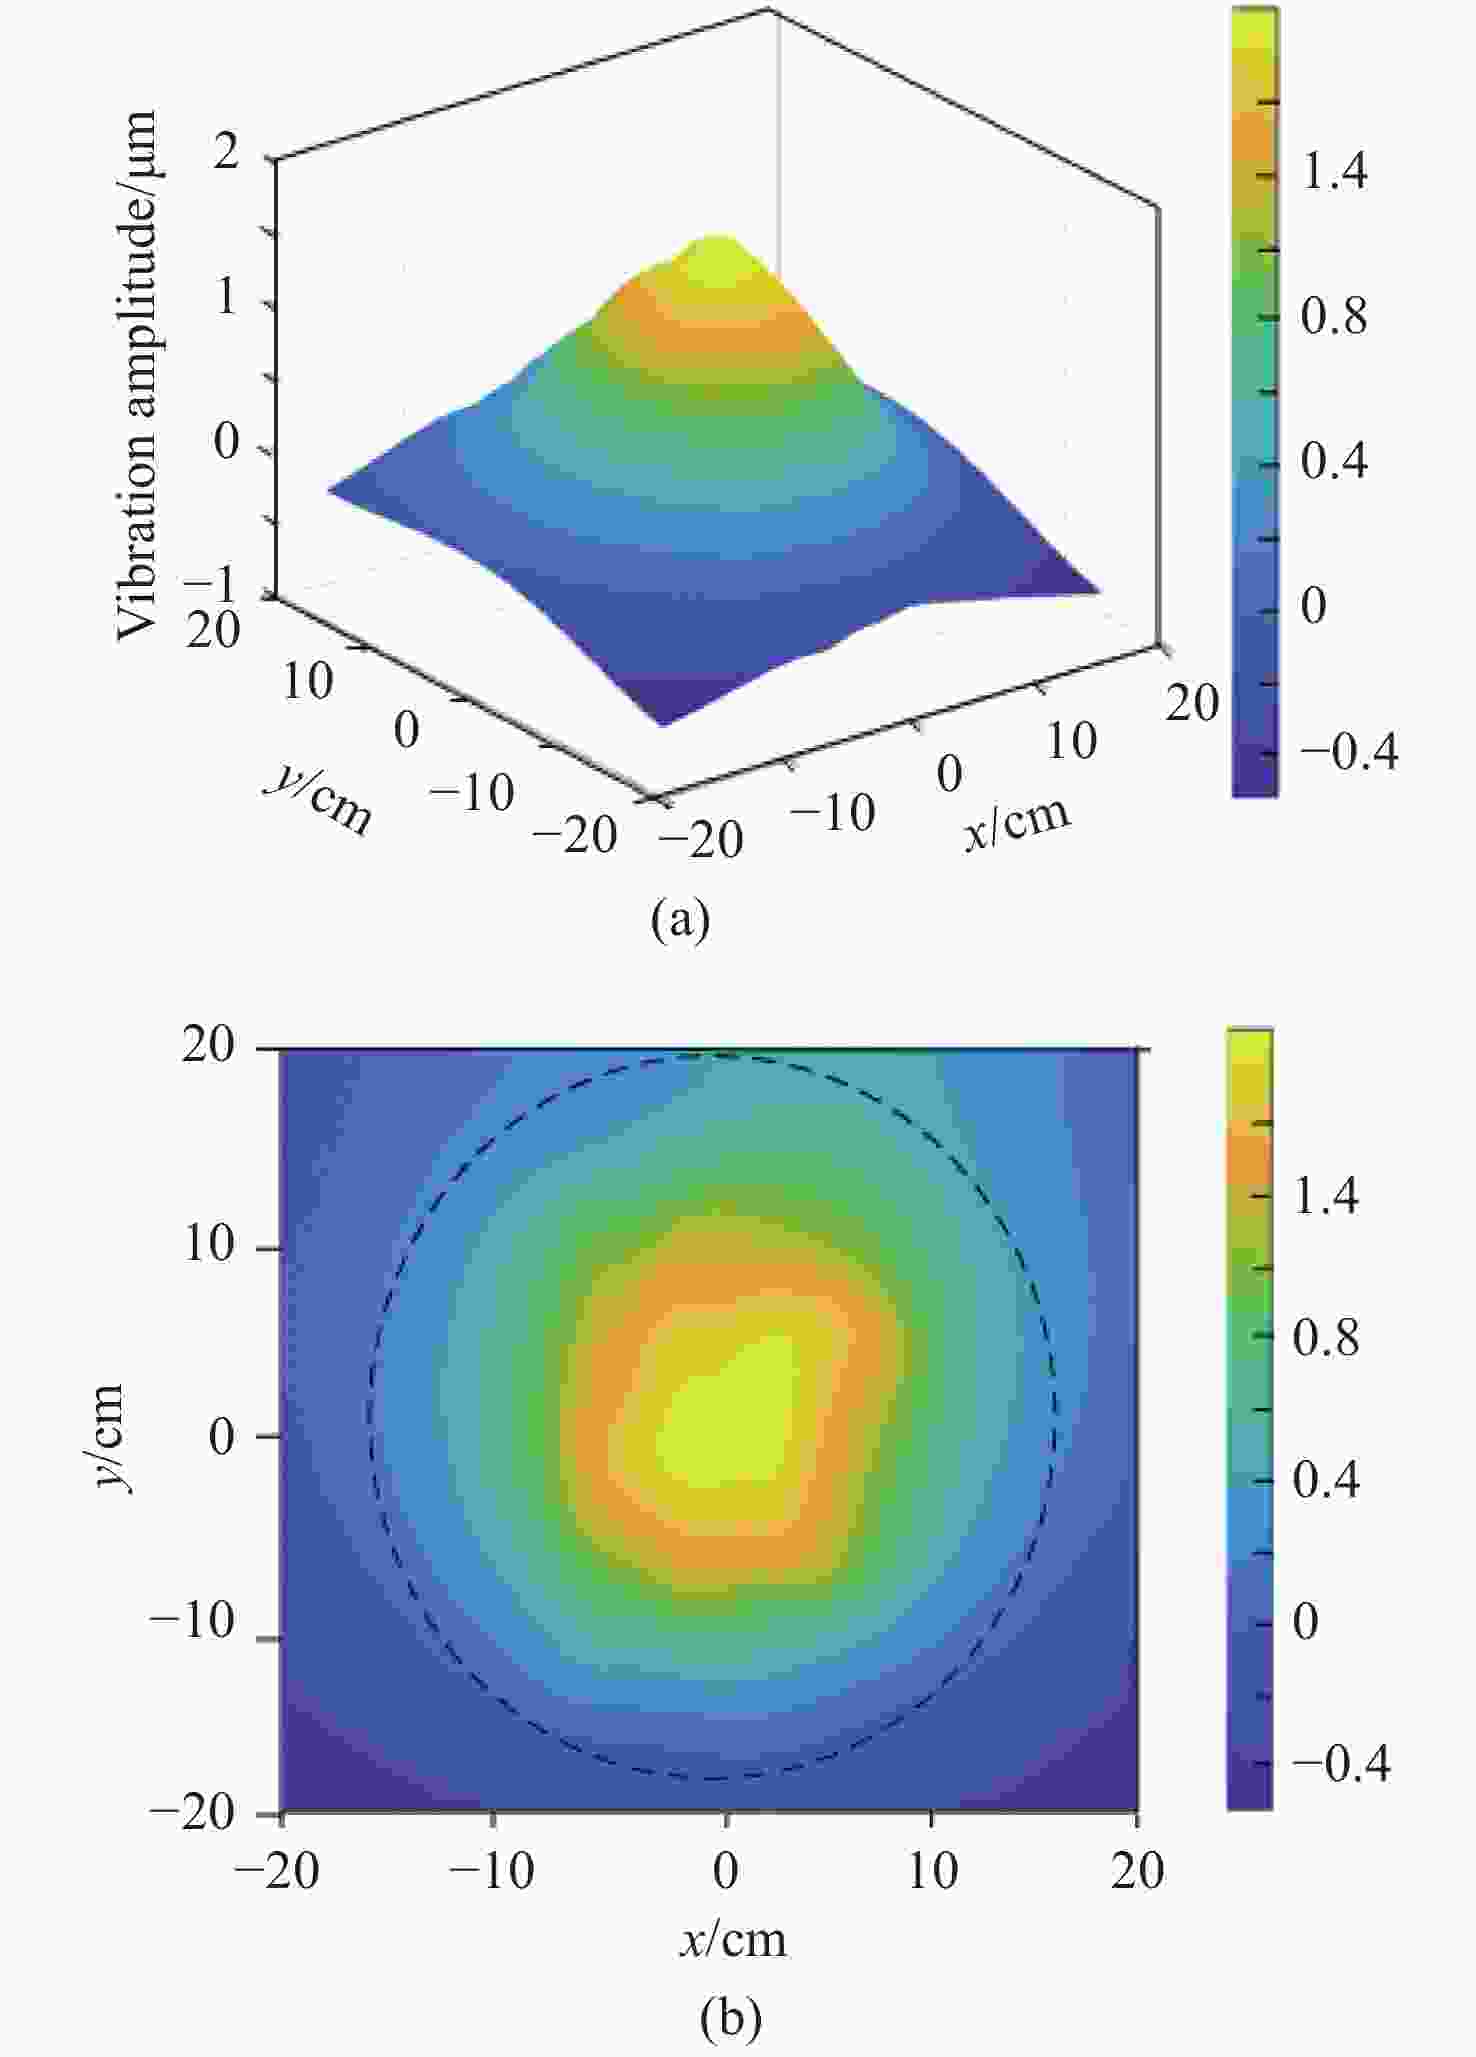
    Figure  15.  Vibration amplitude of the type-69 plastic case coach mine in dry sand with the excitation sound frequency of 110 Hz and the sound pressure level of 100 dB. (a) Three-dimensional vibration; (b) contour map

    As shown in Fig.11, the dotted circle indicates the mine burial area, and no Bessel fringe appears on the ground surface of the area where no landmine is buried. The Bessel fringes are symmetrical butterfly-shaped, which is quantitatively consistent with the theoretical analysis in Section 4. In addition, as the decibel value of the sound pressure level decreases, the deformation amplitude of the ground vibration decreases, the magnitude of change in the displacement gradient decreases, and the number of Bessel fringe levels decreases. The shape and change trend of the Bessel fringes in Fig.12 are consistent with those in Fig.11. In Fig.13, the fringe profile is gossip-like, and the number of Bessel fringe levels also decreases as the decibel value of the sound pressure level decreases. There is no fringe in the area where the brick was buried simultaneously (Fig.14). Therefore, Bessel fringes can reflect the mode shapes of landmines and the displacement gradient changes, which shows the feasibility of using laser speckle interference technology for coupled acoustic-to-seismic landmine detection. The detailed experimental steps and results can be seen in our previous research (Ref. [28]). A three-dimensional vibration mode diagram and contour map are recovered for the type-69 plastic case coach mine in dry sand after performing phase unwrapping (Fig.15). The black dotted line area is the likely location of the landmine. From Fig.15, we can see that the acoustic-to-seismic coupling vibration deformation occurs in the buried landmine area, which is consistent with the theory in Section 3. However, the experimental results only qualitatively verify the relationship between the modal vibration mode and the laser speckle interference signal, the mapping relationship between the mode shape and the Bessel fringe signal under the complex environment is the focus of the next research work.

    In this paper, the mapping relationship of laser speckle interference fringes is preliminarily established by analyzing landmine mode shapes. The derived mapping relationship shows that the different mode shapes of landmines correspond to the unique Bessel fringes. The Bessel fringes of two modes are simulated. It is verified by simulations that the displacement gradient change caused by mine vibration can generate Bessel fringes. The Bessel fringe series reflects the maximum displacement gradient generated by the vibration deformation. The maximum displacement gradient is increased by 0.4779 after changing from the (0,1) order mode to the (0,2) order mode, and the Bessel fringe order is increased from 2 to 6. The Bessel fringe shape reflects the entire vibration model. Due to the increase in pitch circle number from the order (0,1) mode to the order (0,2) mode, the Bessel fringe pattern changes from a simple pair of butterfly shapes to a combination of a symmetrical butterfly shape on the first pitch circle, and a circular looped stripe on the second pitch circle. Furthermore, experiments were carried out. Both the numerical and experimental results illustrate the theoretical conclusions, providing theoretical evidence for realizing the rapid scanning technology of acoustic-optics landmine detection. Thus, the Bessel fringe database corresponding to the mode shapes of different mines in different environments can be established, and it is feasible to realize the rapid scanning technology of acoustic-optics landmine detection.

  • Figure 1.  Analytical object and model of landmine’s multi-modal vibration characteristics. (a) Anti-tank plastic landmine; (b) equivalent cylindrical thin circular plate

    Figure 2.  Contour diagrams of landmine mode shapes. (a) (0,1) mode; (b) (0,2) mode; (c) (1,1) mode

    Figure 3.  Vibration deformation schematic diagram of the soil surface with and without landmine under the excitation of sound waves

    Figure 4.  The optical path of laser speckle interferometry measurement on the mode shapes of the landmine’s upper casing

    Figure 5.  Vibration diagram under (0,1) mode. (a) Three-dimensional vibration mode diagram; (b) contour map

    Figure 6.  Vibration diagram under (0,2) mode. (a) Three-dimensional vibration mode diagram; (b) contour map

    Figure 7.  Vibration displacement gradient change under the (0,1) mode. (a) Three-dimensional diagram of the displacement gradient change; (b) contour map

    Figure 8.  Vibration displacement gradient change under the (0,2) mode. (a) Three-dimensional diagram of displacement gradient change; (b) contour map

    Figure 9.  Mine modal shapes based on speckle interference fringes. (a) Under the (0,1) mode; (b) under the (0,2) mode

    Figure 10.  Acousto-optic mine detection experimental system based on laser speckle measurement

    Figure 11.  (a) The type-69 plastic case coach mine in dry sand. Bessel fringes obtained with different excitation sound frequencies and different sound pressure levels. (b) 110 Hz, 100 dB; (c) 110 Hz, 95 dB; (d) 110 Hz, 90 dB

    Figure 12.  Bessel fringes of the type-69 plastic case coach mine in wet sand with different excitation sound frequencies and different sound pressure levels. (a) 110 Hz, 100 dB; (b) 110 Hz, 95 dB; (c) 110 Hz, 90 dB

    Figure 13.  (a) Type 72 anti-personnel coach mine, and it’s Bessel fringes obtained with different excitation sound frequencies and different sound pressure levels. (b) 145 Hz, 100 dB; (c) 145 Hz, 98 dB; (d) 145 Hz, 95 dB

    Figure 14.  (a) Brick in dry sand and (b) it’s speckle interferometer detection results obtained with the excitation sound frequency of 145 Hz and the sound pressure level of 100 dB

    Figure 15.  Vibration amplitude of the type-69 plastic case coach mine in dry sand with the excitation sound frequency of 110 Hz and the sound pressure level of 100 dB. (a) Three-dimensional vibration; (b) contour map

    Table  1.   Simulation parameter setting

    ParameterSimulation settings
    Transverse stiffness ratio1000
    Poisson’s ratio:υ0.33
    Young’s modulus: E17×1019 Pa
    The radius of the landmine’s upper casing:a13.5 cm
    Laser wavelength:λ658 nm
    Shear amount:δx6 mm
    Image size512×512
    Mode(0,1) order, (0,2) order
    下载: 导出CSV
  • [1] WANG CH, MA H, LI J H, et al. Application of laser self-mixing vibration measurement technique in acoustic resonance landmine detection[J]. Optics and Precision Engineering, 2021, 29(4): 710-720. (in Chinese)
    [2] GUO T, JI M R, SHEN W, et al. The development of international equipments for non-metal landmine detection[J]. Equipment for Geotechnical Engineering, 2010, 11(6): 29-31,28. (in Chinese) doi: 10.3969/j.issn.1009-282X.2010.06.007
    [3] POPOV M O, STANKEVICH S A, MOSOV S P, et al. . Landmine detection with UAV-based optical data fusion[C]. IEEE Eurocon 2021-19th International Conference on Smart Technologies, IEEE, 2021: 175-178.
    [4] KHODOR M, MAKKI I, YOUNES R, et al. Landmine detection in hyperspectral images based on pixel intensity[J]. Remote Sensing Applications:Society and Environment, 2021, 21: 100468. doi: 10.1016/j.rsase.2021.100468
    [5] ABEDIN A F Z, IBRAHIM N, ZABIDI N A, et al. The perturbation of backscattered fast neutrons spectrum caused by the resonances of C, N and O for possible use in pyromaterial detection[J]. AIP Conference Proceedings, 2015, 1659(1): 030005.
    [6] JAMIL A K M, SIVANESAN A, IZAKE E L, et al. Molecular recognition of 2, 4, 6-trinitrotoluene by 6-aminohexanethiol and surface-enhanced Raman scattering sensor[J]. Sensors and Actuators B:Chemical, 2015, 221: 273-280. doi: 10.1016/j.snb.2015.06.046
    [7] GILLANDERS R N, GLACKIN J M, BABIĆ Z, et al. Biomonitoring for wide area surveying in landmine detection using honeybees and optical sensing[J]. Chemosphere, 2021, 273: 129646. doi: 10.1016/j.chemosphere.2021.129646
    [8] BIOT M A. Mechanics of deformation and acoustic propagation in porous media[J]. Journal of Applied Physics, 1962, 33(4): 1482-1498. doi: 10.1063/1.1728759
    [9] SABATIER J M, BASS H E, BOLEN L N, et al. Acoustically induced seismic waves[J]. The Journal of the Acoustical Society of America, 1986, 80(2): 646-649. doi: 10.1121/1.394058
    [10] SABATIER J M, BASS H E, BOLEN L N, et al. The interaction of airborne sound with the porous ground: the theoretical formulation[J]. The Journal of the Acoustical Society of America, 1986, 79(5): 1345-1352. doi: 10.1121/1.393662
    [11] XIANG N, SABATIER J M. An experimental study on antipersonnel landmine detection using acoustic-to-seismic coupling[J]. The Journal of the Acoustical Society of America, 2003, 113(3): 1333-1341. doi: 10.1121/1.1543554
    [12] DONSKOY D. Nonlinear seismo-acoustic landmine detection[J]. The Journal of the Acoustical Society of America, 2004, 115(5): 2382.
    [13] DONSKOY D, REZNIK A, ZAGRAI A, et al. Nonlinear vibrations of buried landmines[J]. The Journal of the Acoustical Society of America, 2005, 117(2): 690-700. doi: 10.1121/1.1850410
    [14] ZAGRAI A N, DONSKOY D M, EKIMOV A E. Resonance vibrations of buried landmines[J]. Proceedings of SPIE, 2004, 5415: 21-29. doi: 10.1117/12.540670
    [15] ZAGRAI A N, DONSKOY D M, EKIMOV A E. Structural vibrations of buried land mines[J]. The Journal of the Acoustical Society of America, 2005, 118(6): 3619-3628. doi: 10.1121/1.2108754
    [16] ALBERTS W, SABATIER J M, WAXLER R. Resonance frequency shift saturation in land mine burial simulation experiments[J]. The Journal of the Acoustical Society of America, 2006, 120(4): 1881-1886. doi: 10.1121/1.2338294
    [17] ZHANG Q K, ZHONG SH C, LIN J W, et al. High-performance optical coherence velocimeter: theory and applications[J]. Optics Express, 2019, 27(2): 965-979. doi: 10.1364/OE.27.000965
    [18] BURGETT R D, BRADLEY M R, DUNCAN M, et al. Mobile mounted laser Doppler vibrometer array for acoustic landmine detection[J]. Proceedings of SPIE, 2003, 5089: 665-672. doi: 10.1117/12.487186
    [19] VALEAU V, SABATIER J, COSTLEY R D, et al. Development of a time-frequency representation for acoustic detection of buried objects[J]. The Journal of the Acoustical Society of America, 2004, 116(5): 2984-2995. doi: 10.1121/1.1806824
    [20] WANG CH, DUAN N Y, WU ZH Q, et al. Method for detecting multi-modal vibration characteristics of landmines[J]. Instrumentation, 2018, 5(4): 39-45.
    [21] WU ZH Q, DUAN N Y, WANG CH, et al. Experimental study on acoustic-to-seismic landmine detection based on laser self-mixing interferometer[J]. Proceedings of SPIE, 2018, 10827: 108271W.
    [22] RAJESH K R, MURALI R, MOHANACHANDRAN R. Realisation of ultrasonic Doppler Vibrometer array for landmine detection[C]. 2012 IEEE International Ultrasonics Symposium Proceedings, IEEE, 2012: 1027-1030.
    [23] LI J H, MA H, YANG CH Y, et al. Research progress of the laser vibration measurement techniques for acoustic-to-seismic coupling landmine detection[J]. Chinese Optics, 2021, 14(3): 487-502. doi: 10.37188/CO.2020-0134
    [24] LV C C, WANG K F, GU G Q, et al. Accurate full-edge detection and depth measurement of internal defects using digital speckle pattern interferometry[J]. NDT &E International, 2019, 102: 1-8.
    [25] YAN P ZH, WANG Y H, SUN F Y, et al. Shearography for non-destructive testing of specular reflecting objects using scattered light illumination[J]. Optics &Laser Technology, 2019, 112: 452-457.
    [26] CHAO J, JING W C, XU T H, et al. Electronic speckle-shearing pattern interferometry for vibration analysis[J]. Nanotechnology and Precision Engineering, 2006, 4(1): 58-62.
    [27] GOODMAN J W. Introduction to Fourier Optics[M]. New York: The McGraw-Hill Companies, 1968.
    [28] ZHANG X Q, WANG CH, LI J H, et al. Use of laser speckle shearing interferometric vibration measurement system for acoustic-to-seismic landmine detection[J]. Optical Engineering, 2021, 60(8): 084102.
    [29] FRANCIS D, TATAM R P, GROVES R M. Shearography technology and applications: a review[J]. Measurement Science and Technology, 2010, 21(10): 102001. doi: 10.1088/0957-0233/21/10/102001
  • 期刊类型引用(0)

    其他类型引用(2)

  • 加载中
图(15) / 表(1)
计量
  • 文章访问数:  506
  • HTML全文浏览量:  391
  • PDF下载量:  85
  • 被引次数: 2
出版历程
  • 收稿日期:  2022-01-07
  • 修回日期:  2022-02-28
  • 网络出版日期:  2022-06-28

目录

/

返回文章
返回