


Determination of the content of ethanol in ethanol gasoline using mid-infrared spectroscopy
-
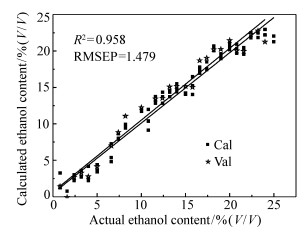
摘要: 乙醇汽油是一种新型清洁燃料,燃料乙醇在乙醇汽油中的含量会影响发动机的性能。为了确保发动机的工作可靠性,需要对乙醇汽油中的乙醇含量进行快速精准检测。本文使用中红外光谱技术对采集到的乙醇汽油的光谱数据进行定量分析。首先对原始光谱数据使用多元散射校正、基线校正、一阶导数、二阶导数等预处理方法进行预处理。然后利用ELM、LSSVM、PLS对乙醇汽油中的乙醇含量建立预测模型,通过比较3种建模方法对乙醇含量的预测能力发现,PLS方法的精度比其余两种方法更高。模型决定因子R2为0.958,预测均方误差RMSEP为1.479%(V/V,体积比)。中红外光谱技术对乙醇汽油乙醇含量的快速准确检测提供了新的思路。Abstract: Ethanol gasoline is a new type of clean fuel, and the content of fuel ethanol in ethanol gasoline affects the performance of the engine. In order to ensure the reliability of engine operation, the ethanol content of ethanol gasoline should be detected quickly and accurately. This paper uses mid-infrared spectroscopy to quantitatively analyze the collected spectral data of ethanol gasoline. First, the original spectral data were preprocessed using multiple scattering correction(MSC), baseline correction, first derivative, second derivative and other pretreatment methods. Then, the predictive model of ethanol content in ethanol gasoline is established using ELM, LSSVM and PLS. By comparing the predictive ability of the three modeling methods, it is found that the accuracy of PLS method is higher than the other two methods. The model determination factor R2 is 0.958, RMSEP is 1.479%(V/V, volume ratio). The mid-infrared spectroscopy provides a new idea for the rapid and accurate detection of ethanol content of in ethanol gasoline.
-

图 2 ELM对乙醇含量预测的散点图
Figure 2. Scatter plots of prediction results of ethanol content by ELM

图 3 LSSVM预测乙醇含量的散点图
Figure 3. Scatter plots of prediction results of ethanol content by LSSVM

图 5 PLS预测乙醇含量的散点图
Figure 5. Scatter plots of prediction results of ethanol content by PLS
表 1 30组乙醇汽油样品浓度
Table 1. Concentrations of 30 groups of ethanol gasoline samples
(%, V/V) 样品序号 浓度 样品序号 浓度 样品序号 浓度 1 0.8 11 9.0 21 17.4 2 1.6 12 10.0 22 18.2 3 2.4 13 10.8 23 19.0 4 3.2 14 11.6 24 20.0 5 4.0 15 12.4 25 20.8 6 5.0 16 13.2 26 21.6 7 5.8 17 14.0 27 22.4 8 6.6 18 15.0 28 23.2 9 7.4 19 15.8 29 24.0 10 8.2 20 16.6 30 25.0  下载: 导出CSV
表 2 ELM建立的乙醇汽油中乙醇含量的模型结果
Table 2. Prediction results of ethanol content in ethanol gasoline by ELM method
预处理方法 sin sig hardlim ib RMSEP/%
(V/V)R2 ib RMSEP/%
(V/V)R2 ib RMSEP/%
(V/V)R2 Original spectral 23 1.657 0.817 78 1.621 0.812 69 1.573 0.919 MSC 30 1.681 0.801 71 1.658 0.791 67 1.623 0.903 Baseline 24 1.630 0.862 64 1.608 0.869 47 1.631 0.896 1st derivatives 20 1.696 0.769 18 1.725 0.766 20 1.698 0.850 2nd derivatives 15 1.758 0.690 28 1.779 0.682 24 1.725 0.798
下载: 导出CSV
表 3 LSSVM建立的乙醇汽油中乙醇含量模型的预测结果
Table 3. Prediction results of ethanol content in ethanol gasoline by LSSVM model
预处理方法 Lin-kernel RBF-kernel γ RMSEP/%(V/V) R2 γ,σ2 RMSEP/%(V/V) R2 Original spectra 0.408 3.388 0.931 568 910, 148.13 2.332 0.945 MSC 0.011 3.725 0.891 42.358, 731.80 3.010 0.929 Baseline 0.124 3.620 0.928 16.416, 492.81 3.112 0.902 1st derivatives 1.875×10⁹ 3.271 0.893 1 267 600, 182 430 3.271 0.894 2nd derivatives 3.63×10⁹ 3.386 0.890 952 810, 560 680 3.386 0.891
下载: 导出CSV
表 4 PLS建立的乙醇汽油乙醇含量的模型结果
Table 4. Prediction results of ethanol content in ethanol gasoline by PLS model
预处理方法 因子数 校正集 预测集 相关系数 均方根误差/%(V/V) 相关系数 均方根误差/%(V/V) Original spectra 7 0.940 1.731 0.900 2.290 MSC 11 0.956 1.433 0.913 1.941 Baseline 7 0.963 1.417 0.958 1.479 1st derivatives 4 0.959 1.457 0.938 1.719 2nd derivatives 3 0.961 1.301 0.897 2.245
下载: 导出CSV
表 5 3种模型对比结果
Table 5. Comparison results of three kinds of models
预处理方法 建模方法 参数 R2 RMSEP/%(V/V) Original spectral ELM hardlim, ib=69 0.919 1.573 Original spectral LSSVM RBF, γ=5.69×10⁵, σ2=148.13 0.945 2.332 Baseline PLS Pc=7 0.958 1.479
下载: 导出CSV
-
[1] 苏会波, 林海龙, 李凡, 等.乙醇汽油对减少机动车污染排放的机理研究与分析[J].环境工程学报, 2015, 9(2):823-829. doi: 10.12030/j.cjee.20150252SU H B, LIN H L, LI F, et al.. Mechanism study and analysis on emission reduction of pollutants with ethanol gasoline[J]. Chinese J. Environment Engineering, 2015, 9(2):823-829.(in Chinese) doi: 10.12030/j.cjee.20150252 [2] 冯亦立.乙醇汽油与普通汽油的环保性比较[J].环境科技, 2009, 22(S1):124-127. http://www.doc88.com/p-73642370237.htmlFENG Y L. The environment characters compared between alcohols petrol and petrol[J]. Environmental Science and Technology, 2009, 22(S1):124-127.(in Chinese) http://www.doc88.com/p-73642370237.html [3] 郭瑞莲, 鲍晓峰, 岳欣, 等.车用乙醇汽油对发动机进气系统沉积物的影响[J].汽车工程, 2007, 29(8):642-644+691. doi: 10.3321/j.issn:1000-680x.2007.08.002GUO R L, BAO X F, YUE X, et al.. The influence of ethanol gasoline on deposit formation in intake system of the engine[J]. Automotive Engineering, 2007, 29(8):642-644+691.(in Chinese) doi: 10.3321/j.issn:1000-680x.2007.08.002 [4] 康建爽, 张璐妮, 蒋书波, 等.基于拉曼分析技术乙醇汽油辛烷值快速测定研究[J].化工自动化及仪表, 2010, 37(3):52-54. http://www.wenkuxiazai.com/doc/42f68547ad02de80d4d840d6.htmlKANG J SH, ZHANG L N, JIANG SH B, et al.. Rapid determination of octane number about ethanol gasoline based on Raman analysis technique[J]. Control and Instruments in Chemical Industry, 2010, 37(3):52-54.(in Chinese) http://www.wenkuxiazai.com/doc/42f68547ad02de80d4d840d6.html [5] CORSETTI S, ZEHENTBAUER F M, MCGLOIN D, et al.. Characterization of gasoline/ethanol blends by infrared and excess infrared spectroscopy[J]. Fuel, 2014, 141:136-142. http://www.sciencedirect.com/science/article/pii/S0016236114010205 [6] 陈彬, 武宏阳, 张贤明, 等.含微水绝缘油表面张力的中红外光谱检测[J].光学 精密工程, 2015, 23(9):2452-2458. http://kns.cnki.net/KCMS/detail/detail.aspx?filename=gxjm201509004&dbname=CJFD&dbcode=CJFQCHEN B, WU H Y, ZHANG X M, et al.. Detection on interfacial tension of insulating oil with trace water based on mid-infrared spectroscopy[J]. Opt. Precision Eng., 2015, 23(9):2452-2458.(in Chinese) http://kns.cnki.net/KCMS/detail/detail.aspx?filename=gxjm201509004&dbname=CJFD&dbcode=CJFQ [7] SEN I, OZTURK B, TOKATLI F, et al.. Combination of visible and mid-infrared spectra for the prediction of chemical parameters of wines[J]. Talanta, 2016, 161:130-137. doi: 10.1016/j.talanta.2016.08.057 [8] HU N P, WU D, CROSS K J, et al.. Structural basis of the H-1-nuclear magnetic resonance spectra of ethanol-water solutions based on multivariate curve resolution analysis of mid-infrared spectra[J]. Applied Spectroscopy, 2010, 64(3):337-342. doi: 10.1366/000370210790918373 [9] GUIMARAES E, GONTIJO L C, MITSUTAKE H, et al.. Quantification of ethanol in biodiesels using mid-infrared spectroscopy and multivariate calibration[J]. Industrial & Engineering Chemistry Research, 2014, 53(35):13575-13580. doi: 10.1021/ie502067h [10] ZHOU S, HAN Y L, LI B C. Simultaneous detection of ethanol, ether and acetone by mid-infrared cavity ring-down spectroscopy at 3.8μm[J]. Applied Physics B, 2016, 122(7):187. doi: 10.1007/s00340-016-6465-1 [11] ZHENG W B, FU X P, YING Y B. Spectroscopy-based food classification with extreme learning machine[J]. Chemometrics and Intelligent Laboratory Systems, 2014, 139:42-47. doi: 10.1016/j.chemolab.2014.09.015 [12] YANG L M, ZHANG S Y. A sparse extreme learning machine framework by continuous optimization algorithms and its application in pattern recognition[J]. Engineering Applications of Artificial Intelligence, 2016, 53:176-189. doi: 10.1016/j.engappai.2016.04.003 [13] LI S, DAI L K. Classification of gasoline brand and origin by Raman spectroscopy and a novel R-weighted LSSVM algorithm[J]. Fuel, 2012, 96(7):146-152. http://www.sciencedirect.com/science/article/pii/S0016236112000075 [14] 冯愈钦, 吴龙国, 何建国, 等.基于高光谱成像技术的长枣不同保藏温度的可溶性固形物含量检测方法[J].发光学报, 2016, 37(8):1014-1022. http://kns.cnki.net/KCMS/detail/detail.aspx?filename=fgxb201608019&dbname=CJFD&dbcode=CJFQFENG Y Q, WU L G, HE J G, et al.. Detection method of soluble solid of jujube at different preservative temperature based on hyper-spectral imaging technology[J]. Chinese J. Luminescence, 2016, 37(8):1014-1022.(in Chinese) http://kns.cnki.net/KCMS/detail/detail.aspx?filename=fgxb201608019&dbname=CJFD&dbcode=CJFQ [15] 刘燕德, 靳昙昙, 王海阳.基于拉曼光谱的三组分食用调和油快速定量检测[J].光学 精密工程, 2015, 23(9):2490-2496. http://kns.cnki.net/KCMS/detail/detail.aspx?filename=gxjm201509009&dbname=CJFD&dbcode=CJFQLIU Y D, JIN T T, WANG H Y, et al.. Rapid quantitative determination of components in ternary blended edible oil based on Raman spectroscopy[J]. Opt. Precision Eng., 2015, 23(9):2490-2496.(in Chinese) http://kns.cnki.net/KCMS/detail/detail.aspx?filename=gxjm201509009&dbname=CJFD&dbcode=CJFQ [16] 洪茜, 刘木华, 袁海超, 等.基于表面增强拉曼光谱的鸭肉中螺旋霉素残留检测[J].发光学报, 2015, 36(12):1464-1468. http://www.opticsjournal.net/abstract.htm?id=OJ150120000013SoUrXuHONG Q, LIU M H, YUAN H CH, et al.. Detection of spiramycin residue in duck meat based on SERS[J]. Chinese J. Luminescence, 2015, 36(12):1464-1468.(in Chinese) http://www.opticsjournal.net/abstract.htm?id=OJ150120000013SoUrXu [17] 陈云坪, 马伟, 王秀, 等.基于PLS的土壤养分与小麦产量空间相关关系研究[J].农业机械学报, 2012, 2:159-164. doi: 10.6041/j.issn.1000-1298.2012.02.031CHEN Y P, MA W, WANG X, et al.. Study on the correlation between yield and soil nutrients PLS space wheat[J]. Transactions of the Chinese Society of Agricultural Machinery, 2012, 2:159-164.(in Chinese) doi: 10.6041/j.issn.1000-1298.2012.02.031 [18] BITTANTE G, CECCHINATO A. Genetic analysis of the Fourier-transform infrared spectra of bovine milk with emphasis on individual wavelengths related to specific chemical bonds[J]. J. Dairy Science, 2013, 96(9):5991 http://www.ncbi.nlm.nih.gov/pubmed/23810593 -

 下载:
下载:


计量
- 文章访问数: 3381
- HTML全文浏览量: 1179
- PDF下载量: 527
- 被引次数: 0
