-
The diffusion coefficient is an important basic data for the study of mass transfer process, calculation of mass transfer rate, and chemical design and development. It is widely used in fields of chemical, pharmaceutical, food, biological and environmental protection fields[1-4]. Since the average distance between liquid molecules is much smaller than that of gas molecules, and the liquid molecules do not have regular arrangments like solids, the theoretical description and experimental measurement of the liquid phase diffusion coefficient are far more difficult than gas and solids. The liquid phase diffusion data of different systems is quite lacking[5-6]. At present, the liquid phase diffusion coefficient is mainly obtained by experimental methods. By measuring the concentration-dependent spatial and temporal distribution of the solution due to the diffusion process, the liquid phase diffusion coefficient is calculated according to Fick′s law[7] for describing the diffusion process. From the experimental method to measure the diffusion coefficient, the diaphragm pool method[8], optical interference method[9] and Taylor dispersion method[10] are widely used. In addition, measurement methods such as nuclear magnetic resonance[11], dynamic light scattering[12], fluorescent molecular tracing [13] and radioactive element tracing[14] can also be used. Diaphragm cell method[8] is a classical steady-state measurement method. This method measures the initial and steady state solution concentrations in the upper and lower parts of the diffusion cell, so the measurement time is longer.Optical interference method[9] measures interference fringes formed when target light and reference light meet in space, and inverts the spatial and temporal distribution information of diffusion solution concentration carried by the target light through fringes. The measurement accuracy of this method is high, but its requirements for the experimental environment are extremely demanding. The Taylor dispersion method[10] is to inject trace solute into the solvent flowing in the capillary. The solute diffuses in the solvent to form a Gaussian distribution of the solution concentration along the capillary axis. The diffusion coefficient is calculated by measuring the concentration distribution curves at different times. The method is fast, but the measurement accuracy is low. The NMR method[11] has the characteristics of anti-interference, fast speed, etc., but it is only suitable for measuring some special substances. The dynamic light scattering method[12] is suitable for the measurement of the diffusion coefficient of a polymer solution. There are other methods such as fluorescent molecular tracing[13] and radioactive element tracing[14]. However, they are not widely used. In order to solve these problems, according to the imaging principle of the liquid-core cylindrical lens focal plane, we proposed the equivalent RI(refractive index) method[15-16] and the instantaneous diffusion image analytical method[16-17] to measure the liquid-phase diffusion coefficient by analyzing the diffusion image. Spherical aberration is the main factor influencing the imaging quality of diffused images. The ability of the DLCL[18] to reduce the spherical aberration improves the imaging quality of the diffused image, and it is the key to accurately measure the liquid-phase diffusion coefficient. The front liquid core of the DLCL serves as a diffusion cell and the main imaging element, and the rear liquid core serves as an aplanatic auxiliary system[19-20]. In this paper, DLCL is used to reduce the spherical aberration at certain thin liquid layers as needed, and it can reduce the advantage of spherical aberration within a certain refractive index range. In this paper, the diffusion coefficients of different concentrations of aqueous sucrose solution at room temperature(25 ℃) are measured by combining the above two methods.
扩散系数是研究传质过程、计算传质速率及化工设计与开发的重要基础数据, 广泛应用于化工、医药、食品、生物及环保等领域[1-4]。由于液体分子的平均间距远比气体分子小, 又不及固体那样有规则排列, 所以液相扩散系数的理论描述和实验测量远比气体及固体困难, 不同体系的液相扩散数据相当缺乏[5-6]。目前, 液相扩散系数主要依靠实验方法获得, 通过测量溶液由于扩散过程形成的浓度随空间和时间的分布, 根据描述扩散过程的Fick定律[7]计算出液相扩散系数。从测量扩散系数的实验方法来看, 广泛采用的是膜池法[8]、光干涉法[9]和泰勒分散法[10]。此外, 还有核磁共振[11]、动态光散射[12]、荧光分子示踪[13]和放射性元素示踪[14]等测量方法。膜池法[8]是一种经典的稳态测量法, 需要测量扩散池上下两个部分初始及稳态时的溶液浓度, 测量时间较长。光干涉法[9]是测量目标光和参考光在空间相遇时形成的干涉条纹, 通过条纹反演出目标光携带的扩散溶液浓度的空间和时间分布信息, 该方法的测量精度较高, 但其对实验环境的要求极为苛刻。泰勒分散法[10]是将微量溶质注入在毛细管中流动的溶剂中, 溶质在溶剂中的扩散形成溶液浓度沿毛细管轴向的高斯分布, 通过测量不同时刻浓度的分布曲线计算出扩散系数, 该方法测量速度快, 但测量精度较低。核磁共振法[11]具有抗干扰, 测速快等特点, 但只适用于测量一些特殊物质。光散射法[12]适用于测量高分子溶液的扩散系数。另外, 还有荧光分子示踪[13]和放射性元素示踪[14]等方法, 但它们的使用并不广泛。为了解决这些问题, 我们根据液芯柱透镜焦平面成像原理, 提出了等折射率薄层移动法[15-16]和瞬态图像分析法[16-17], 通过分析扩散图像测量液相扩散系数。球差是影响扩散图像成像质量的主要因素, 双液芯柱透镜(DLCL)[18]减小球差的能力提高了扩散图像的成像质量, 是精确测量液相扩散系数的关键。DLCL的前液芯作为扩散池和主要成像元件, 后液芯作为消球差辅助系统[19-20]。本文利用DLCL可以按需减小特定液体薄层处的球差以及能够在一定的折射率范围内同时减小球差的优势, 结合两种方法分别测量了室温(25 ℃)下不同浓度蔗糖水溶液的扩散系数。
-
The experimental setup is shown in Fig. 1. Monochromatic parallel light(center wavelength λ=589 nm) is normally incident on the DLCL after slit width limiting. The front liquid core of the DLCL serves as a diffusion cell and the main imaging element, and the rear liquid core serves as an abatement assistant system. As an image acquisition system, a CMOS industrial camera is fixed on a one-dimensional electronic displacement stage with a minimum division value of 1 μm and connected to a computer. The diffusion process can be observed on a computer in real time.
实验装置如图 1所示。单色平行光(中心波长λ=589 nm)经狭缝限宽后垂直入射到DLCL上, DLCL的前液芯作为扩散池和主要成像元件, 后液芯作为消球差辅助系统。CMOS工业相机作为图像采集系统, 固定在一个最小分度值为1 μm的一维电子位移台上并与计算机相连, 在计算机上可实时观测扩散过程。
-
The imaging principle is shown in Fig. 2. A single solution with a refractive index of ni is injected into the front liquid core of DLCL, and a liquid with refractive index n′ is injected into the rear liquid core. The monochromatic parallel light passes through the lens perpendicular to the Z axis and the CMOS in the image focal plane of the cylindrical lens system will acquire a sharp focal line parallel to the Z axis, as shown in Fig. 2(a). Two different refractive index solutions are injected in the front liquid core one after another. After diffusion, the liquid forms a concentration gradient distribution of the refractive index along the axis of the cylindrical lens. Select a thin liquid layer refractive index nc, move CMOS to the image focal plane of the thin layer of refractive index, after the monochromatic parallel light passes through the cylindrical lens system, CMOS will collect a "beam waist" like diffusion image, as shown in Fig. 2(b). On the imaging plane, only the thin layer of liquid corresponding to the refractive index ni=nc is clearly imaged; when the refractive index ni=n1 < nc, the focal point is behind the imaging plane, which is called "under-focusing", the parallel light forms a dispersion line segment with a width of Σ1 on the imaging plane. When the refractive index ni=n2 > nc, the focal point position is in front of the imaging plane, which is called "over-focusing", and the parallel light forms a diffusion line segment with a width of Σ2 on the imaging plane.
成像原理如图 2所示。在DLCL的前液芯中注入折射率为ni的单一溶液, 后液芯注入折射率为n′的液体, 单色平行光垂直于Z轴通过透镜后, 位于柱透镜系统像方焦平面的CMOS将采集到一条平行于Z轴的明锐焦线, 如图 2(a)所示。在前液芯内先后注入两种不同折射率的溶液, 经扩散后, 液体沿柱透镜轴向形成折射率的某种浓度梯度分布。选定某一液体薄层折射率nc, 移动CMOS到该折射率薄层的像方焦平面上, 单色平行光经过柱透镜系统后, CMOS将采集到"束腰"状的扩散图像, 如图 2(b)所示。在成像平面上只有折射率ni=nc对应的液体薄层处清晰成像; 当折射率ni=n1 < nc时, 焦点位置在成像平面后, 即"欠聚焦", 平行光在成像平面上形成宽度为Σ1的弥散线段; 当折射率ni=n2 > nc时, 焦点位置在成像平面前, 即"过聚焦", 平行光在成像平面上形成宽度为Σ2的弥散线段。
-
The refractive index of the front liquid core of DLCL is ni, the refractive index of the rear liquid core is n′, and the focal length of the cylindrical lens system is fi. Based on the Gaussian formula of paraxial imaging, fi and ni satisfy the following recurrence relations[21-22]:
DLCL的前液芯液体折射率为ni, 后液芯液体折射率为n′, 柱透镜系统的焦距为fi, 基于近轴成像高斯公式, fi和ni满足如下递推关系[21-22]:
(1) (2) (3) (4) (5) (6) Where Ri and di are defined as shown in Fig. 3, R1=|R4|=45.0 mm, R2=|R3|=27.9 mm, R5=21.5 mm, R6=∞, respectively represent the curvature radius of the DLCL glass surfaces; d1=d4=4.0 mm, d2=d3=3.0 mm, d5=3.2 mm, d6=12.0 mm respectively represent the distance between each surface of the lens and the distance from each surface to the center of the lens; the solid lens that makes up DLCL is K9 glass, the refractive index n0=1.516 3. The focal length is measured by experiment. Substituting it into formulas (1)-(6), the refractive index ni of the liquid to be measured in the front liquid core can be inversely solved.
式中, Ri及di的定义如图 3所示, R1=|R4|=45.0 mm, R2=|R3|=27.9 mm, R5=21.5 mm, R6=∞, 分别表示DLCL各玻璃曲面的曲率半径值; d1=d4=4.0 mm, d2=d3=3.0 mm, d5=3.2 mm, d6=12.0 mm, 分别表示透镜各个面之间及距透镜中心的距离; 组成DLCL的固态透镜材料为K9玻璃, 折射率n0=1.516 3。用实验方法测量出焦距fi, 代入式(1)~(6)即可反解出前液芯中待测液体的折射率ni。
Taking "under focus" imaging as an example, a top view of the DLCL imaging light path is shown in Fig. 3. When monochromatic parallel light with a width of h passes through the cylindrical lens system perpendicularly and if the refractive index of the thin liquid layer is ni=nc, the monochromatic parallel light passes through the cylindrical lens and is clearly imaged on the imaging plane. The focal length of the cylindrical lens system is fc; When the refractive index of the thin liquid layeris ni < nc, a focal spot having a width Σi is formed on the focal plane of the focal length fc, and the focal length of the cylindrical lens is fi. The following formula is approximated by the geometric relations:
以"欠聚焦"成像为例, DLCL成像光路俯视图如图 3所示。当宽度为h的单色平行光垂直通过柱透镜系统, 液体薄层折射率ni=nc时, 单色平行光经柱透镜后在成像平面上清晰成像, 柱透镜系统焦距为fc; 液体薄层的折射率ni < nc时, 在焦距为fc的焦面上形成宽度为Σi的弥散斑, 柱透镜焦距为fi。由几何关系近似可得:
(7) The width Σi of a certain position of an image is measured by an experimental method, and the focal length fi of the corresponding thin liquid layer can be calculated according to formula (7). Substituting fi into formulas (1)-(6), the refractive index ni of the thin liquid layer can be calculated.
由实验方法测量出图像某一位置的宽度Σi, 即可根据式(7)算出对应液体薄层的焦距fi, 将fi代入式(1)~(6)即可算出液体薄层的折射率ni。
-
The diffusion of the two solutions along the cylindrical lens axis(Z-axis) is considered as a one-dimensional free diffusion process, assuming that the two diffusion solutions are A and B respectively, and the concentration of A in B is C, and the diffusion process of C along Z axis follows Fick′s second law[7]:
将两种溶液沿柱透镜轴向(Z轴)的扩散看做一维自由扩散过程, 假设两种扩散溶液分别为A和B, A在B中的浓度为C, C沿Z轴的扩散过程遵循Fick第二定律[7]:
(8) Where C(Z, t) represents the concentration at Z at time t, and D is the diffusion coefficient. Before diffusion(t < 0), the initial concentrations of the two solutions at both sides of the contact interface(Z=0) are C1 and C2, respectively, and the solution of equation (8) satisfies:
式中, C(Z, t)表示t时刻位置Z处的浓度, D是扩散系数。扩散开始前(t < 0), 两种溶液在接触界面(Z=0)两边的初始浓度分别是C1和C2, 式(8)的解满足:
(9) where
is a Gaussian error function. During the experimental operation, the initial contact interface Z0 is not a precise horizontal plane, so the selection of Z0 has a deviation ΔZ[15-16]. The relative position of the data acquisition point to Z0 is denoted as Zi, and the actual measurement position Z′i is corrected as Z′i=Zi-ΔZ. The relation between the solution concentration and the refractive index C(Z, t)=f[n(Z, t)] can be calculated by experiment. formulas (9) can be expressed as inverse error function:式中,
是高斯误差函数。在实验操作过程中, 最初的接触界面Z0不是一个精确的水平面, 所以Z0的选取存在偏差ΔZ[15-16]。数据采集点距Z0的相对位置记为Zi, 则实际测量位置Z′i修正为Z′i=Zi-ΔZ。溶液浓度和折射率之间的关系C(Z, t)=f[n(Z, t)]可由实验方法求出。则式(9)可用反误差函数表示为:(10) -
For a fixed diffusion system, the time from the start of diffusion to the recording of a certain diffuse image is denoted as t. The inverse error function
is a certain value after selecting a thin liquid layer with refractive index nc, record the position(Z′i) of the thin liquid layer at different times(t) during the diffusion process, a linear fitting of Z′i and
is performed to obtain an item coefficient k1, and the diffusion coefficient value can be calculatedas follows:对一固定扩散体系, 从扩散开始到记录某一幅扩散图像的时间记为t。选定折射率为nc的液体薄层后, 反误差函数
为一定值, 记录扩散过程中不同时刻(t)液体薄层清晰成像的位置(Z′i), 对Z′i与
进行线性拟合得到一次项系数k1, 即可计算出扩散系数值:(11) -
This method only needs to record an instantaneous diffusion image during diffusion, and the diffusion time t is constant. Recording the width of the image at different positions(Z′i) in the diffused image, the refractive index ni(Z′i, t) of the corresponding thin liquid layer can be calculated according to equations (1)-(7). ni(Z′i, t) is determined with the spatial distribution of Z′i, that is, Z′i and the inverse error function are a one-to-one correspondence. After the linear fitting of Z′i and the inverse error function, the coefficient k2 is obtained and the diffusion coefficient value can be calculated as follows:
瞬态法只需在扩散过程中记录一幅瞬态扩散图像, 其扩散时间t为常数, 记录扩散图像中不同位置(Z′i)处图像的宽度, 即可根据式(1)~(7)计算出对应液体薄层的折射率ni(Z′i, t), ni(Z′i, t)随Zi的空间分布是确定的, 即Z′i与反误差函数
是一一对应的函数关系。对Z′i与反误差函数进行线性拟合后得到一次项系数k2, 即可计算出扩散系数值(12) -
The diffusion coefficients of aqueous sucrose solution of 0.10, 0.30, 0.50 and 0.70 mol/L are measured at room temperature. First, different concentrations of aqueous sucrose solution are prepared, and the refractive index is measured with Abbe refractometer. The linear relationship between the aqueous sucrose concentration and the refractive index is fitted:C=f(n)=20.5082n-27.3387, linear correlation coefficient is R2=0.999 9.
实验测量了室温下浓度分别为0.10、0.30、0.50和0.70 mol/L的蔗糖水溶液的扩散系数。首先配置不同浓度的蔗糖水溶液, 用阿贝折射仪测量其折射率, 拟合出蔗糖水溶液浓度和折射率之间满足线性关系:C=f(n)=20.5082n-27.3387, 线性相关系数R2=0.999 9。
-
For the equivalent refractive index thin layer method, it is necessary to collect a plurality of diffusion images within a certain diffusion time, and the diffusion coefficient is calculated by recording the relationship of the focal position with time. Accurate judgment of the position of the clear imaging point of the thin layer of this refractive index is required by this method, and it is also required to reduce the spherical aberration at the thin layer of the refractive index. After the diffusion solution is injected into the front liquid core of DLCL and a refractive index thin layer (close to the refractive index of the liquid to be measured[23]) is selected, the relationship between the spherical aberration of the DLCL system and the refractive index of the rear liquid core is calculated at different refractive index thin layers. The calculation result is shown in the following figure.
等折射率薄层法需要在一定的扩散时间内采集多幅扩散图像, 通过记录焦点位置随时间的变化关系计算扩散系数。此方法需要准确判断折射率薄层清晰成像点的位置, 要求在该折射率薄层处减小球差。在DLCL的前液芯中注入扩散溶液, 选定折射率薄层(靠近待测液体折射率[23])后, 计算不同折射率薄层处DLCL系统球差与后液芯液体折射率的关系, 计算结果如图 4所示。
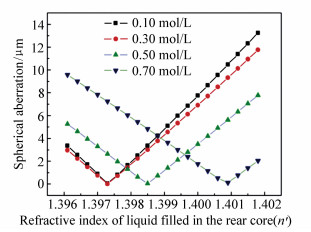
图 4 不同折射率薄层球差与后液芯液体折射率的关系
Figure 4. Relationship between the refractive index thin layer spherical aberration and the refractive index of the rear liquid core
The diffusion coefficients of aqueous sucrose solution of 0.10, 0.30, 0.50 and 0.70 mol/L are measured. The selected thin layers of refractive index are 1.3387, 1.3481, 1.3580, and 1.3676, respectively. If the calculated system spherical aberration is the minimal, the refractive index of the corresponding rear liquid core is 1.3973, 1.3973, 1.3985, and 1.4008, respectively.
测量浓度分别为0.10、0.30、0.50和0.70 mol/L蔗糖水溶液的扩散系数, 所选定的折射率薄层分别为1.338 7、1.348 1、1.358 0和1.367 6, 计算得到系统球差最小时, 对应的后液芯液体折射率分别为1.397 3、1.397 3、1.398 5和1.400 8。
Taking the diffusion coefficient of a 0.10 mol/L aqueous sucrose solution as an example, a 25 mm-high 0.90 mol/L aqueous sucrose solution is slowly injected with a digital syringe in the front liquid core of the DLCL and allowed to stand for 600 s to reduce liquid disturbance. Then, 0.10 mol/L aqueous sucrose solution is slowly injected, and corresponding best aplanatic liquid(n′=1.397 3) is injected into the rear liquid core. Adjust the displacement platform of the CMOS imaging system so that it is located on the focal plane of the selected thin liquid layer(nc=1.338 7). In order to reduce the effect of turbulence on the measurement of the liquid diffusion coefficient, a diffusion image is to be collected every 300 s after standing for 1 200 s. The diffusion image of 0.10-0.90 mol/L aqueous sucrose solution is shown in Fig. 5(only some experimental images are listed).
以测量0.10 mol/L蔗糖水溶液的扩散系数为例, 在DLCL的前液芯中, 用数字注射器缓慢注入25 mm高的0.90 mol/L蔗糖水溶液, 静置600 s以减小液面扰动后, 再缓慢注入0.10 mol/L蔗糖水溶液, 后液芯注入对应的最佳消球差液体(n′=1.397 3)。调节CMOS成像系统位移平台, 使其位于所选液体薄层(nc=1.338 7)的焦平面上, 为了减小紊流对测量液相扩散系数的影响, 静置1 200 s后每隔300 s采集一幅扩散图像。0.10→0.90 mol/L蔗糖水溶液的扩散图像如图 5所示(仅列出部分实验图像)。
Record the change of focus position(Z′i) with time(t) during the diffusion process of 0.10→0.90 mol/L aqueous sucrose solution. The experimental data is shown in Tab. 1.
表 1 等折射率薄层位置随时间演变记录
Table 1. Data record of equivalent refractive index location over time
t/s Z′i/μm t/s Z′i/μm 1 200 34.64 2 249.5 4 500 67.08 4 350.5 1 500 38.73 2 442.0 4 800 69.28 4 488.0 1 800 42.43 2 673.0 5 100 71.41 4 614.5 2 100 45.83 2 948.0 5 400 73.48 4 730.0 2 400 48.99 3 157.0 5 700 75.50 4 829.0 2 700 51.96 3 366.0 6 000 77.46 5 016.0 3 000 54.77 3 613.5 6 300 79.37 5 131.5 3 300 57.45 3 800.5 6 600 81.24 5 203.0 3 600 60.00 3 965.5 6 900 83.07 5 307.5 3 900 62.45 4 130.5 7 200 84.85 5 417.5 4 200 64.81 4 224.0 - - - 记录0.10→0.90 mol/L蔗糖水溶液扩散过程中焦点位置(Z′i)随时间(t)的变化, 实验数据如表 1所示。
Linear fitting is performed on the positions(Z′i) and
in Tab. 1, and the fitting result is Z′i=64.1 -36.6(correlation coefficient R2=0.998 6), the fitting result and f[nc(Z′i, t)] are substituted into equatin (11), the diffusion coefficient of 0.10 mol/L aqueous sucrose solution is calculated as D=4.82×10⁻⁶ cm2/s. The relative error to the literature value[24]Dlit=4.87×10⁻⁶ cm2/s is -1.03%.对表 1中位置(Z′i)和
进行线性拟合, 拟合结果为Z′i=64.1 -36.6(相关系数R2=0.998 6), 将拟合结果和f[nc(Z′i, t)]代入式(11), 即可计算出0.10 mol/L蔗糖水溶液的扩散系数D=4.82×10-6 cm2/s, 与文献值[24]Dlit=4.87×10⁻⁶ cm2/s的相对误差是-1.03%。With this method, the diffusion coefficients of other aqueous sucrose solutions is measured. The results are shown in Tab. 2.
表 2 不同浓度蔗糖水溶液等折射率薄层移动法数据
Table 2. Data of the equivalent refractive index method of aqueous sucrose solution for different concentrations
Concentration/
(mol·L-1)Fitting
result/μmCorrelation
coefficientD/
×10-6 cm2·s-1Dlit[24]/
×10-6cm2·s-1Relative
error/%0.30 Z′i=63.8 -36.90.999 5 4.22 4.26 -0.94 0.50 Z′i=51.7 -68.60.998 7 3.70 3.67 0.82 0.70 Z′i=42.9 -58.70.997 1 3.07 3.11 -1.29 用此方法测量其他浓度蔗糖水溶液的扩散系数, 结果如表 2所示。
-
For instantaneous method, a diffusion image at a certain moment is acquired, and the liquid-phase diffusion coefficient is quickly calculated by recording the width characteristics of the image at different locations. The experimental error of this method is mainly caused by the influence of spherical aberration on the image width, so it is necessary to reduce the spherical aberration over the entire refractive index range of the diffusion system. The diffusion solution is injected into the front liquid core of DLCL. Based on the refractive index range of the liquid of the front liquid core, the relationship between the sum of the spherical aberration of the DLCL system and the refractive index of the rear liquid core is calculated. The calculation results are shown in the following figure.
瞬态法只需在某一时刻采集一幅扩散图像, 通过记录不同位置处图像的宽度特征快速计算出液相扩散系数。此方法的实验误差主要由球差对图像宽度的影响造成, 所以要求在扩散体系的整个折射率范围内减小球差。在DLCL的前液芯中注入扩散溶液, 根据前液芯液体的折射率范围, 计算不同扩散体系DLCL系统球差之和与后液芯液体折射率的关系, 计算结果如图 6所示。
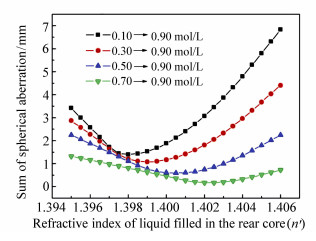
图 6 不同扩散体系球差之和与后液芯液体折射率的关系
Figure 6. Relationship between the sum of spherical aberrations of different diffusion systems and the refractive index of the rearliquid core
The refractive index ranges of 0.10→0.90 mol/L, 0.30→0.90 mol/L, 0.50→0.90 mol/L and 0.70→0.90 mol/L aqueous sucrose solution for different diffusion systems are 1.338 1-1.376 6, 1.347 5-1.376 6, 1.357 5-1.376 6 and 1.367 4-1.376 6, respectively. The corresponding optimal liquid core refractive indexes are calculated to be 1.398 0, 1.399 0, 1.400 5 and 1.402 3, respectively.
不同扩散体系0.10→0.90 mol/L、0.30→0.90 mol/L、0.50→0.90 mol/L和0.70→0.90 mol/L蔗糖水溶液的折射率范围分别为1.338 1~1.376 6、1.347 5~1.376 6、1.357 5~1.376 6和1.367 4~1.376 6, 计算得到对应的最佳后液芯液体折射率分别为1.398 0、1.399 0、1.400 5和1.402 3。
In the diffusion process of 0.10→0.90 mol/L aqueous sucrose solution, the thin liquid layer refractive index nc=1.338 9 is selected, and the corresponding liquid(n′=1.398 0) is injected into the rear liquid core. Taking the image acquired at the diffusion time t=2 400 s as an example, a number of sampling points are collected on the image, and the image width(Σi) and position(Z′i) of each sampling point are measured, as shown in Fig. 7. By substituting the image width into equations (1) and (2), the spatial refractive index(ni) at the corresponding position is calculated.
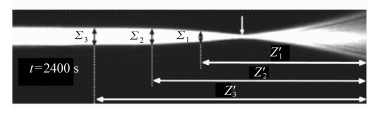
图 7 0.10→0.90 mol/L蔗糖水溶液的瞬态扩散图像
Figure 7. Transient diffusion image of 0.10→0.90 mol/L aqueous sucrose solution
在0.10→0.90 mol/L蔗糖水溶液的扩散过程中, 选定液体薄层折射率nc=1.338 9, 后液芯注入对应的液体(n′=1.398 0), 以扩散时间t=2 400 s时采集到的图像为例, 在图像上采集若干个采样点, 测量出各采样点的像宽(Σi)及位置(Z′i), 如图 7所示。将像宽代入公式(1)和(2)即可计算出对应位置处的空间折射率(ni)。
The position Z′i and the inverse error function in Tab. 3 are linearly fitted. The fitting result is Z′i=2198.1×erfinν({f[ni(Z′i, t)]-0.5}/0.4)-79.5(linear relationship R2=0.980 1). Substituting the first-order coefficient k2=2 196.1 into equation (12), the diffusion coefficient D=5.02×10⁻⁶ cm2/s of 0.10 mol/L aqueous sucrose solution can be calculated. The relative error to the literature value[24]Dlit=4.87×10⁻⁶ cm2/s.
表 3 2 400 s时刻折射率空间分布数据
Table 3. Refractive index spatial distribution data at 2400 s
Z′i/μm Σi/μm ni Ci erfinv 3 311.0 38.5 1.338 7 0.115 6 1.459 1 3 349.5 44 1.338 6 0.113 6 1.499 6 3 415.5 55 1.338 6 0.113 6 1.499 6 3 470.5 60.5 1.338 5 0.111 5 1.545 7 3 536.5 66 1.338 5 0.111 5 1.545 7 3 591.5 77 1.338 4 0.109 5 1.599 6 3 674.0 82.5 1.338 4 0.109 5 1.599 6 3 756.5 93.5 1.338 3 0.107 4 1.664 7 3 822.5 99 1.338 3 0.107 4 1.664 7 3 899.5 110 1.338 2 0.105 4 1.748 0 记录t=2 400 s时, 不同位置Z′i处扩散图像的宽度Σi, 并计算出液体薄层的浓度Ci(Z′i)和反误差函数值, 数据如表 3所示。
对表 3中的位置Z′i与反误差函数进行线性拟合, 拟合结果为Z′i=2198.1×erfinν({f[ni(Z′i, t)]-0.5}/0.4)-79.5(线性关系R2=0.980 1), 将一次项系数k2=2 196.1代入式(12), 即可计算出0.10 mol/L蔗糖水溶液的扩散系数D=5.02×10-6 cm2/s, 与文献值[24]Dlit=4.87×10⁻⁶ cm2/s的相对误差是3.08%。
This method measures the diffusion coefficient of other concentrations of aqueous sucrose solution. The measurement results are shown in Tab. 4, and the inverse error function is represented by x in the fitting result.
表 4 不同浓度蔗糖水溶液瞬态法数据
Table 4. Data of transient methods for different concentrations of aqueous sucrose solution
Concentration/
(mol·L-1)Fitting
result/μmCorrelation
coefficientD/
×10-6 cm2·s-1Dlit[24]/
×10-6cm2·s-1Relative
error/%0.30 Z′i=2049.6x-59.8 0.970 6 4.38 4.26 2.82 0.50 Z′i=1908.2x-44.9 0.976 7 3.79 3.67 3.27 0.70 Z′i=1761.1x-69.2 0.977 9 3.23 3.11 3.86 此方法测量其他浓度蔗糖水溶液的扩散系数, 测量结果如表 4所示, 反误差函数在拟合结果中用x表示。
-
The experimental error of the equivalent refractive index thin liquid layer method is mainly caused by the reading error of the focus position. Due to the depth of focus, strictly speaking, the image at the focus position is not an image point but has a certain length. Taking the diffusion coefficient of 0.10 mol/L aqueous sucrose solution as an example, when the refractive index thin layer ni=1.338 7 is calculated from the refractive index law, the geometric focal depth[25] of the DLCL system is 88.0 μm, i.e. 16 pixels(the size of a pixel is 5.5 μm), the position(Z′i) in Tab. 1 is from -44 μm(-8 pixels) to 44 μm(8 pixels), and the length of the entire number of pixels is randomly added to calculate the diffusion coefficient. The diffusion coefficient Drdm=4.78×10⁻⁶ cm2/s is randomly calculated. The relative error between the diffusion coefficient Drdmand the diffusion coefficient D=4.82×10⁻⁶ cm2/s calculated by directly reading the focus position is -1.0%.
等折射率薄层法的实验误差主要由焦点位置的读数误差引起, 由于焦深的存在, 焦点位置处的图像不是严格的一个像点而是具有一定的长度。以测量0.10 mol/L蔗糖水溶液的扩散系数为例, 由折射率定律计算出折射率薄层ni=1.338 7时, DLCL系统的几何焦深[25]为88.0 μm, 即16个像元(一个像元的大小为5.5 μm), 对表 1中位置(Z′i)由-44 μm(-8个像元)到44 μm(8个像元)之间, 随机加入整像元个数的长度, 计算其扩散系数。随机计算得到扩散系数Drdm=4.78×10⁻⁶ cm2/s, 与直接读取焦点位置计算得到的扩散系数D=4.82×10⁻⁶ cm2/s的相对误差为-1.0%。
The experimental error of the instantaneous diffusion image analytical method is mainly caused by the influence of spherical aberration on the image width. Taking the diffusion coefficient of a 0.10 mol/L aqueous sucrose solution as an example, the refractive index of the liquid thin layer is nc=1.338 9, and the spherical aberration of the image in the refractive index range ni=1.338 1~1.338 9 is calculated to be less than 2.0 μm, which is less than the size of one pixel. Calculate the diffusion coefficient by randomly adding -5.5 μm, 0, and to the image width(Σi) in Tabl.3. The diffusion coefficient Drdm=4.71×10⁻⁶ cm2/s is randomly calculated. The relative error between the diffusion coefficient Drdm and the diffusion coefficient D=5.02×10⁻⁶ cm2/s calculated by directly reading the image width is -6.2%.
瞬态法实验误差主要由球差对图像宽度的影响造成。以测量0.10 mol/L蔗糖水溶液的扩散系数为例, 液体薄层折射率nc=1.338 9, 计算出折射率范围ni=1.338 1~1.338 9内图像的球差小于2.0 μm, 小于一个像元的大小。对表 3中图像宽度(Σi)随机加上-5.5 μm、0和5.5 μm, 计算其扩散系数。随机计算得到扩散系数Drdm=4.71×10⁻⁶ cm2/s, 与直接读取图像宽度计算得到的扩散系数D=5.02×10⁻⁶ cm2/s的相对误差为-6.2%。
-
In this paper, the diffusion coefficient of aqueous solutions of different concentrations of aqueous sucrose solution at room temperature is measured using DLCL which is independently designed and processed. The front liquid core of the DLCL serves as a diffusion cell and a main imaging element, and the rear liquid core serves as an aplanatic auxiliary system. According to the refractive index of the liquid in the front liquid core, the solution of the appropriate refractive index is added in the rear liquid core, so that the cylindrical lens system can eliminate spherical aberration at different refractive index positions, or simultaneously decrease spherical aberration in a larger refractive index range. Based on this advantage, the liquid diffusion coefficients are measured by combining the equivalent refractive index thin liquid layer method and the instantaneous diffusion image analytical method. The relative errors between the measured results and the literature values of the two methods are less than 1.3% and 3.9%, respectively. Finally, the error analysis of the two methods is performed. The experimental error of the first method is mainly raised by the reading error of the focus position, and the reading error may cause a relative deviation of 1.0%. The experimental error of the second method is mainly caused by the influence of spherical aberration on the image width, and the spherical aberration of one pixel may cause a relative deviation of 6.2% when reading the image width. The results show that the measurement system is stable and reliable, and the measurement result is accurate when the liquid-phase diffusion coefficient is measured with DLCL. The capability of DLCL to reduce the spherical aberration improves the imaging quality of the diffusion image and plays a key role in accurately measuring the liquid diffusion coefficient.
本文利用自主设计加工的DLCL测量了室温下不同浓度蔗糖水溶液的扩散系数。DLCL的前液芯作为扩散池和主要成像元件, 后液芯作为消球差辅助系统。根据前液芯中液体的折射率, 在后液芯中放入适当折射率的溶液, 可实现柱透镜系统在不同折射率位置处消球差, 或在较大的折射率范围内同时减小球差。利用这一优势, 结合等折射率薄层移动法和瞬态图像分析法测量液相扩散系数, 两种方法的测量结果与文献值的相对误差分别小于1.3%和3.9%。最后对两种方法进行了误差分析, 第一种方法的实验误差主要由焦点位置的读数误差引起, 读数误差可能引起1.0%的相对偏差。第二种方法的实验误差主要由球差对图像宽度的影响引起, 读取图像宽度时一个像元的球差可能引起6.2%的相对偏差。结果表明, 用DLCL测量液相扩散系数时, 测量系统稳定可靠, 测量结果准确, DLCL减小球差的能力提高了扩散图像的成像质量, 是精确测量液相扩散系数的关键。
全文HTML
引言
实验装置
测量原理
3.1.
Imaging principle
成像原理
3.2.
Method for calculating the spatial distribution of refractive index
折射率空间分布的计算方法
3.3.
Method for calculating the liquid phase diffusion coefficient
液相扩散系数的计算方法
3.3.1.
Equivalentrefractive index thin layer transfer method
等折射率薄层移动法
3.3.2.
Refractive index spatial distribution instantaneous method
折射率空间分布瞬态法
测量结果与分析
4.1.
Measurement results of equivalent refractive index method
等折射率薄层法测量结果
4.2.
Instantaneous method measurement results
瞬态法测量结果
4.3.
Error analysis
误差分析
结论