


Fast recognition and classification of tetrazole compounds based on laser-induced breakdown spectroscopy and raman spectroscopy
-
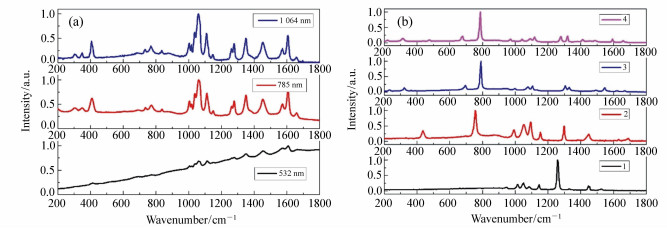
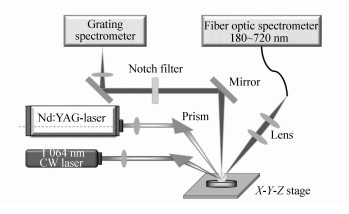
摘要: 为了实现对四唑类化合物的快速非接触识别和分类,本文搭建了激光诱导击穿光谱和拉曼光谱集成测试系统。首先采集了4种四唑类化合物在1 064 nm激发波长下的拉曼光谱,包括四氮唑、5-氨基四氮唑、1,5-二氨基四氮唑和1-甲基-5-氨基四氮唑。通过对特定官能团拉曼峰位的分析,成功地将它们鉴别出来。然后基于激光诱导击穿光谱(LIBS)技术,采集各个样本的等离子体辐射光谱。选取140组光谱数据进行训练,建立分类模型,剩余60组数据对所得的类型区域的准确性进行验证。本文基于主成分分析(PCA)与支持向量机(SVM)相结合的算法,建立了两个分类模型。一是将全谱进行主成分分析,选取前64个主成分,利用支持向量机(SVM)算法建立模型。二是通过对比光谱差异,选取10个特征波长进行主成分分析,选取前3个主成分建立模型。发现前者平均预测准确度只有88.3%,而后者60个光谱样本点全部落在其对应的标准样品类型区域内,分类准确度达到100%。实验结果表明,将激光诱导击穿光谱和拉曼光谱联合使用,可以准确地鉴别四唑类化合物。Abstract: In order to achieve fast non-contact recognition and classification of tetrazoles, an integrated system of laser-induced breakdown spectroscopy(LIBS) and Raman spectroscopy was established. First, the Raman spectra of four tetrazolium compounds, including tetrazolium, 5-aminotetrazol, 1, 5-diaminodiazole and 1-methyl-5-aminotetrazol were collected at an excitation wavelength of 1 064 nm. By analyzing the Raman shift of specific functional groups, they were successfully identified. The plasma radiation spectrum of each sample was collected based on LIBS technology. 140 sets of spectral data were selected for training and a classification model was established. The accuracy of the type area was verified by the remaining 60 sets of data. In this paper, two classification models were established based on PCA(Principal Component Analysis) and SVM(Support Vector Machine). On the one hand, the full spectra were used for PCA. The first 64 principal components were selected and the model was established using an SVM algorithm. On the other hand, 10 characteristic wavelengths were selected for PCA by comparing spectral differences and the first three were selected to establish the model. It was found that the average prediction accuracy of the former is only 88.3%, while the 60 spectral sample points of the latter are all located in the corresponding standard sample type area. The classification accuracy meets 100%. Experimental results show that the combination of LIBS and Raman spectroscopy can accurately identify tetrazole compounds.
-

图 4 前3个主成分对原始数据的解释率及累计解释率
Figure 4. Individual interpretation rate(left, bar graph) and cumulative interpretation rates(right, line) of the first three principal components to the original data

图 5 前3个主成分的三维得分图
Figure 5. Scoreplot of the tetrazole compounds samples′ LIBS spectra with respect to the first three principal components
表 1 四唑类化合物的主要信息
Table 1. Main information of tetrazole compounds
Code Compounds Molecular formula Chemical structure No.1 Tetrazolium CH2N4 
No.2 5-aminotetrazolium CH3N5 
No.3 1, 5-diaminodiazole CH4N6 
No.4 1-methyl-5-aminotetrazoliu C2H5N5 
 下载: 导出CSV
表 2 基于特征变量降维的四唑类化合物分类结果
Table 2. Classification results of tetrazole compounds based on dimension reduction of characteristic variables
Variable Number Predictive variable Accuracy/% No.1 No.2 No.3 No.4 No.1 15 15 0 0 0 100 No.2 15 0 15 0 0 100 No.3 15 0 0 15 0 100 No.4 15 0 0 0 15 100
下载: 导出CSV
表 3 基于全谱降维的四唑类化合物分类结果
Table 3. Classification results of tetrazole compounds based on dimension reduction of full spectrum
Variable Number Predictive variable Accuracy/% No.1 No.2 No.3 No.4 No.1 15 9 6 0 0 60 No.2 15 0 14 1 0 93.3 No.3 15 0 0 15 0 100 No.4 15 0 0 0 15 100
下载: 导出CSV
-
[1] 彭蕾, 李玉川, 杨雨璋, 等.双环和多环四唑含能化合物的合成研究进展[J].有机化学, 2012, 32(4):667-676. http://d.old.wanfangdata.com.cn/Periodical/yjhx201204004PENG L, LI Y CH, YANG Y ZH, et al.. Research progress in synthesis of energetic compounds of bicyclo-and multicyclo-tetrazoles[J]. Chinese Journal of Organic Chemistry, 2012, 32(4):667-676.(in Chinese) http://d.old.wanfangdata.com.cn/Periodical/yjhx201204004 [2] UCHIYAMA Y, DOLPHIN J S, HARLOW R L, et al.. The zwitterionic structure of the parent amidinium tetrazolide and a rare tetrazole ring-opening reaction[J]. Australian Journal of Chemistry, 2013, 67(3):405-410. http://www.wanfangdata.com.cn/details/detail.do?_type=perio&id=9a3dc7b4566d5801bba4b80500a7815d [3] SAVOLAINEN M A, HAN X P, WU J. Regio selective formal hydroamination of styrenes with 1-phenyl-1H-tetrazole-5-thiol[J]. Organic Letters, 2014, 16(17):4349-4351. doi: 10.1021/ol5020416 [4] 张悦阳, 冯永安, 张博, 等.一水合双四唑乙烷氨基胍的制备及性能研究[J].火炸药学报, 2016, 39(5):74-78. http://d.old.wanfangdata.com.cn/Periodical/hzyxb201605012ZHANG Y Y, FENG Y A, ZHANG B, et al.. Preparation and properties of bitetrazolyethane aminoguanidine[J]. Chinese Journal of Explosives & Propellants, 2016, 39(5):74-78.(in Chinese) http://d.old.wanfangdata.com.cn/Periodical/hzyxb201605012 [5] ZHANG W, TANG Y, SHI A R, et al.. Recent developments in spectroscopic techniques for the detection of explosives[J]. Materials, 2018, 11(8):1364. doi: 10.3390/ma11081364 [6] SLEIMAN J B, BOUSQUET B, PALKA N, et al.. Quantitative analysis of hexahydro-1, 3, 5-trinitro-1, 3, 5, triazine/pentaerythritol tetranitrate(RDX-PETN) mixtures by terahertz time domain spectroscopy[J]. Applied Spectroscopy, 2015, 69(12):1464-1471. doi: 10.1366/15-07937 [7] ZHONG SH L, LU Y, KONG J W, et al.. Quantitative analysis of lead in aqueous solutions by ultrasonic nebulizer assisted laser induced breakdown spectroscopy[J]. Front Physics, 2016, 11(4):114202. doi: 10.1007/s11467-015-0543-4 [8] 陈金忠, 白津宁, 宋广聚, 等.激光诱导击穿光谱技术测定土壤中元素Cr和Pb[J].红外与激光工程, 2013, 42(4):947-950. doi: 10.3969/j.issn.1007-2276.2013.04.020CHEN J ZH, BAI J N, SONG G J, et al.. Determination of Cr and Pb in soil by laser-induced breakdown spectroscopy[J]. Infrared and Laser Engineering, 2013, 42(4):947-950.(in Chinese) doi: 10.3969/j.issn.1007-2276.2013.04.020 [9] 谷艳红, 李颖, 田野, 等.基于LIBS技术的钢铁合金中元素多变量定量分析方法研究[J].光谱学与光谱分析, 2014, 34(8):2244-2249. doi: 10.3964/j.issn.1000-0593(2014)08-2244-06GU Y H, LI Y, TIAN Y, et al.. Study on the multivariate quantitative analysis method for steel alloy elements using LIBS[J]. Spectroscopy and Spectral Analysis, 2014, 34(8):2244-2249.(in Chinese) doi: 10.3964/j.issn.1000-0593(2014)08-2244-06 [10] 何秀文, 黄林, 刘木华, 等.激光诱导击穿光谱对大米中镉元素的检测分析[J].应用激光, 2014, 34(1):72-75. http://www.wanfangdata.com.cn/details/detail.do?_type=perio&id=yyjg201401014HE X W, HUANG L, LIU M H, et al.. Determination of Cd in rice by laser-induced breakdown spectroscopy[J]. Applied Laser, 2014, 34(1):72-75.(in Chinese) http://www.wanfangdata.com.cn/details/detail.do?_type=perio&id=yyjg201401014 [11] 刘晓娜, 吴志生, 乔延江.LIBS快速评价产品质量属性的研究进展及在中药的应用前景[J].世界中医药, 2013, 8(11):1269-1272. doi: 10.3969/j.issn.1673-7202.2013.11.002LIU X N, WU ZH SH, QIAO Y J. Review on rapid evaluation of product quality attributes and application prospects in Chinese materia medica[J]. World Chinese Medicine, 2013, 8(11):1269-1272.(in Chinese) doi: 10.3969/j.issn.1673-7202.2013.11.002 [12] 刘津, 孙通, 甘兰萍.基于内标法和CARS变量优选的倍硫磷含量LIBS检测[J].发光学报, 2018, 39(5):737-744. http://d.old.wanfangdata.com.cn/Periodical/fgxb201805019LIU J, SUN T, GAN L P. Detection of fenthion content by libs combined with internal standard and CARS variable selection method[J]. Chinese Journal of Luminescence, 2018, 39(5):737-744.(in Chinese) http://d.old.wanfangdata.com.cn/Periodical/fgxb201805019 [13] 王慧丽, 王建伟, 周强, 等.激光诱导击穿光谱法定量分析水泥中的铜元素[J].发光学报, 2017, 38(11):1553-1558. http://d.old.wanfangdata.com.cn/Periodical/fgxb201711020WANG H L, WANG J W, ZHOU Q, et al..Quantitative analysis of cu in cement by laser induced breakdown spectroscopy[J]. Chinese Journal of Luminescence, 2017, 38(11):1553-1558.(in Chinese) http://d.old.wanfangdata.com.cn/Periodical/fgxb201711020 [14] 李占锋, 王芮雯, 邓琥, 等.黄连、附片和茯苓内铜元素激光诱导击穿光谱分析[J].发光学报, 2016, 37(1):100-105. http://d.old.wanfangdata.com.cn/Periodical/fgxb201601016LI ZH F, WANG R W, DENG H, et al..Laser induced breakdown spectra copy of Cu in coptis chinensis, aconite root and poria cocos[J]. Chinese Journal of Luminescence, 2016, 37(1):100-105.(in Chinese) http://d.old.wanfangdata.com.cn/Periodical/fgxb201601016 [15] DE LUCIA F C, GOTTFRIED J L, MUNSON C A, et al.. Multivariate analysis of standoff laser-induced breakdown spectroscopy spectra for classification of explosive-containing residues[J]. Applied Optics, 2008, 47(31):G112-G121. doi: 10.1364/AO.47.00G112 [16] CHUNG J H, CHO S G. Nanosecond gated raman spectroscopy for standoff detection of hazardous materials[J]. Bulletin of the Korean Chemical Society, 2014, 35(12):3547-3552. http://www.wanfangdata.com.cn/details/detail.do?_type=perio&id=77245736fe24d4dd3d86b903add0eca6 [17] JOHNSON P V, BEEGLE L W, KIM H I, et al.. Ion mobility spectrometry in space exploration[J]. International Journal of Mass Spectrometry, 2007, 262(1-2):1-15. doi: 10.1016/j.ijms.2006.11.001 [18] SIVAKUMAR N, JOSEPH M, MANORAVI P, et al.. Development of an ion mobility spectrometer for detection of explosives[J]. Instrumentation Science & Technology, 2013, 41(1):96-108. [19] LEE J, PARK S, CHO S G, et al.. Analysis of explosives using corona discharge ionization combined with ion mobility spectrometry mass spectrometry[J]. Talanta, 2014, 120:64-70. doi: 10.1016/j.talanta.2013.11.059 [20] MOROS J, LORENZO J A, LASERNA J J. Standoff detection of explosives:critical comparison for ensuing options on Raman spectroscopy-LIBS sensor fusion[J]. Analytical and Bioanalytical Chemistry, 2011, 400(10):3353-3365. doi: 10.1007/s00216-011-4999-y [21] 李莹莹.5-乙烯基四唑的常压表征及其高压相变研究[D].长春: 吉林大学, 2016. http://cdmd.cnki.com.cn/Article/CDMD-10183-1016080080.htmLI Y Y. The characterizations of 5-vinyltetrazole at ambient conditions and investigations of it's high pressure phase transition[D]. Changchun: Jilin University, 2016.(in Chinese) http://cdmd.cnki.com.cn/Article/CDMD-10183-1016080080.htm [22] 孙艳苓.5, 5'-偶氮四唑锌的合成与性能研究[D].南京: 南京理工大学, 2012. http://cdmd.cnki.com.cn/Article/CDMD-10288-1012319323.htmSUN Y L. Synthesis and characterization of zinc 5, 5'-azotetrazolate[D]. Nanjing: Nanjing University of Science and Technology, 2012.(in Chinese) http://cdmd.cnki.com.cn/Article/CDMD-10288-1012319323.htm [23] LI A, GUO SH, WAZIR N, et al.. Accuracy enhancement of laser induced breakdown spectra using permittivity and size optimized plasma confinement rings[J]. Optics Express, 2017, 25(22):27559-27569. doi: 10.1364/OE.25.027559 [24] WANG X SH, LI A, WAZIR N, et al.. Accuracy enhancement of laser induced breakdown spectroscopy by safely low-power discharge[J]. Optics Express, 2018, 26(11):13973-13978. doi: 10.1364/OE.26.013973 [25] 谢承利.激光诱导击穿光谱数据处理方法及在煤分析中的应用研究[D].武汉: 华中科技大学, 2009. http://d.wanfangdata.com.cn/Thesis/D088567XIE CH L. Study of the spectral data processing in laser induced breakdown spectroscopy analysis and its application in elemental analysis of coal[D]. Wuhan: Huazhong University of Science and Technology, 2009.(in Chinese) http://d.wanfangdata.com.cn/Thesis/D088567 [26] KALAM S A, MURTHY N L, MATHI P, et al.. Correlation of molecular, atomic emissions with detonation parameters in femtosecond and nanosecond LIBS plasma of high energy materials[J]. Journal of Analytical Atomic Spectrometry, 2017, 32(8):1535-1546. doi: 10.1039/C7JA00136C [27] WANG J M, LIAO X Y, ZHENG P CH, et al.. Classification of Chinese herbal medicine by laser-induced breakdown spectroscopy with principal component analysis and artificial neural network[J]. Analytical Letters, 2018, 51(4):575-586. doi: 10.1080/00032719.2017.1340949 [28] 杨志辉.基于机器学习算法在数据分类中的应用研究[D].太原: 中北大学, 2017. http://cdmd.cnki.com.cn/Article/CDMD-10110-1017166993.htmYANG ZH H. Research on application of machine learning algorithm in data classification[D]. Taiyuan: North University of China, 2017.(in Chinese) http://cdmd.cnki.com.cn/Article/CDMD-10110-1017166993.htm -

 下载:
下载:


计量
- 文章访问数: 2806
- HTML全文浏览量: 1307
- PDF下载量: 124
- 被引次数: 0
