


Research on high-precision gas concentration inversion based on adaptive infrared multi-band joint spectral analysis
-
摘要:
本文提出一种自适应多波段联合浓度反演算法,结合透过率稳定区间与谱宽阈值自适应选择待测气体的有效波段;采用非线性最小二乘拟合方法对各有效波段进行浓度反演及残差分析,获得各有效波段的浓度反演结果及其权重,通过加权平均实现待测气体浓度的精确定量分析。设计并进行实验验证,结果表明,自适应多波段联合浓度反演算法的稳定系数达到了
0.9976 ,与传统的单波段及多波段浓度反演算法相比,该反演结果的均方根误差分别降低了64.44%和41.52%,平均相对误差分别降低了65.97%和46.72%,平均绝对误差分别降低了66.32%和47.74%,反演精度与稳定性得到了明显提升。-
关键词:
- 有效波段选择 /
- 残差分析 /
- 加权平均 /
- 自适应多波段联合浓度反演
Abstract:In this paper, we proposed an adaptive multi-band joint concentration inversion algorithm, which combines the transmittance stable range and the spectral width threshold to adaptively select the effective band of the measured gas. The nonlinear least squares fitting method is used to invert the concentration of each effective band and analyze the residual to obtain the concentration inversion results and their weights of each effective band. The accurate quantitative analysis of the concentration of the measured gas is realized by weighted averaging. The algorithm verification experiment is carried out. The results show that the stability coefficient of the adaptive multi-band joint concentration inversion algorithm is
0.9976 . Compared with the traditional single-band and multi-band concentration inversion algorithms, the root mean square error of the inversion results is reduced by 64.44% and 41.52%, the mean relative error is reduced by 65.97% and 46.72%, and the mean absolute error is reduced by 66.32% and 47.74% respectively. It can be concluded that the inversion accuracy and stability are significantly improved. -
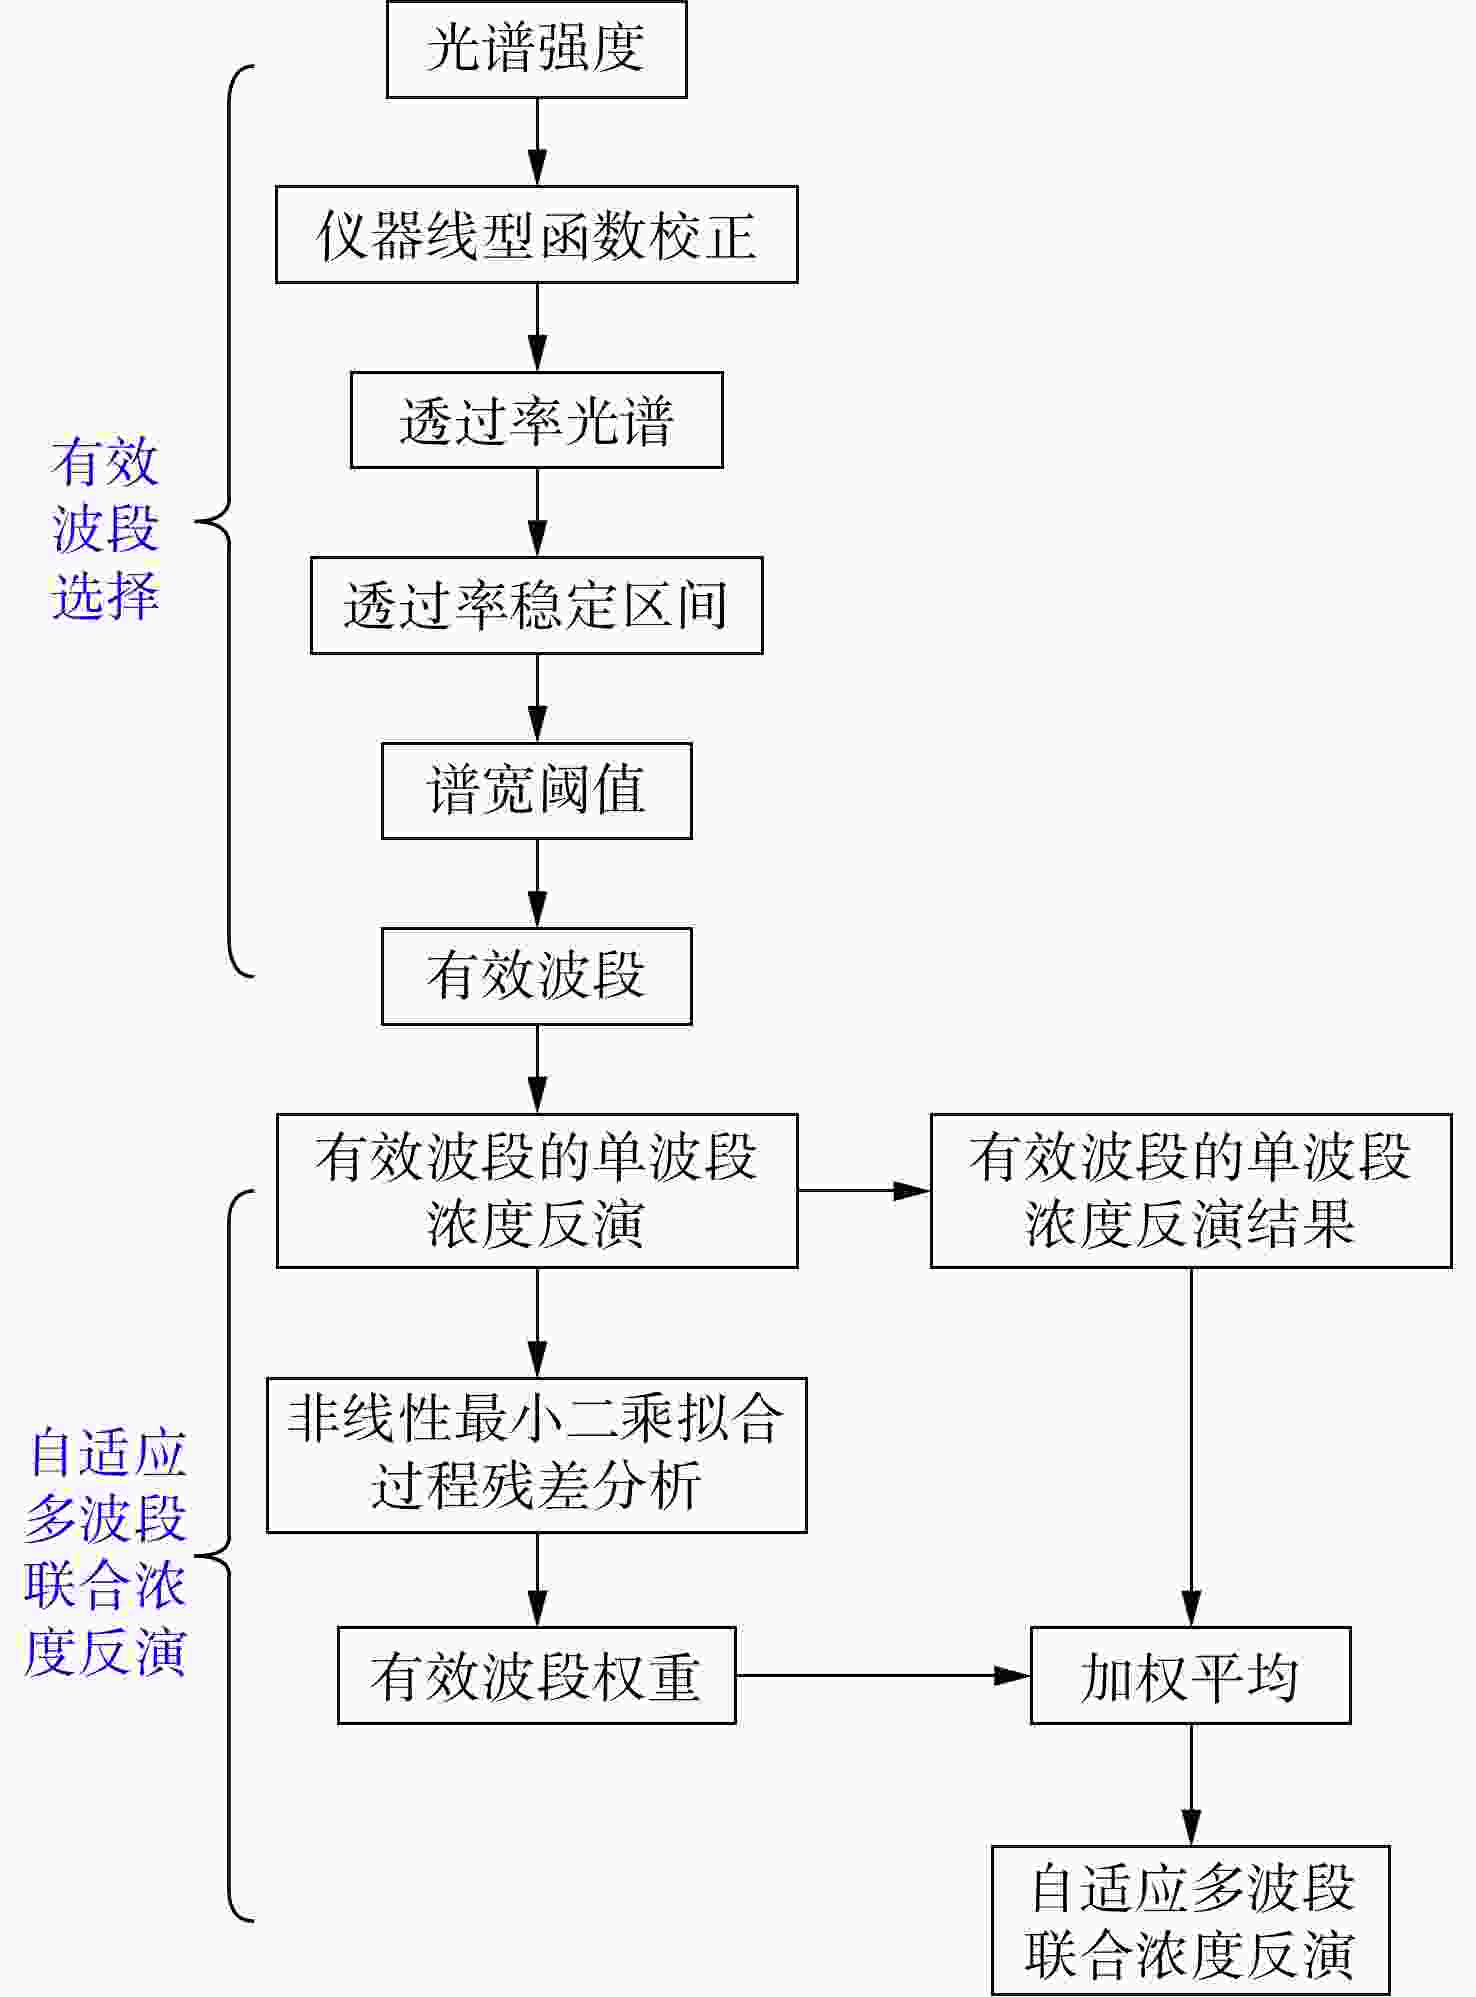
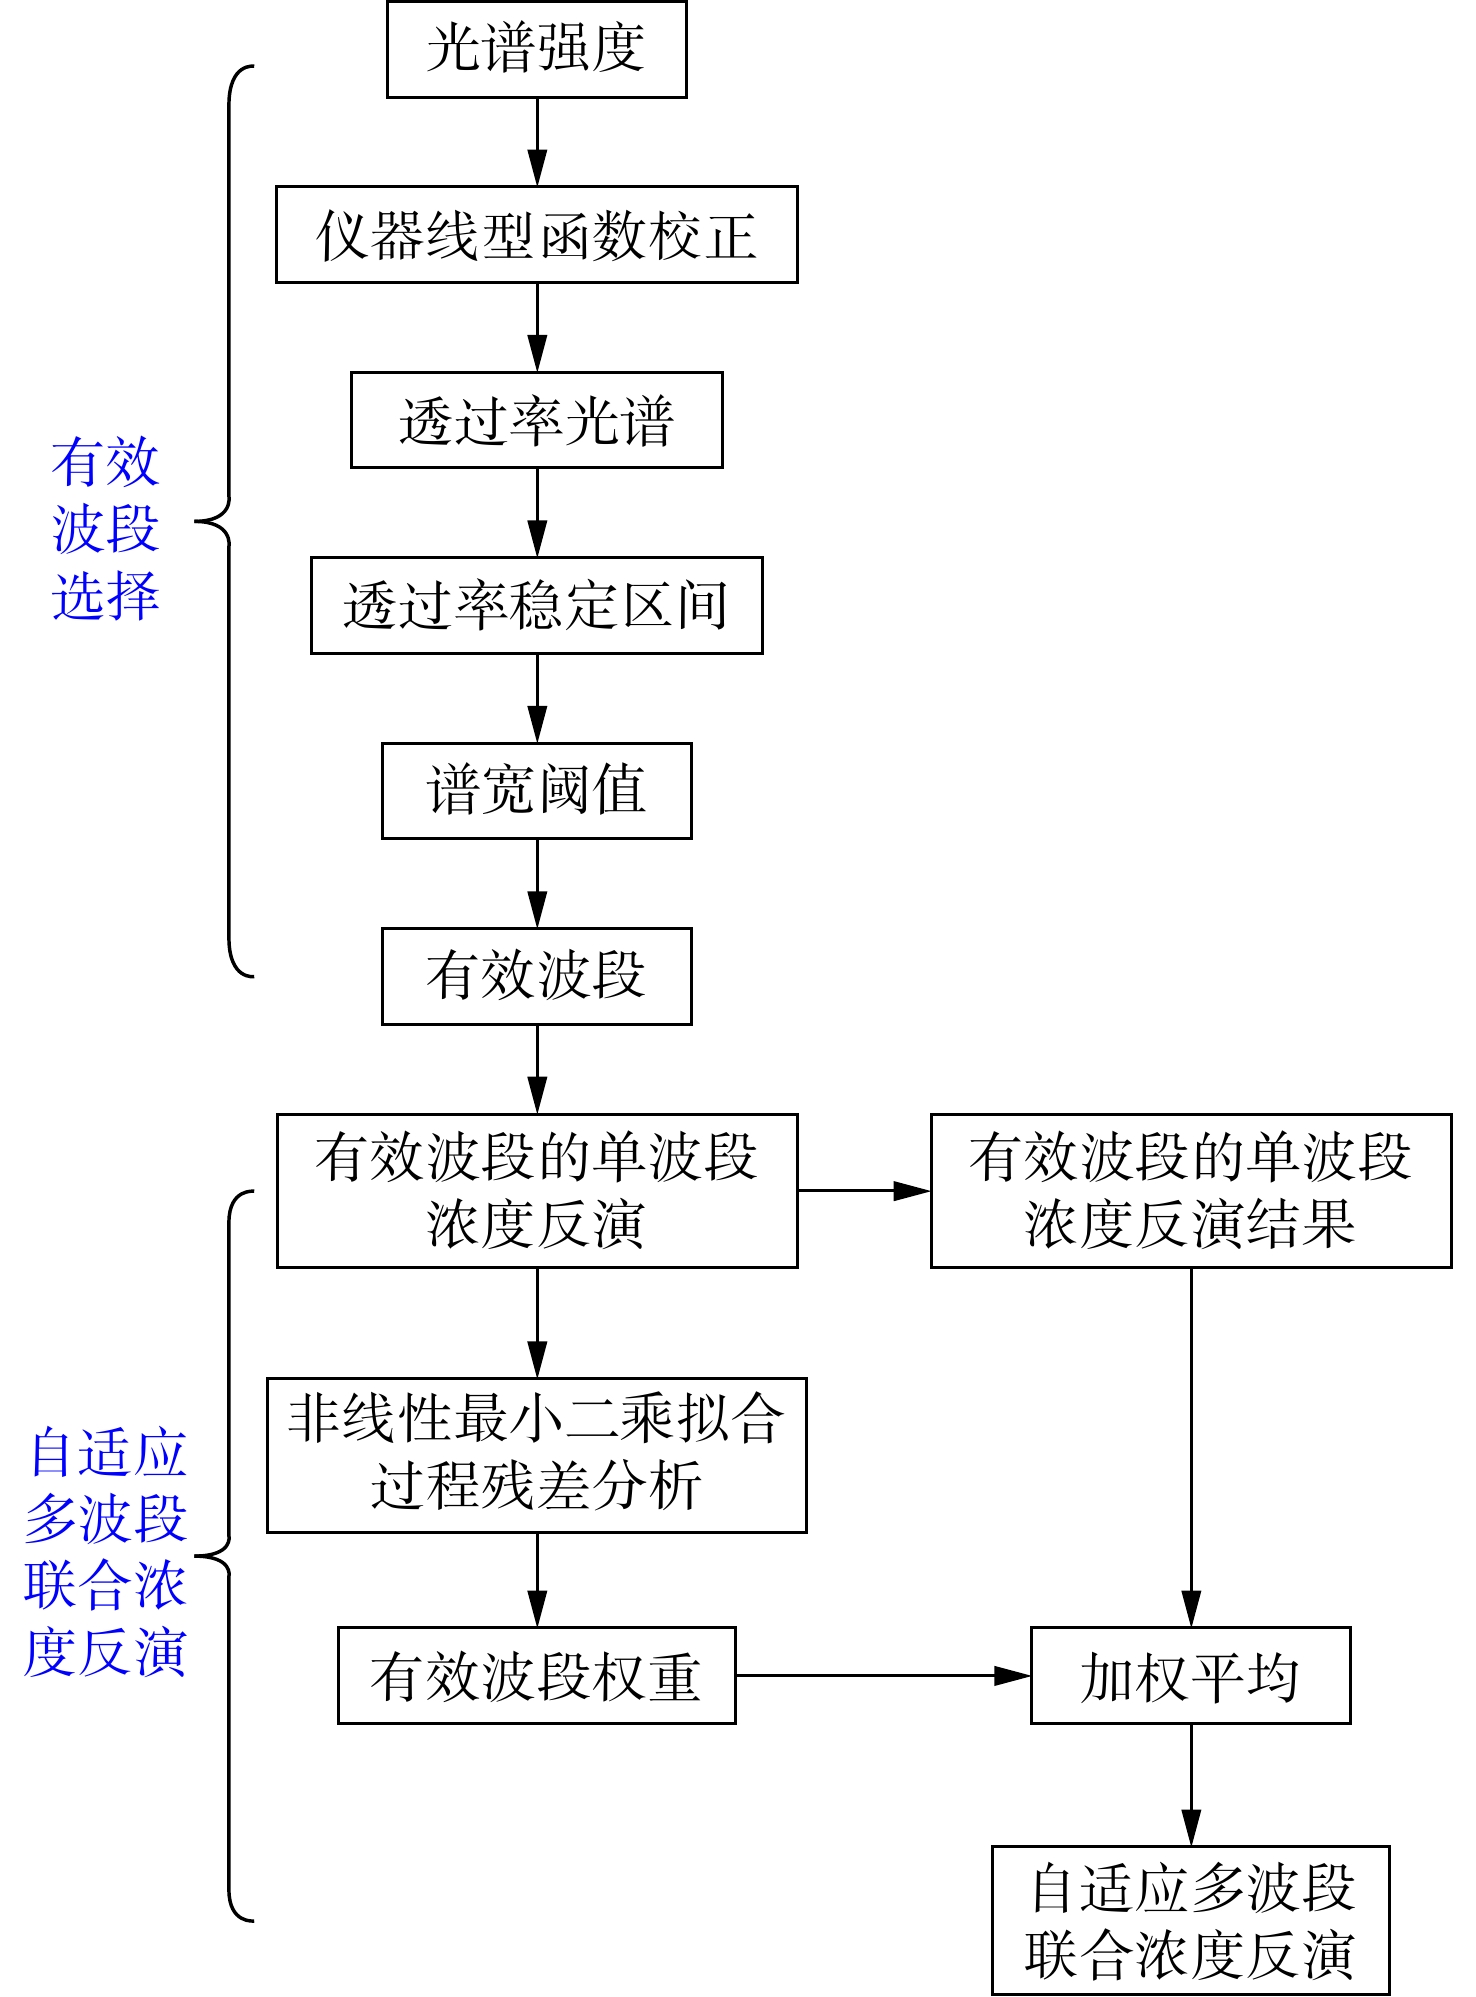
图 1 自适应多波段联合浓度反演算法流程图
Figure 1. Flow chart of adaptive multi-band joint concentration inversion algorithm
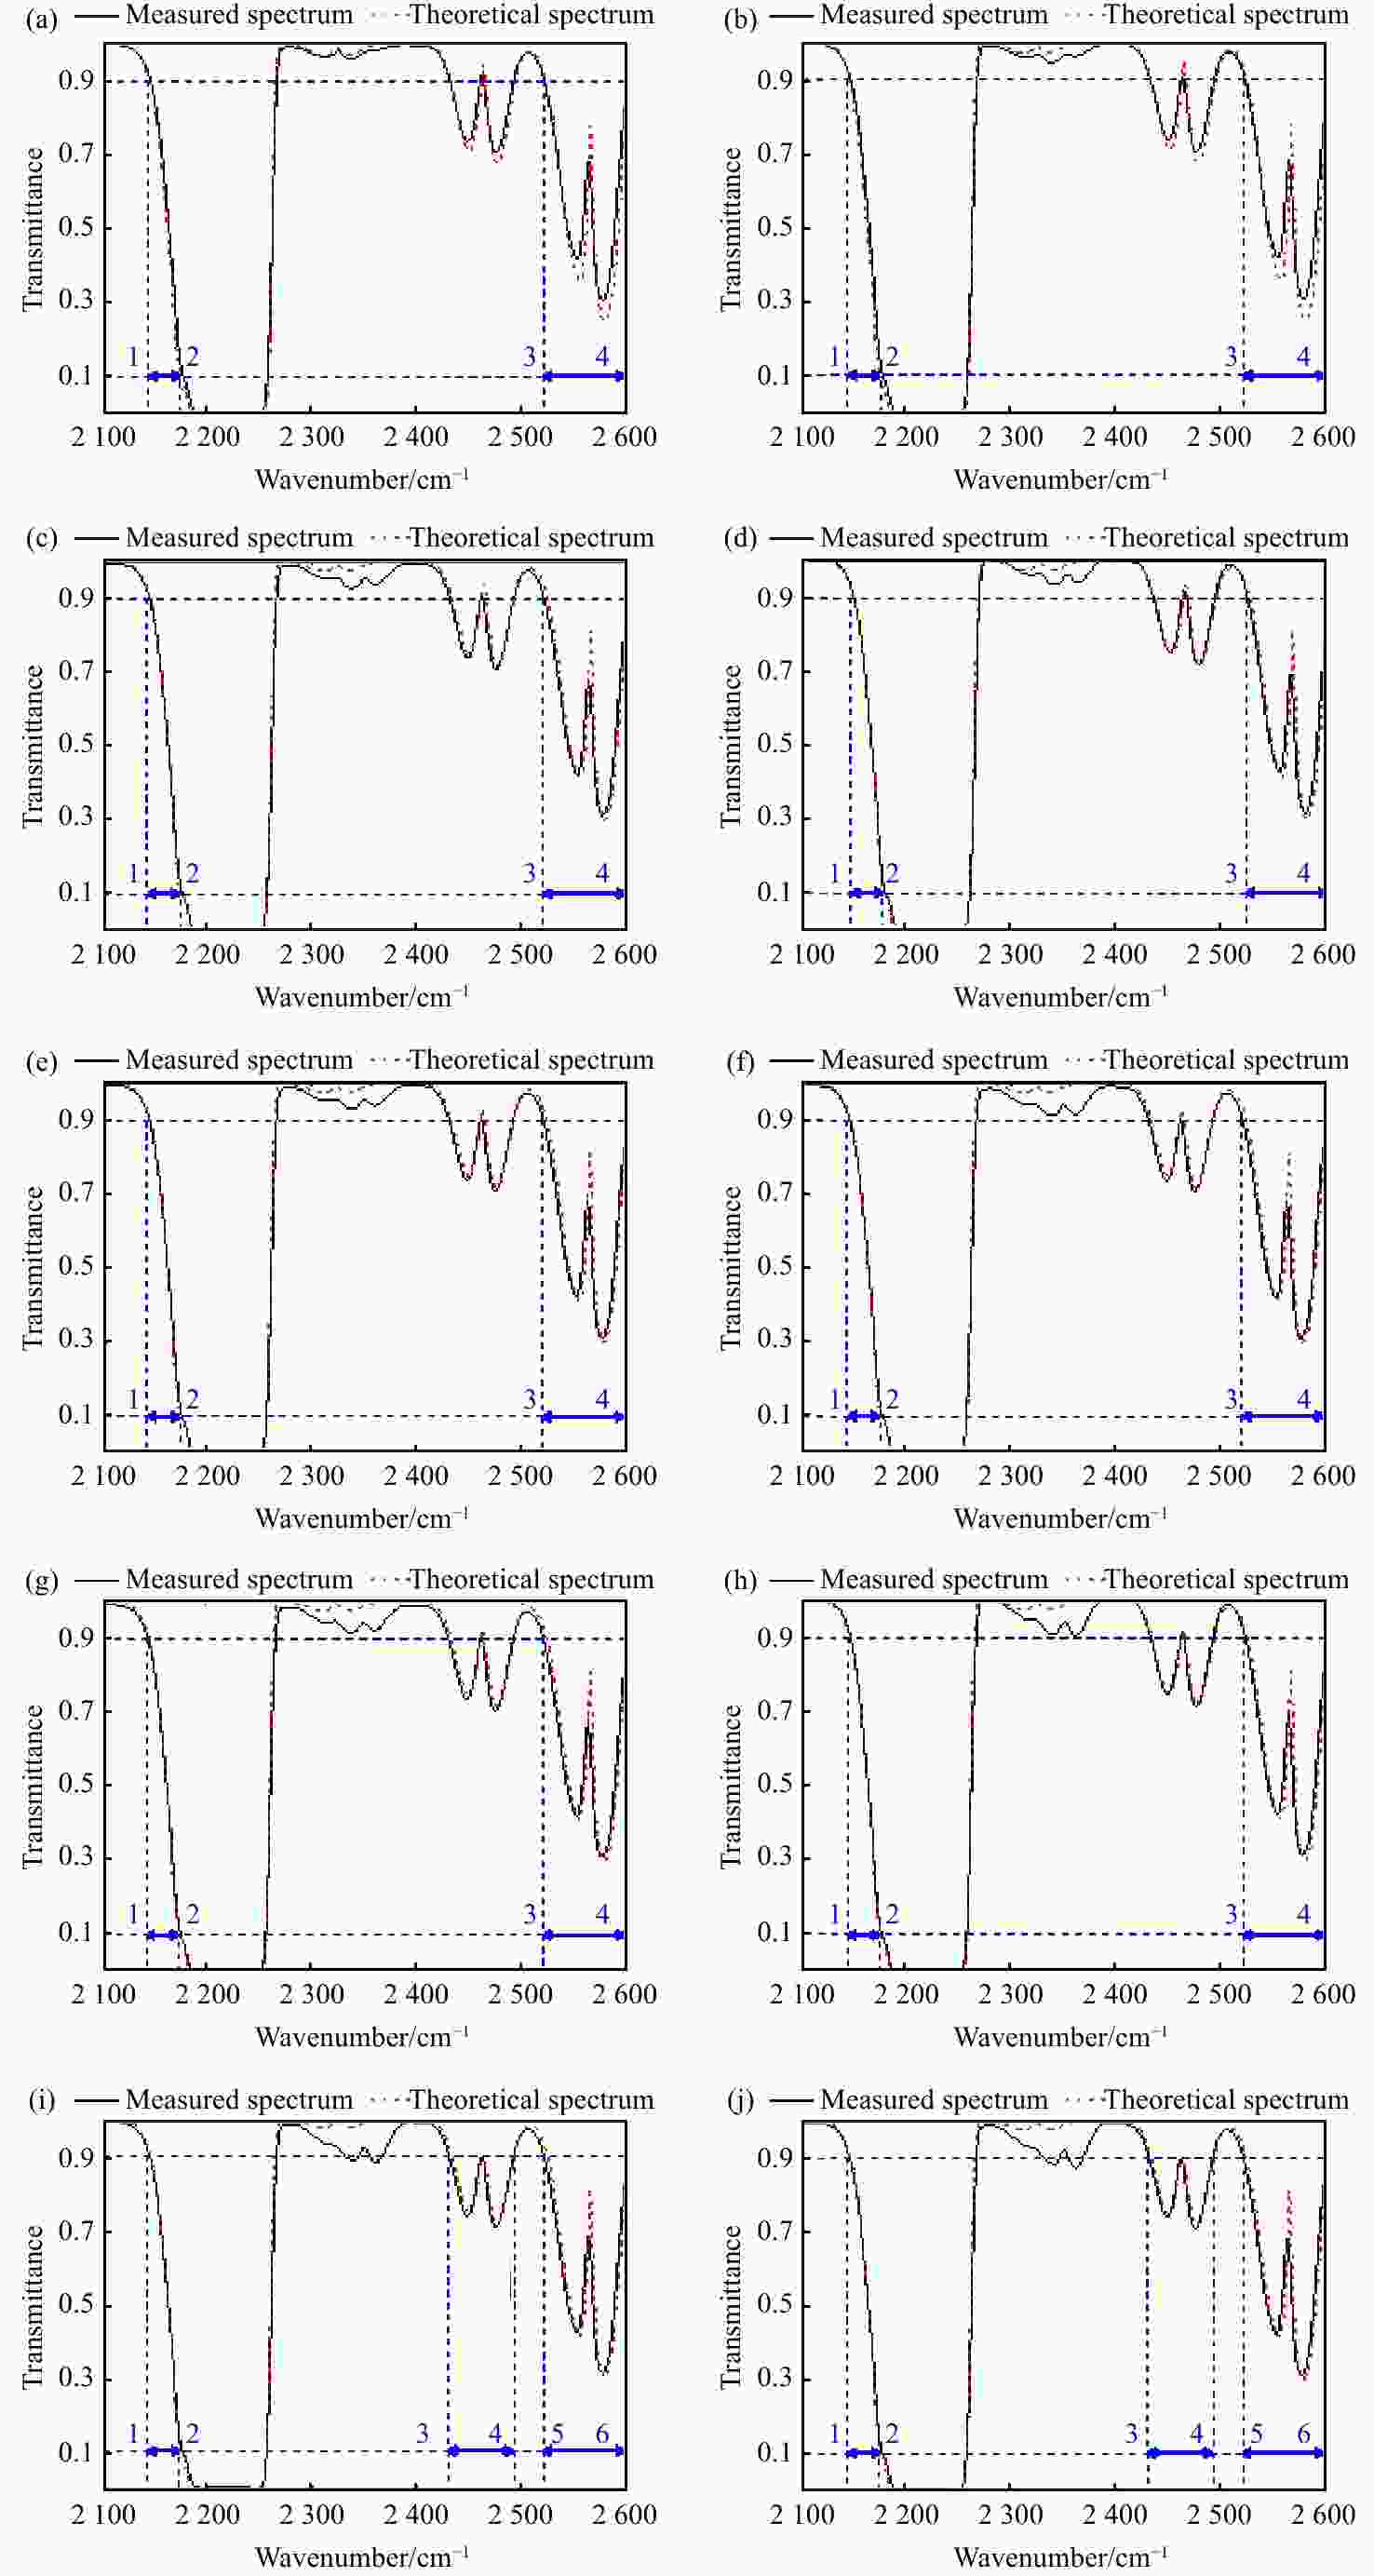
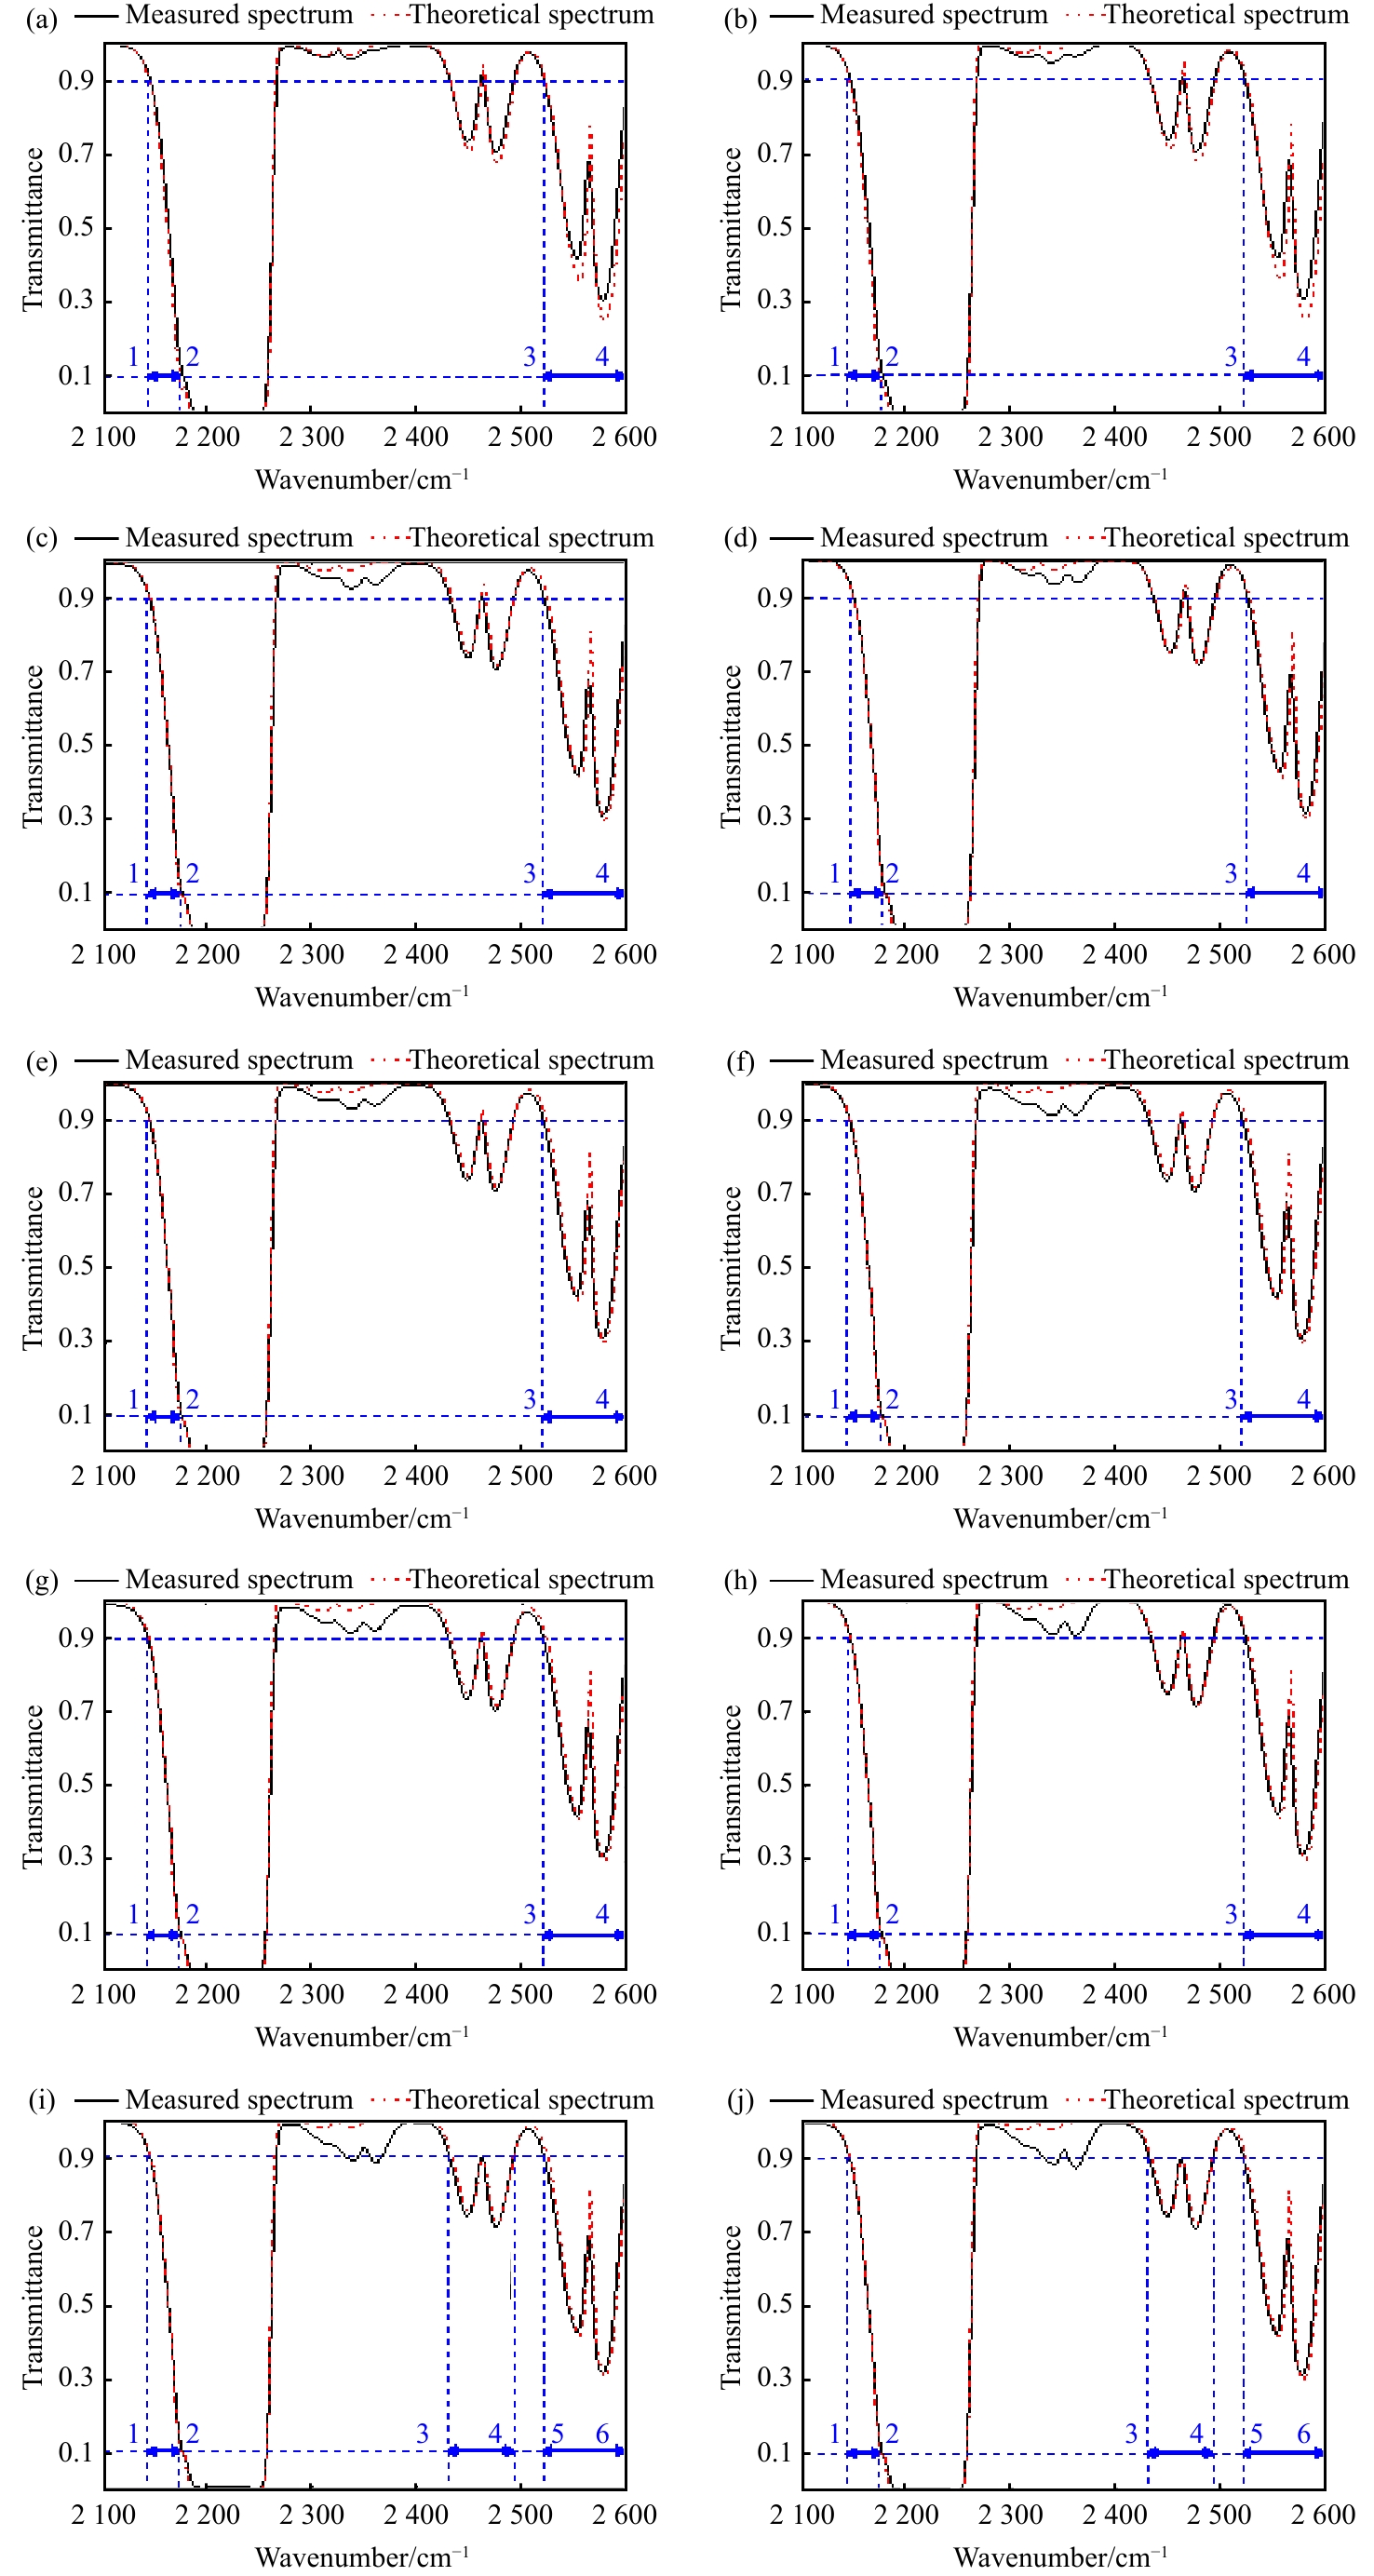
图 4 (a)~(j)分别为10种浓度N2O气体的实测透过率光谱与理论透过率光谱,其中1~2、3~4以及5~6为实测有效波段范围
Figure 4. (a) to (j) are the measured and theoretical transmittance spectra of N2O gas with different concentrations, where 1 to 2, 3 to 4 and 5 to 6 are the measured effective band ranges
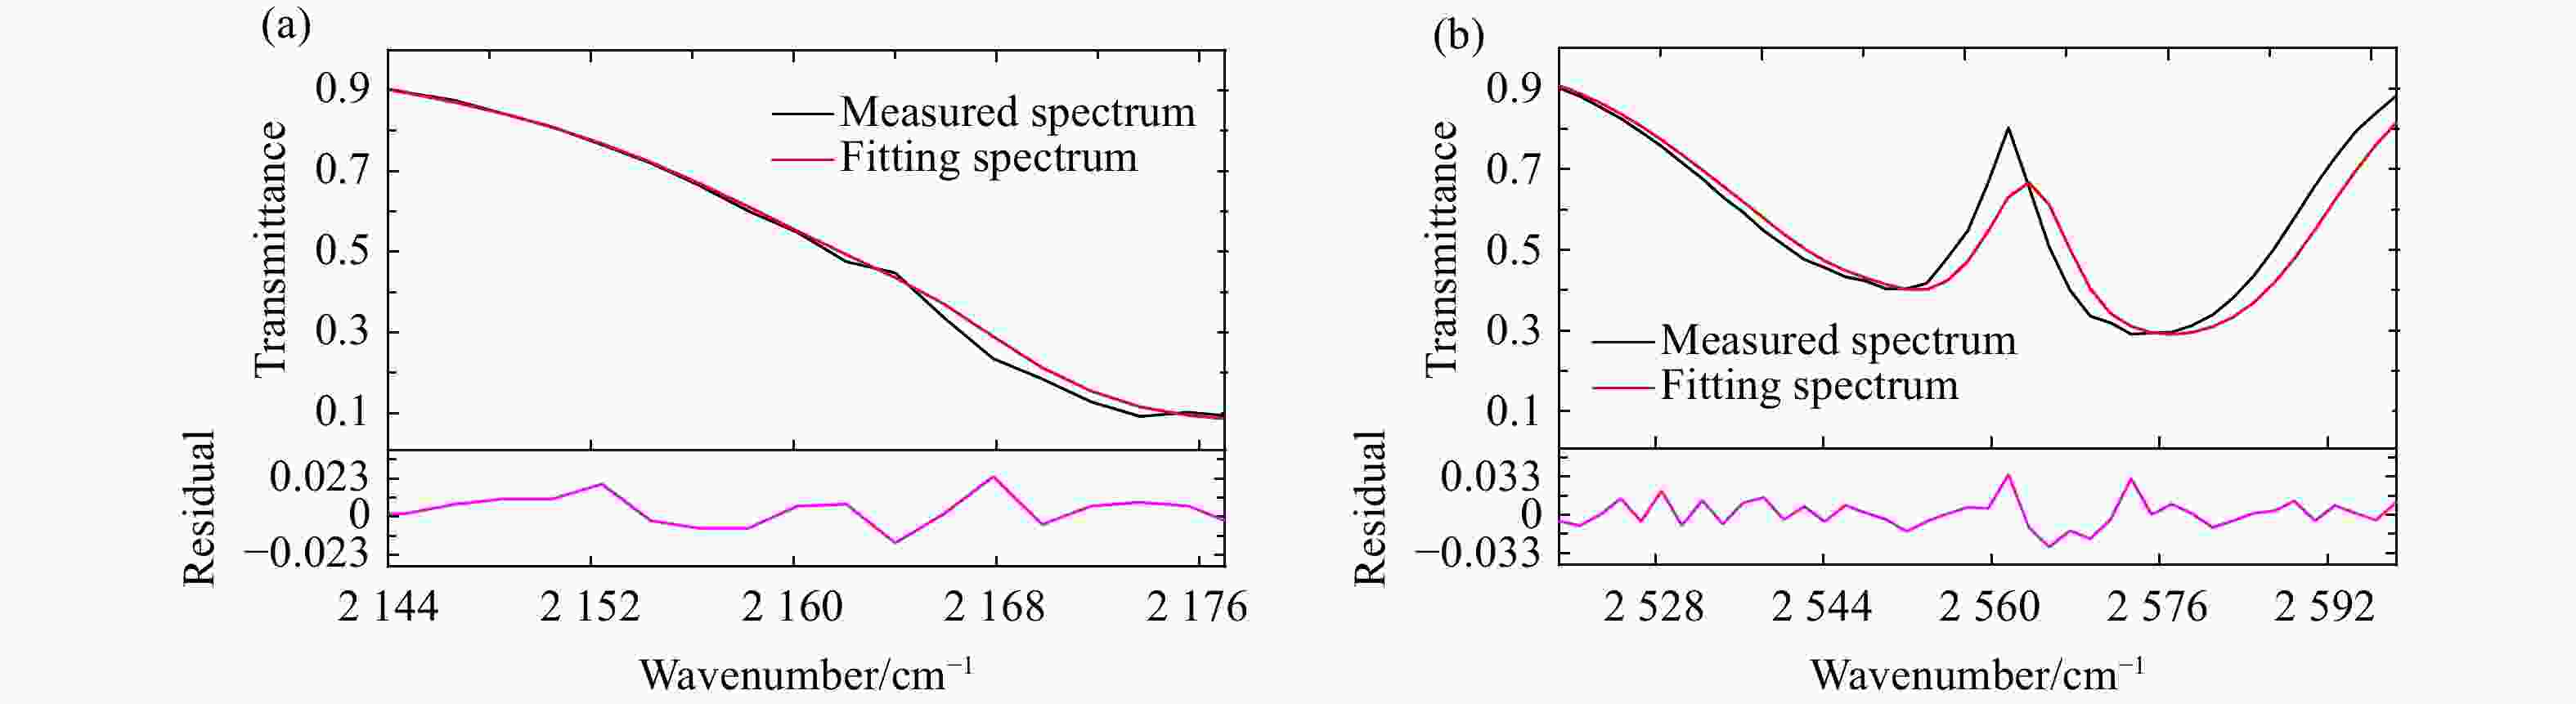
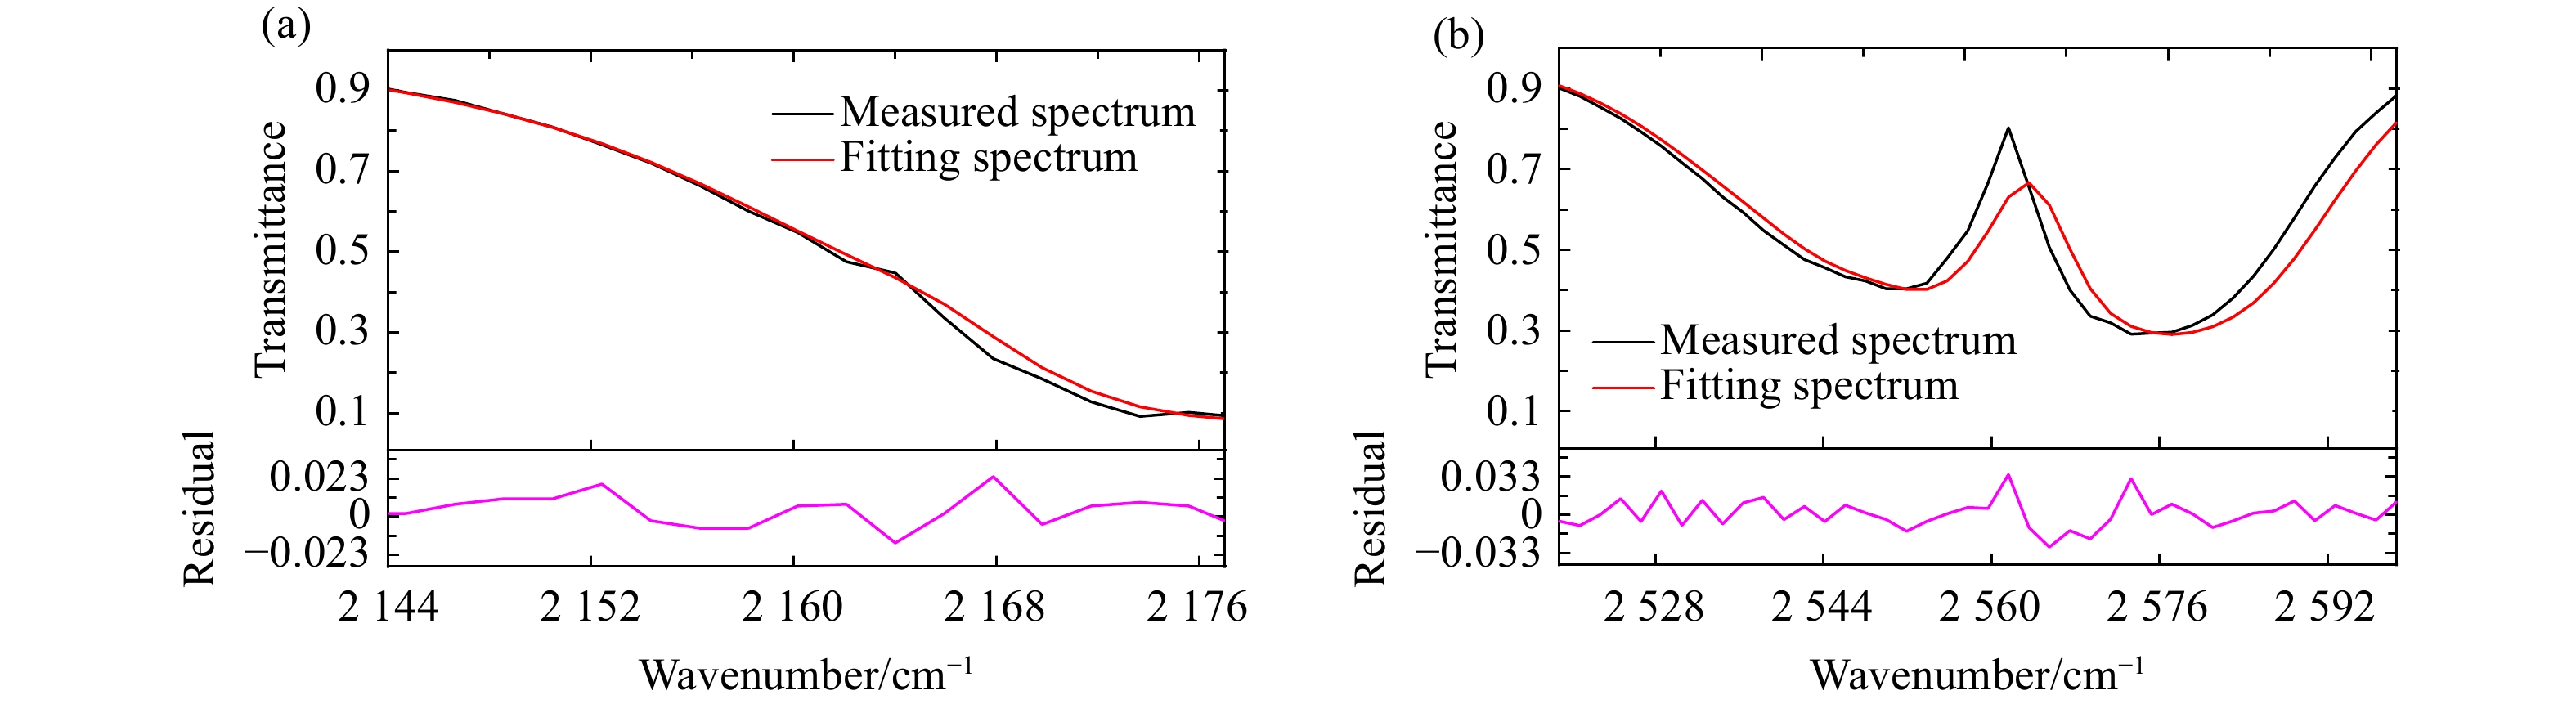
图 5 2.8%浓度N2O气体在有效波段(a)
2144 ~2176 cm−1及(b)2519 ~2600 cm−1的光谱拟合结果及其残差分布Figure 5. The spectral fitting results and residual distribution of N2O gas with concentration of 2.8% in the effective band of (a)
2144 to2176 cm−1 and (b)2519 to2600 cm−1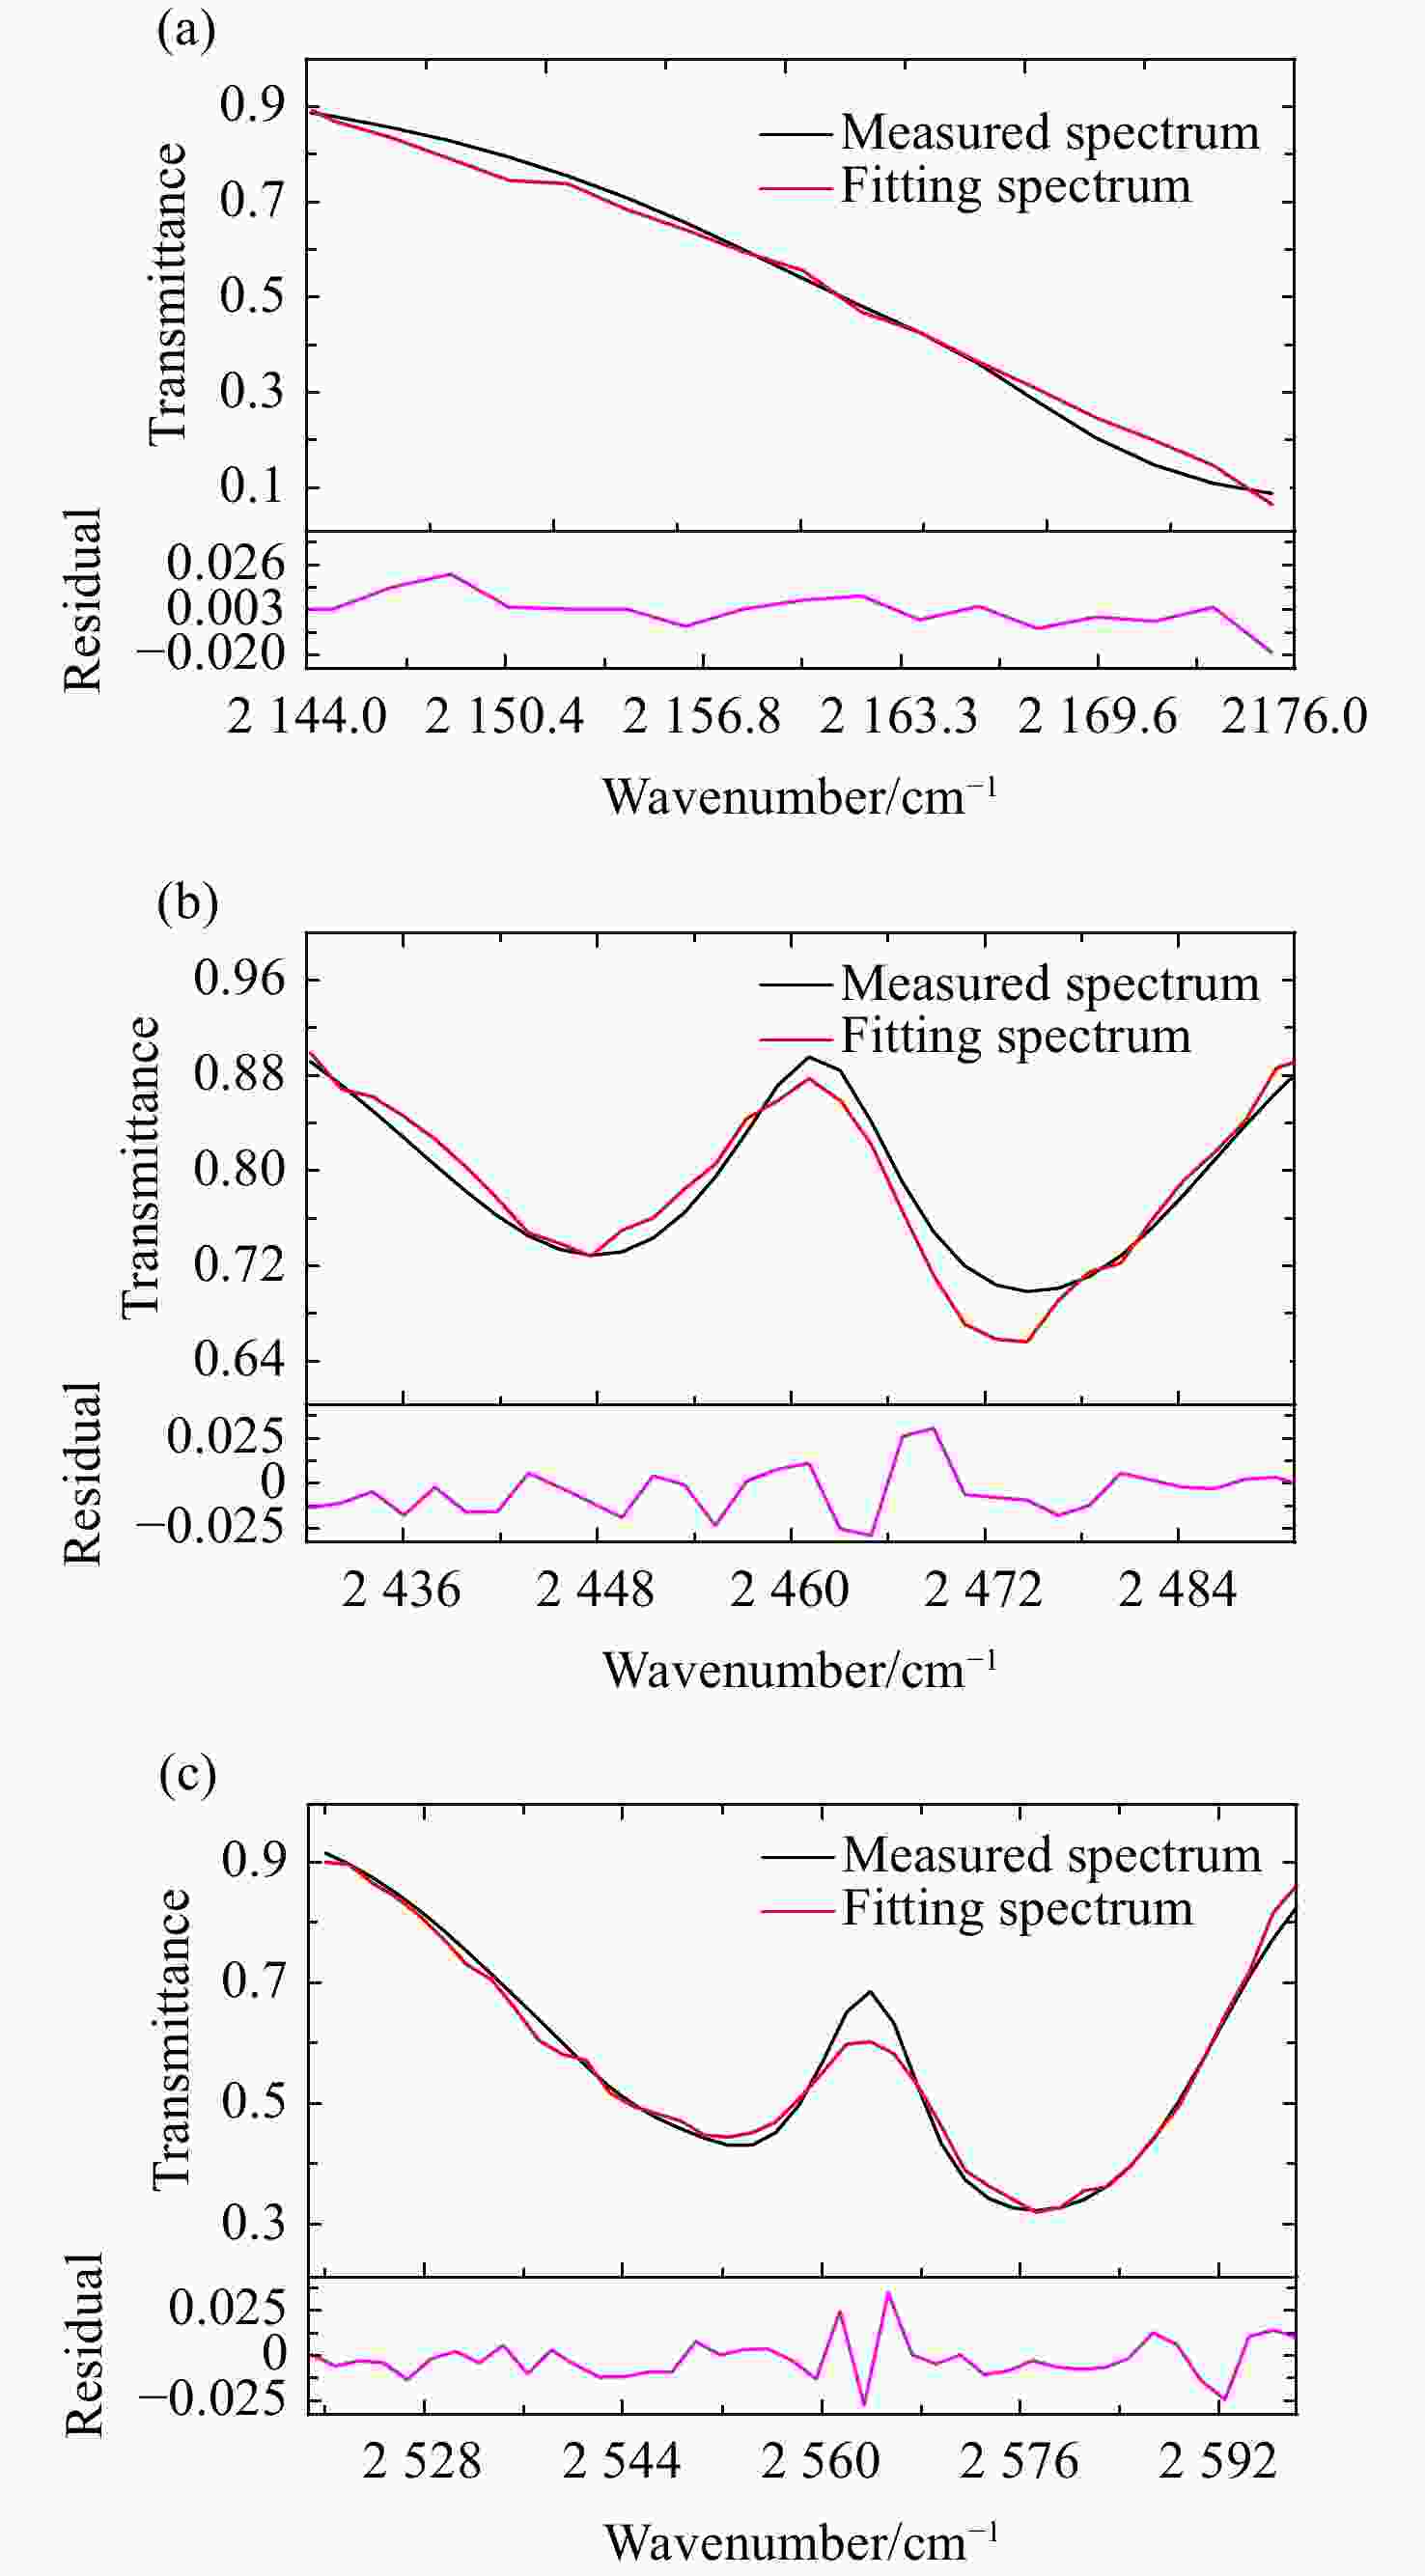
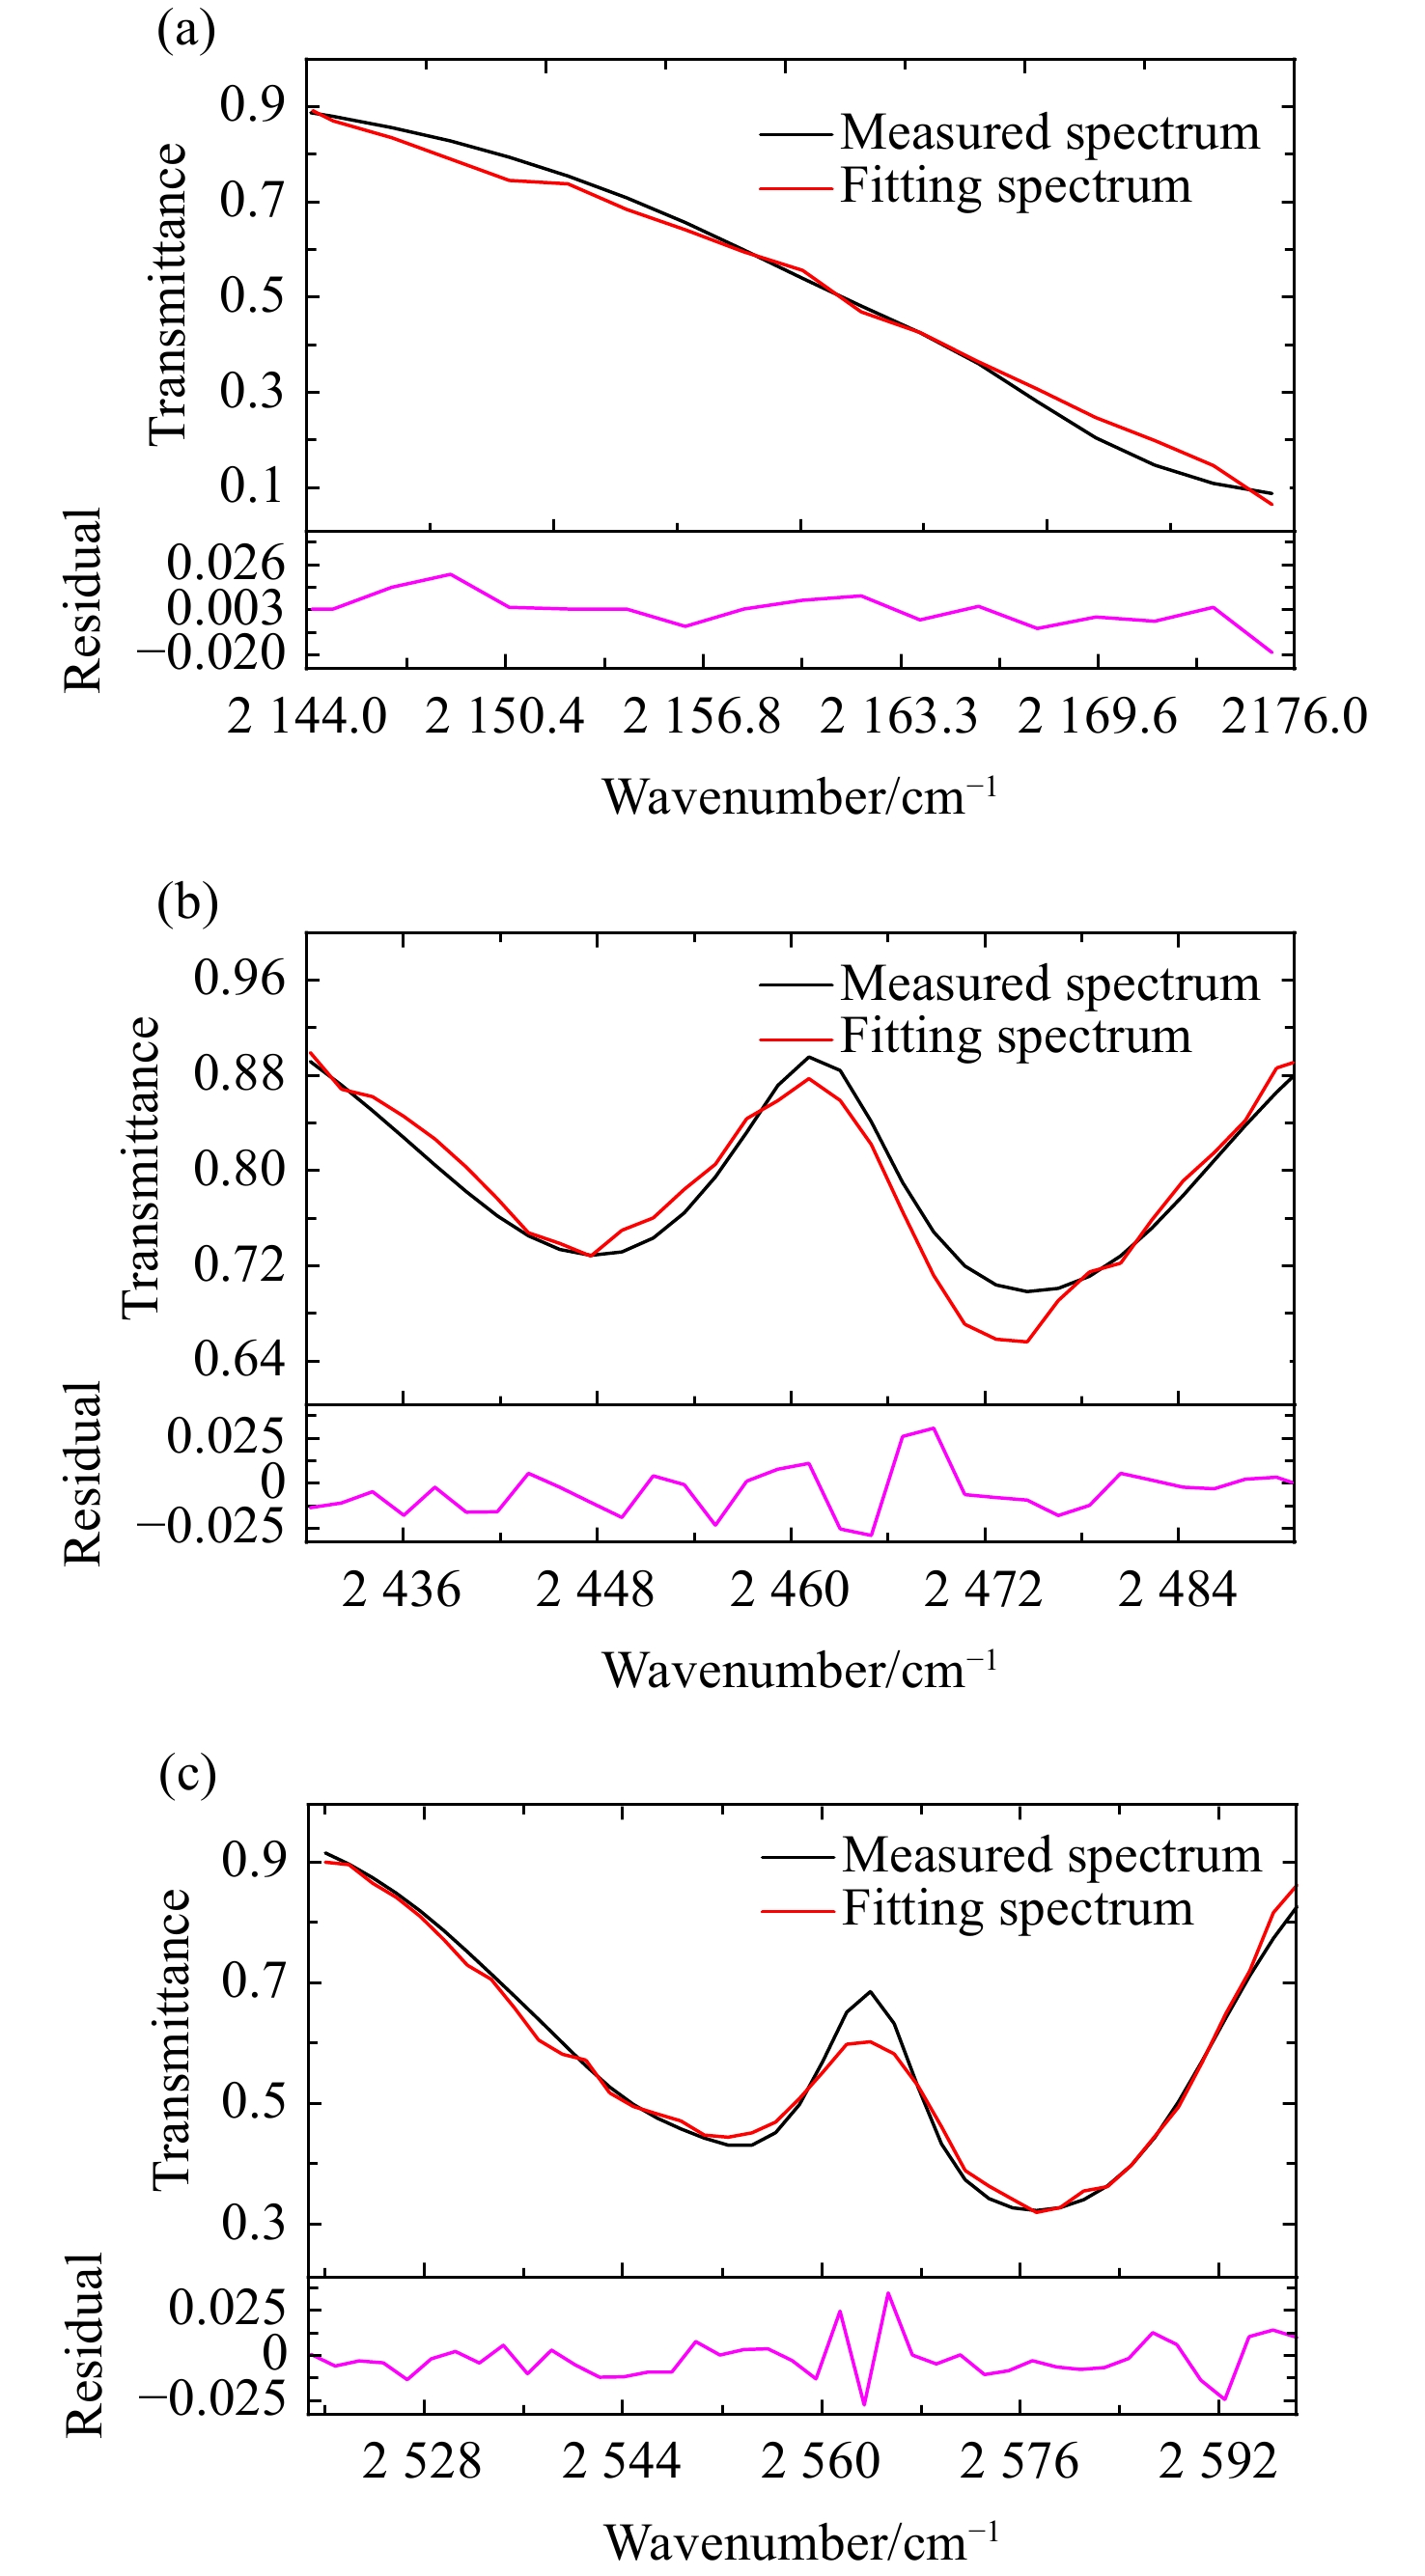
图 6 4.4%浓度N2O气体在有效波段(a)
2144 ~2176 cm−1、(b)2430 ~2491 cm−1、(c)2519 ~2600 cm−1的光谱拟合结果及其残差分布Figure 6. The spectral fitting results and residual distribution of N2O gas with concentration of 4.4% in the effective band of (a)
2144 to2176 cm−1, (b)2430 to2491 cm−1, (c)2519 to2600 cm−1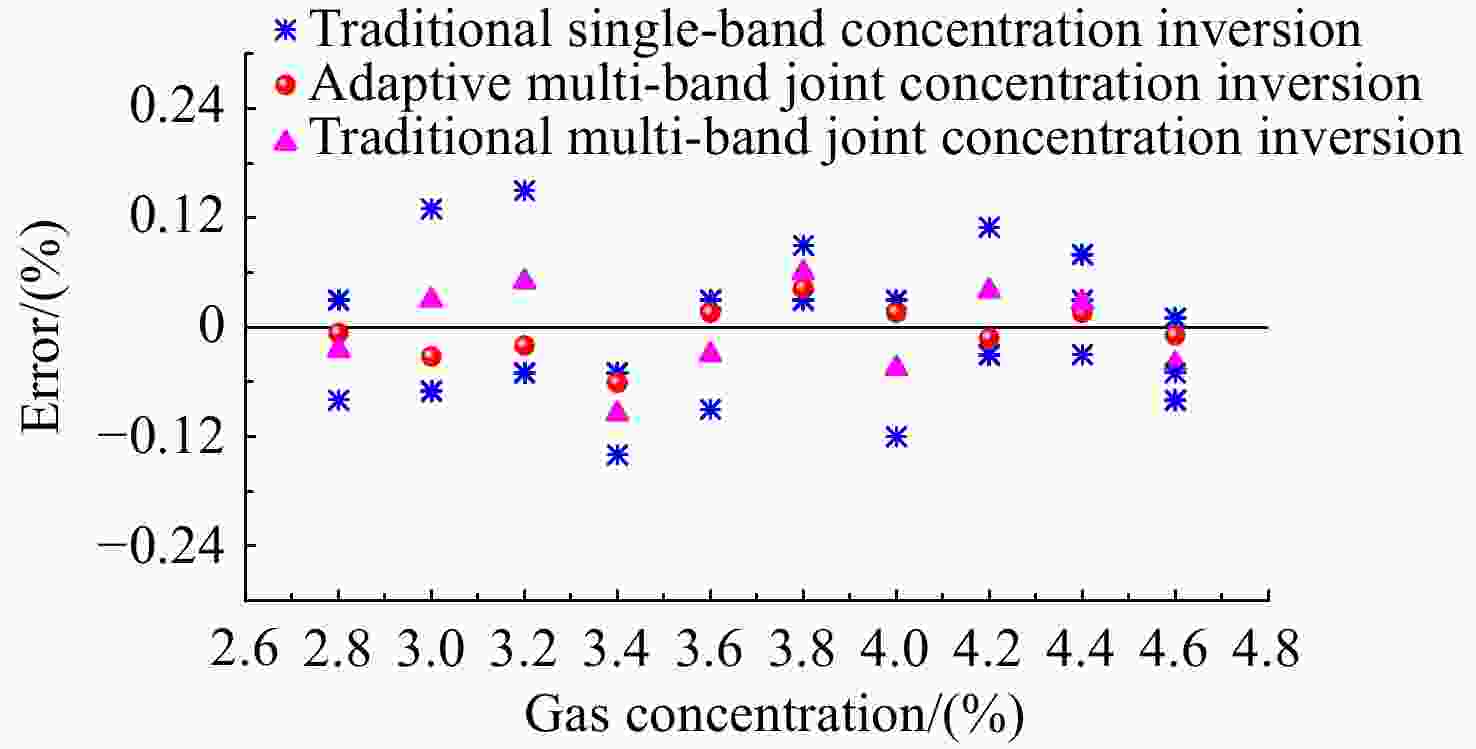
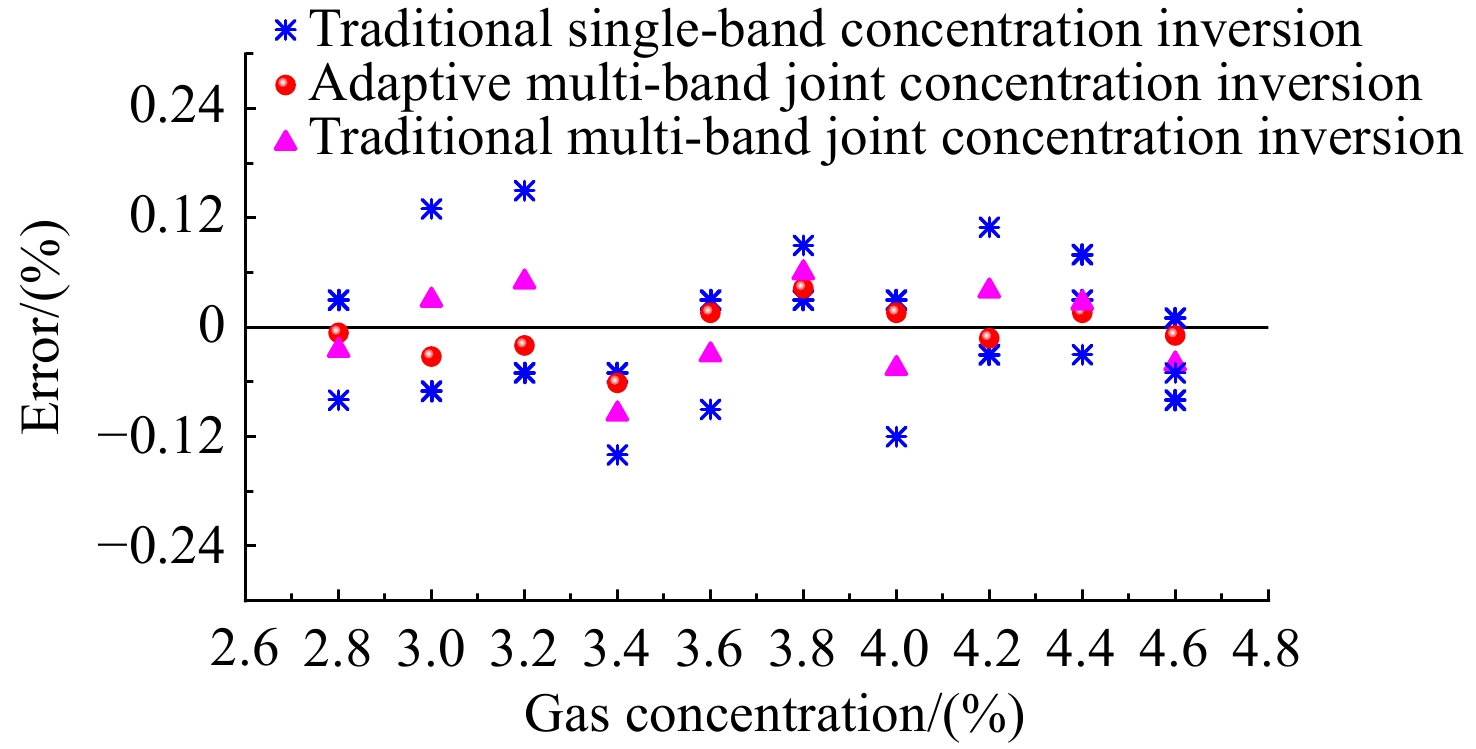
图 7 传统单波段与传统多波段以及自适应多波段联合的浓度反演结果相较于真实值的误差分布
Figure 7. The error distribution of the traditional single-band, traditional multi-band, and adaptive multi-band joint concentration inversion results compared with the real values
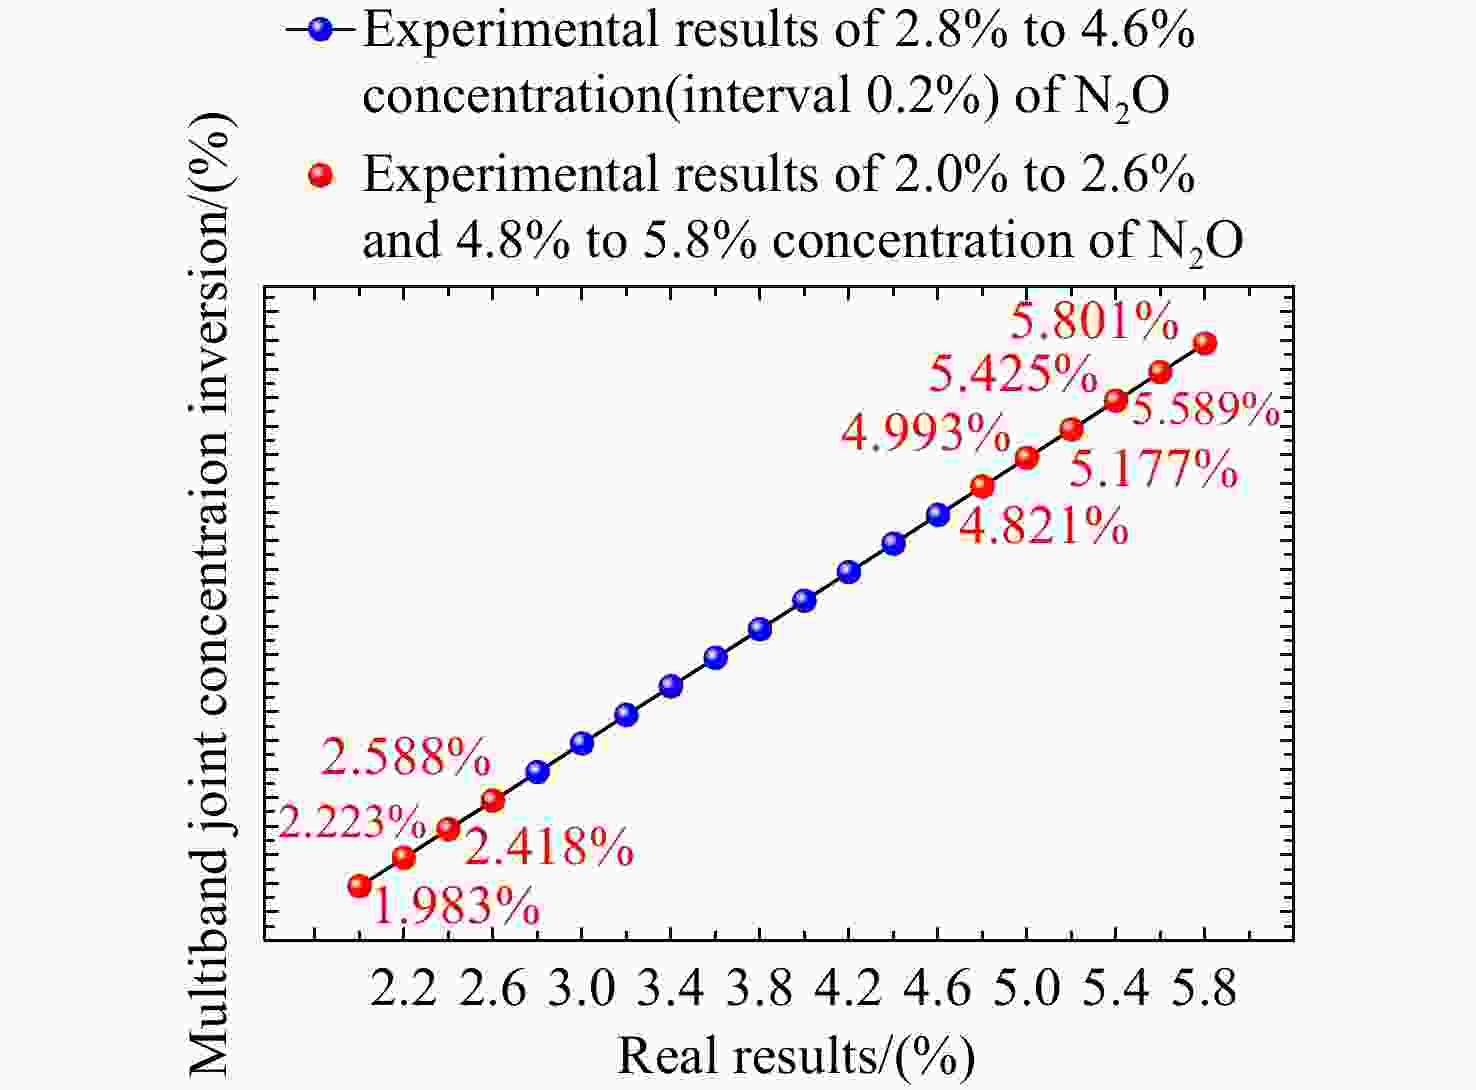
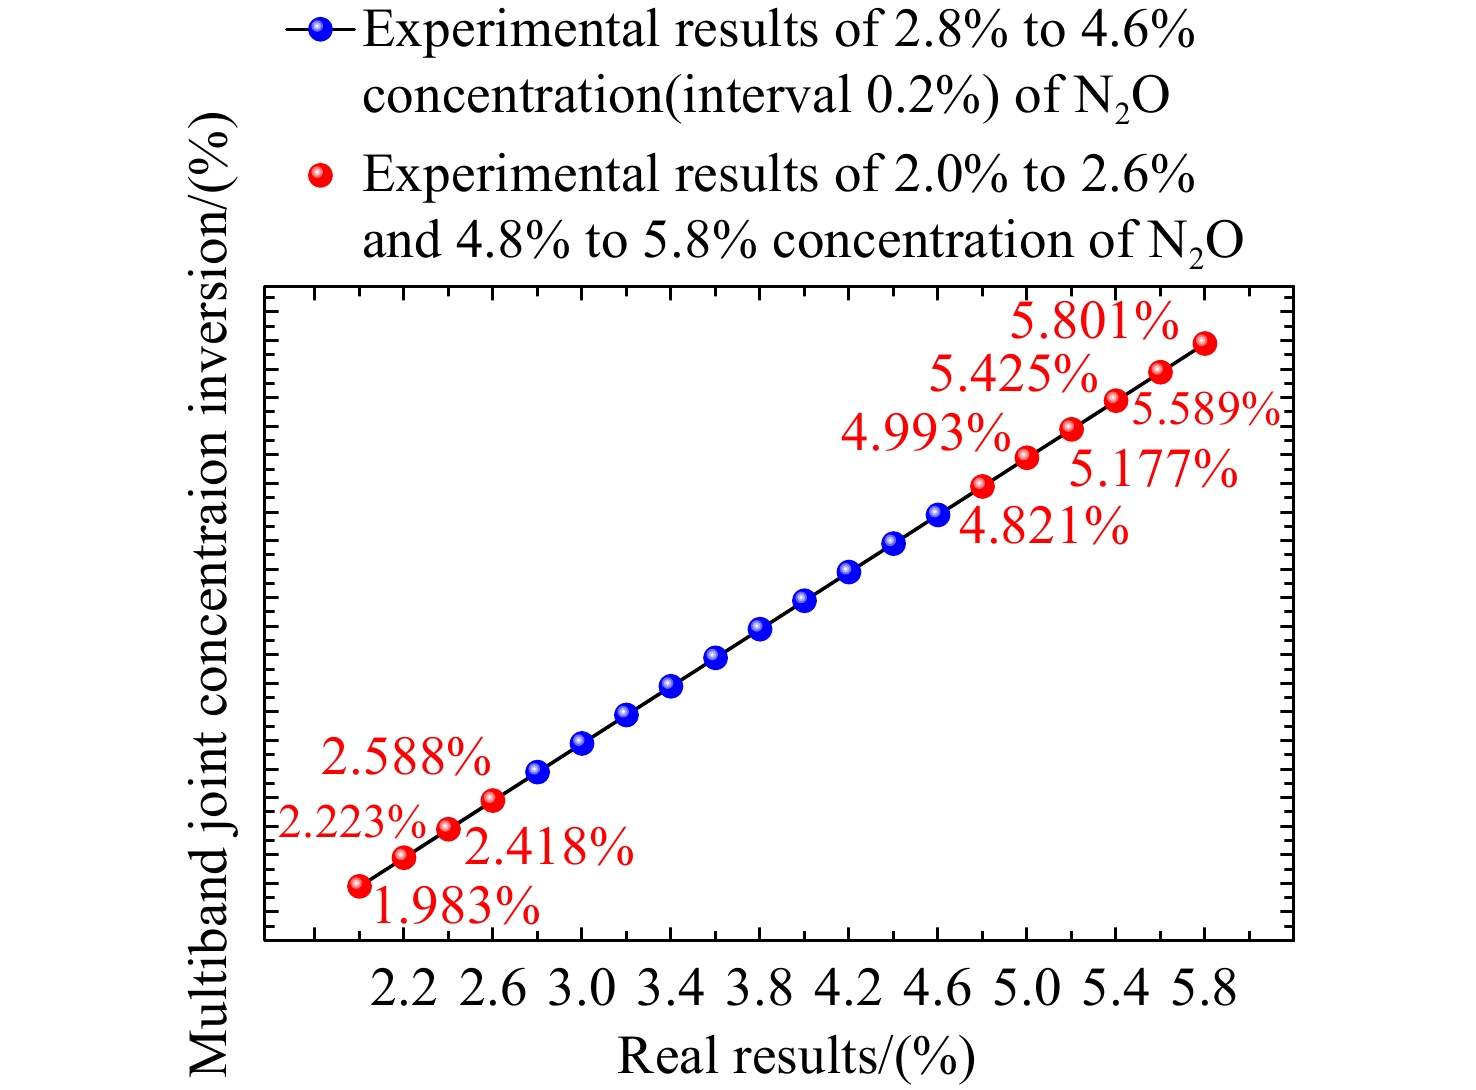
图 8 自适应多波段联合浓度反演结果的分布曲线
Figure 8. Distribution curve of adaptive multi-band joint concentration inversion results
表 1 10种浓度N2O气体的实测有效波段与理论有效波段及其误差分析
Table 1. The measured and theoretical effective bands of N2O gas with 10 concentrations and their error analysis
浓度 实测有效波段( cm−1) 理论有效波段( cm−1) 区间误差 2.8% 2144 ~2176 ,2519 ~2600 2141 ~2173 ,2520 ~2600 ≤4 cm−1 3.0% 2144 ~2176 ,2518 ~2600 2141 ~2173 ,2520 ~2600 ≤4 cm−1 3.2% 2143 ~2176 ,2518 ~2600 2141 ~2173 ,2520 ~2600 ≤4 cm−1 3.4% 2144 ~2176 ,2518 ~2600 2142 ~2174 ,2520 ~2600 ≤4 cm−1 3.6% 2143 ~2176 ,2519 ~2600 2142 ~2175 ,2519 ~2600 ≤4 cm−1 3.8% 2144 ~2176 ,2519 ~2600 2142 ~2174 ,2519 ~2600 ≤4 cm−1 4.0% 2144 ~2176 ,2519 ~2600 2144 ~2176 ,2519 ~2600 ≤4 cm−1 4.2% 2144 ~2176 ,2519 ~2600 2144 ~2176 ,2519 ~2600 ≤4 cm−1 4.4% 2144 ~2176 ,2430 ~2491 ,2519 ~2600 2144 ~2176 ,2430 ~2492 ,2519 ~2600 ≤4 cm−1 4.6% 2144 ~2176 ,2430 ~2491 ,2519 ~2600 2144 ~2176 ,2430 ~2492 ,2519 ~2600 ≤4 cm−1  下载: 导出CSV
表 2 传统单波段与传统多波段以及自适应多波段联合浓度反演结果
Table 2. Inversion results of traditional single-band, traditional multi-band, and adaptive multi-band joint concentration methods
真实值 传统单波段浓度
反演结果Cn传统多波段浓度
反演结果$\bar{C} $自适应多波段联合
浓度反演结果Hn Ĉ 2.8% C1=2.83%
C2=2.72%2.775% H1=0.67
H2=0.332.794% 3.0% C1=2.93%
C2=3.13%3.030% H1=0.78
H2=0.222.968% 3.2% C1=3.15%
C2=3.35%3.250% H1=0.85
H2=0.153.180% 3.4% C1=3.35%
C2=3.26%3.305% H1=0.88
H2=0.123.339% 3.6% C1=3.63%
C2=3.51%3.570% H1=0.89
H2=0.113.616% 3.8% C1=3.83%
C2=3.89%3.860% H1=0.78
H2=0.223.843% 4.0% C1=4.03%
C2=3.88%3.955% H1=0.91
H2=0.094.016% 4.2% C1=4.17%
C2=4.31%4.240% H1=0.87
H2=0.134.188% 4.4% C1=4.43%
C2=4.37%
C3=4.48%4.427% H1=0.41
H2=0.39
H3=0.204.416% 4.6% C1=4.61%
C2=4.55%
C3=4.52%4.560% H1=0.73
H2=0.18
H3=0.094.591%
下载: 导出CSV
表 3 传统单波段与传统多波段浓度反演以及自适应多波段联合浓度反演算法评价结果
Table 3. The evaluation results of traditional single-band, traditional multi-band, and adaptive multi-band joint concentration inversion algorithms
S R2 RMSE MAE MRE 传统单波段浓度反演 22 0.9820 0.0796 0.0686 0.0191 传统多波段联合浓度反演 10 0.9928 0.0484 0.0442 0.0122 自适应多波段联合浓度反演 10 0.9976 0.0283 0.0231 0.0065
下载: 导出CSV
表 4 不同浓度N2O的相关系数
Table 4. The correlation coefficients of N2O with different concentrations
浓度 相关系数 2.0% 0.999177 2.2% 0.999622 2.4% 0.999286 2.6% 0.999139 4.8% 0.999201 5.0% 0.999148 5.2% 0.999172 5.4% 0.999379 5.6% 0.999485 5.8% 0.999521
下载: 导出CSV
表 5 SO2与CO的自适应多波段联合浓度反演算法评价结果
Table 5. The evaluation results of CO and SO2 by adaptive multi-band joint concentration inversion algorithm
气体 浓度\间隔 R2 RMSE MAE MRE SO2 1%~10%/1% 0.9652 0.0393 0.0237 0.0172 CO 0.1%~1%/0.1% 0.9943 0.0205 0.0147 0.0065
下载: 导出CSV
-
[1] CUISSET A, VENABLES D S, GAO X M, et al. Applications of spectroscopy in environmental monitoring of gases and aerosols[J]. Journal of Spectroscopy, 2016, 2016: 2575782. [2] YANG CH, ZHOU ZH Y, LI Y, et al. Measuring the tuning curve of spontaneous parameter downconversion using a comet-tail-like pattern[J]. Optics Letters, 2022, 47(4): 898-901. doi: 10.1364/OL.447674 [3] TALGHADER J J, GAWARIKAR A S, SHEA R P. Spectral selectivity in infrared thermal detection[J]. Light: Science & Applications, 2012, 1(8): e24. [4] ZHAO B X, LIANG J Q, LV J G, et al. Reducing the influence of systematic errors in interference core of stepped micro-mirror imaging fourier transform spectrometer: a novel calibration method[J]. Remote Sensing, 2023, 15(4): 985. doi: 10.3390/rs15040985 [5] 张璐, 李博, 李寒霜, 等. 超光谱分辨率紫外双通道共光路成像光谱仪设计[J]. 中国光学(中英文),2022,15(5):1029-1037. doi: 10.37188/CO.2022-0125ZHANG L, LI B, LI H SH, et al. Hyperspectral resolution ultraviolet dual channel common optical path imaging spectrometer[J]. Chinese Optics, 2022, 15(5): 1029-1037. (in Chinese). doi: 10.37188/CO.2022-0125 [6] LI A, YAO CH H, XIA J F, et al. Advances in cost-effective integrated spectrometers[J]. Light: Science & Applications, 2022, 11(1): 174. [7] ARRIGONE G M, HILTON M. Theory and practice in using Fourier transform infrared spectroscopy to detect hydrocarbons in emissions from gas turbine engines[J]. Fuel, 2005, 84(9): 1052-1058. doi: 10.1016/j.fuel.2005.01.018 [8] 刘成员, 于江玉, 李奉翠, 等. 拉曼光谱测试技术在可充电铝离子电池储能机理的研究进展[J]. 应用化学,2023,40(10):1347-1358.LIU CH Y, YU J Y, LI F C, et al. Research progress of Raman spectroscopy technique in energy storage mechanism of rechargeable aluminum-ion batteries[J]. Chinese Journal of Applied Chemistry, 2023, 40(10): 1347-1358. (in Chinese). [9] 仝大伟, 孔明, 向育斌. 含甲氧基四苯乙烯咪唑化合物的合成、光物理性质、理论计算及细胞成像[J]. 应用化学,2023,40(9):1322-1333.TONG D W, KONG M, XIANG Y B. Synthesis, photophysical properties, theoretical calculation and cell imaging of a tetraphenylethene imidazole compound with methoxy group[J]. Chinese Journal of Applied Chemistry, 2023, 40(9): 1322-1333. (in Chinese). [10] 舒开强, 陈友元, 彭郑英, 等. 铀矿中多目标元素的激光诱导击穿光谱定量分析方法研究[J]. 分析化学,2023,51(7):1195-1203.SHU K Q, CHEN Y Y, PENG ZH Y, et al. Laser-induced breakdown spectroscopy for quantitative analysis of multi-target elements in uranium ore[J]. Chinese Journal of Analytical Chemistry, 2023, 51(7): 1195-1203. (in Chinese). [11] 陈玥瑶, 夏静静, 韦芸, 等. 近红外光谱法无损检测平谷产大桃品质方法研究[J]. 分析化学,2023,51(3):454-462.CHEN Y Y, XIA J J, WEI Y, et al. Research on nondestructive quality test of Pinggu peach by near-infrared spectroscopy[J]. Chinese Journal of Analytical Chemistry, 2023, 51(3): 454-462. (in Chinese). [12] LI H L, DI S, LV W J, et al. Research on the measurement of CO2 concentration based on multi-band fusion model[J]. Applied Physics B, 2021, 127(1): 5. doi: 10.1007/s00340-020-07564-8 [13] CIĘSZCZYK S. A multi-band integrated virtual calibration-inversion method for open path ftir spectrometry[J]. Metrology and Measurement Systems, 2013, 20(2): 287-298. doi: 10.2478/mms-2013-0025 [14] 吴时超. 基于中波红外光谱信息的大气CO2反演方法[D]. 合肥: 中国科学技术大学, 2021.WU SH CH. Atmospheric CO2 inversion method based on mid-wave infrared spectral information[D]. Hefei: University of Science and Technology of China, 2021. (in Chinese). [15] WANG W ZH, WANG Y M, SONG W J, et al. Multiband infrared inversion for low-concentration methane monitoring in a confined dust-polluted atmosphere[J]. Applied Optics, 2017, 56(9): 2548-2555. doi: 10.1364/AO.56.002548 [16] 吴靖, 张朋朋, 黄峰, 等. NO2双通道光谱成像定量监测技术研究[J]. 仪器仪表学报,2022,43(4):155-162.WU J, ZHANG P P, HUANG F, et al. Research on quantitative monitoring technology of NO2 dual-channel spectral imaging[J]. Chinese Journal of Scientific Instrument, 2022, 43(4): 155-162. (in Chinese). [17] 周佳巧, 崔文楠, 张涛, 等. 基于光谱测量数据的自适应波段选择技术[J]. 激光与光电子学进展,2019,56(23):232501.ZHOU J Q, CUI W N, ZHANG T, et al. Adaptive band selection technique based on spectral measurement data[J]. Laser & Optoelectronics Progress, 2019, 56(23): 232501. (in Chinese). [18] HAALAND D M, HAN L, NIEMCZYK T M. Use of CLS to understand PLS IR calibration for trace detection of organic molecules in water[J]. Applied Spectroscopy, 1999, 53(4): 390-395. doi: 10.1366/0003702991946848 [19] CHUKWU R, MUGISA J, BROGIOLI D, et al. Statistical analysis of the measurement noise in dynamic impedance spectra[J]. Chemelectrochem, 2022, 9(14): e202200109. doi: 10.1002/celc.202200109 [20] 刘海涛, 魏汝祥, 蒋国萍. 基于加权偏最小二乘回归的软件成本估算方法[J]. 计算机工程,2012,38(21):36-39. doi: 10.3969/j.issn.1000-3428.2012.21.010LIU H T, WEI R X, JIANG G P. Software cost estimation method based on weighted partial least squares regression[J]. Computer Engineering, 2012, 38(21): 36-39. (in Chinese). doi: 10.3969/j.issn.1000-3428.2012.21.010 [21] 齐亚欣, 陈嵩. 一种基于多元回归的射线数字图像影响因子的权重分配方法[J]. 无损检测,2018,40(8):6-9,14. doi: 10.11973/wsjc201808002QI Y X, CHEN S. A weight assignment method for influencing factors of radiographic digital images based on multiple regression[J]. Nondestructive Testing, 2018, 40(8): 6-9,14. (in Chinese). doi: 10.11973/wsjc201808002 [22] CONDE O M, DE LA CRUZ J, RODRIGUEZ-COBO L, et al. Optimized image calibration for spectroscopic systems[C]. Proceedings of 2011 IEEE SENSORS, IEEE, 2011. [23] DRYJAŃSKI P. Error analysis of infrared transmission measurements: determination of baseline, choice of peak maximum and range truncation in band profile and integrated intensity determination[J]. Spectrochimica Acta Part A: Molecular and Biomolecular Spectroscopy, 1998, 54(2): 265-276. doi: 10.1016/S1386-1425(97)00215-1 [24] LIU H, ZHU J, YIN H, et al. Extreme learning machine and genetic algorithm in quantitative analysis of sulfur hexafluoride by infrared spectroscopy: erratum[J]. Applied Optics, 2023, 62(23): 6169-6170. doi: 10.1364/AO.499761 [25] ZHANG B, GAO CH, GUO Y C, et al. Measurement method for low-concentration SO2 based on statistics and DOAS[J]. Acta Photonica Sinica, 2018, 47(2): 0230001. [26] 程巳阳, 张天舒, 高闽光, 等. FTIR光谱高温气体浓度反演方法及残差结构分析[J]. 光谱学与光谱分析,2011,31(1):82-85. doi: 10.3964/j.issn.1000-0593(2011)01-0082-04CHENG S Y, ZHANG T SH, GAO M G, et al. Concentration inversion of high temperature air from FTIR spectra and analyzing residual error structure[J]. Spectroscopy and Spectral Analysis, 2011, 31(1): 82-85. (in Chinese). doi: 10.3964/j.issn.1000-0593(2011)01-0082-04 [27] NIE W, XU ZH Y, RAO G F, et al. Methods of tunable diode laser absorption saturation spectroscopy to gas sensing under optically thick conditions[J]. Microwave and Optical Technology Letters, 2021, 63(8): 2063-2067. doi: 10.1002/mop.32840 [28] CAI Y F, XU ZH, JI K F. Measurement and correction of instrumental profiles for the spectral data of the new vacuum solar telescope[J]. Solar Physics, 2020, 295(2): 31. doi: 10.1007/s11207-020-1598-0 [29] WANG F, MA S X, YAN G W. A PLS-based random forest for NOx emission measurement of power plant[J]. Chemometrics and Intelligent Laboratory Systems, 2023, 240: 104926. doi: 10.1016/j.chemolab.2023.104926 [30] PEI X K, GIDON D, YANG Y J, et al. Reducing energy cost of NO x production in air plasmas[J]. Chemical Engineering Journal, 2019, 362: 217-228. doi: 10.1016/j.cej.2019.01.011 -

 下载:
下载:

计量
- 文章访问数: 457
- HTML全文浏览量: 114
- PDF下载量: 186
- 被引次数: 0
