2020 Vol. 13, No. 5
2020, 13(5): 899-918.
doi: 10.37188/CO.2020-0035
cstr: 32171.14.CO.2020-0035
Abstract:
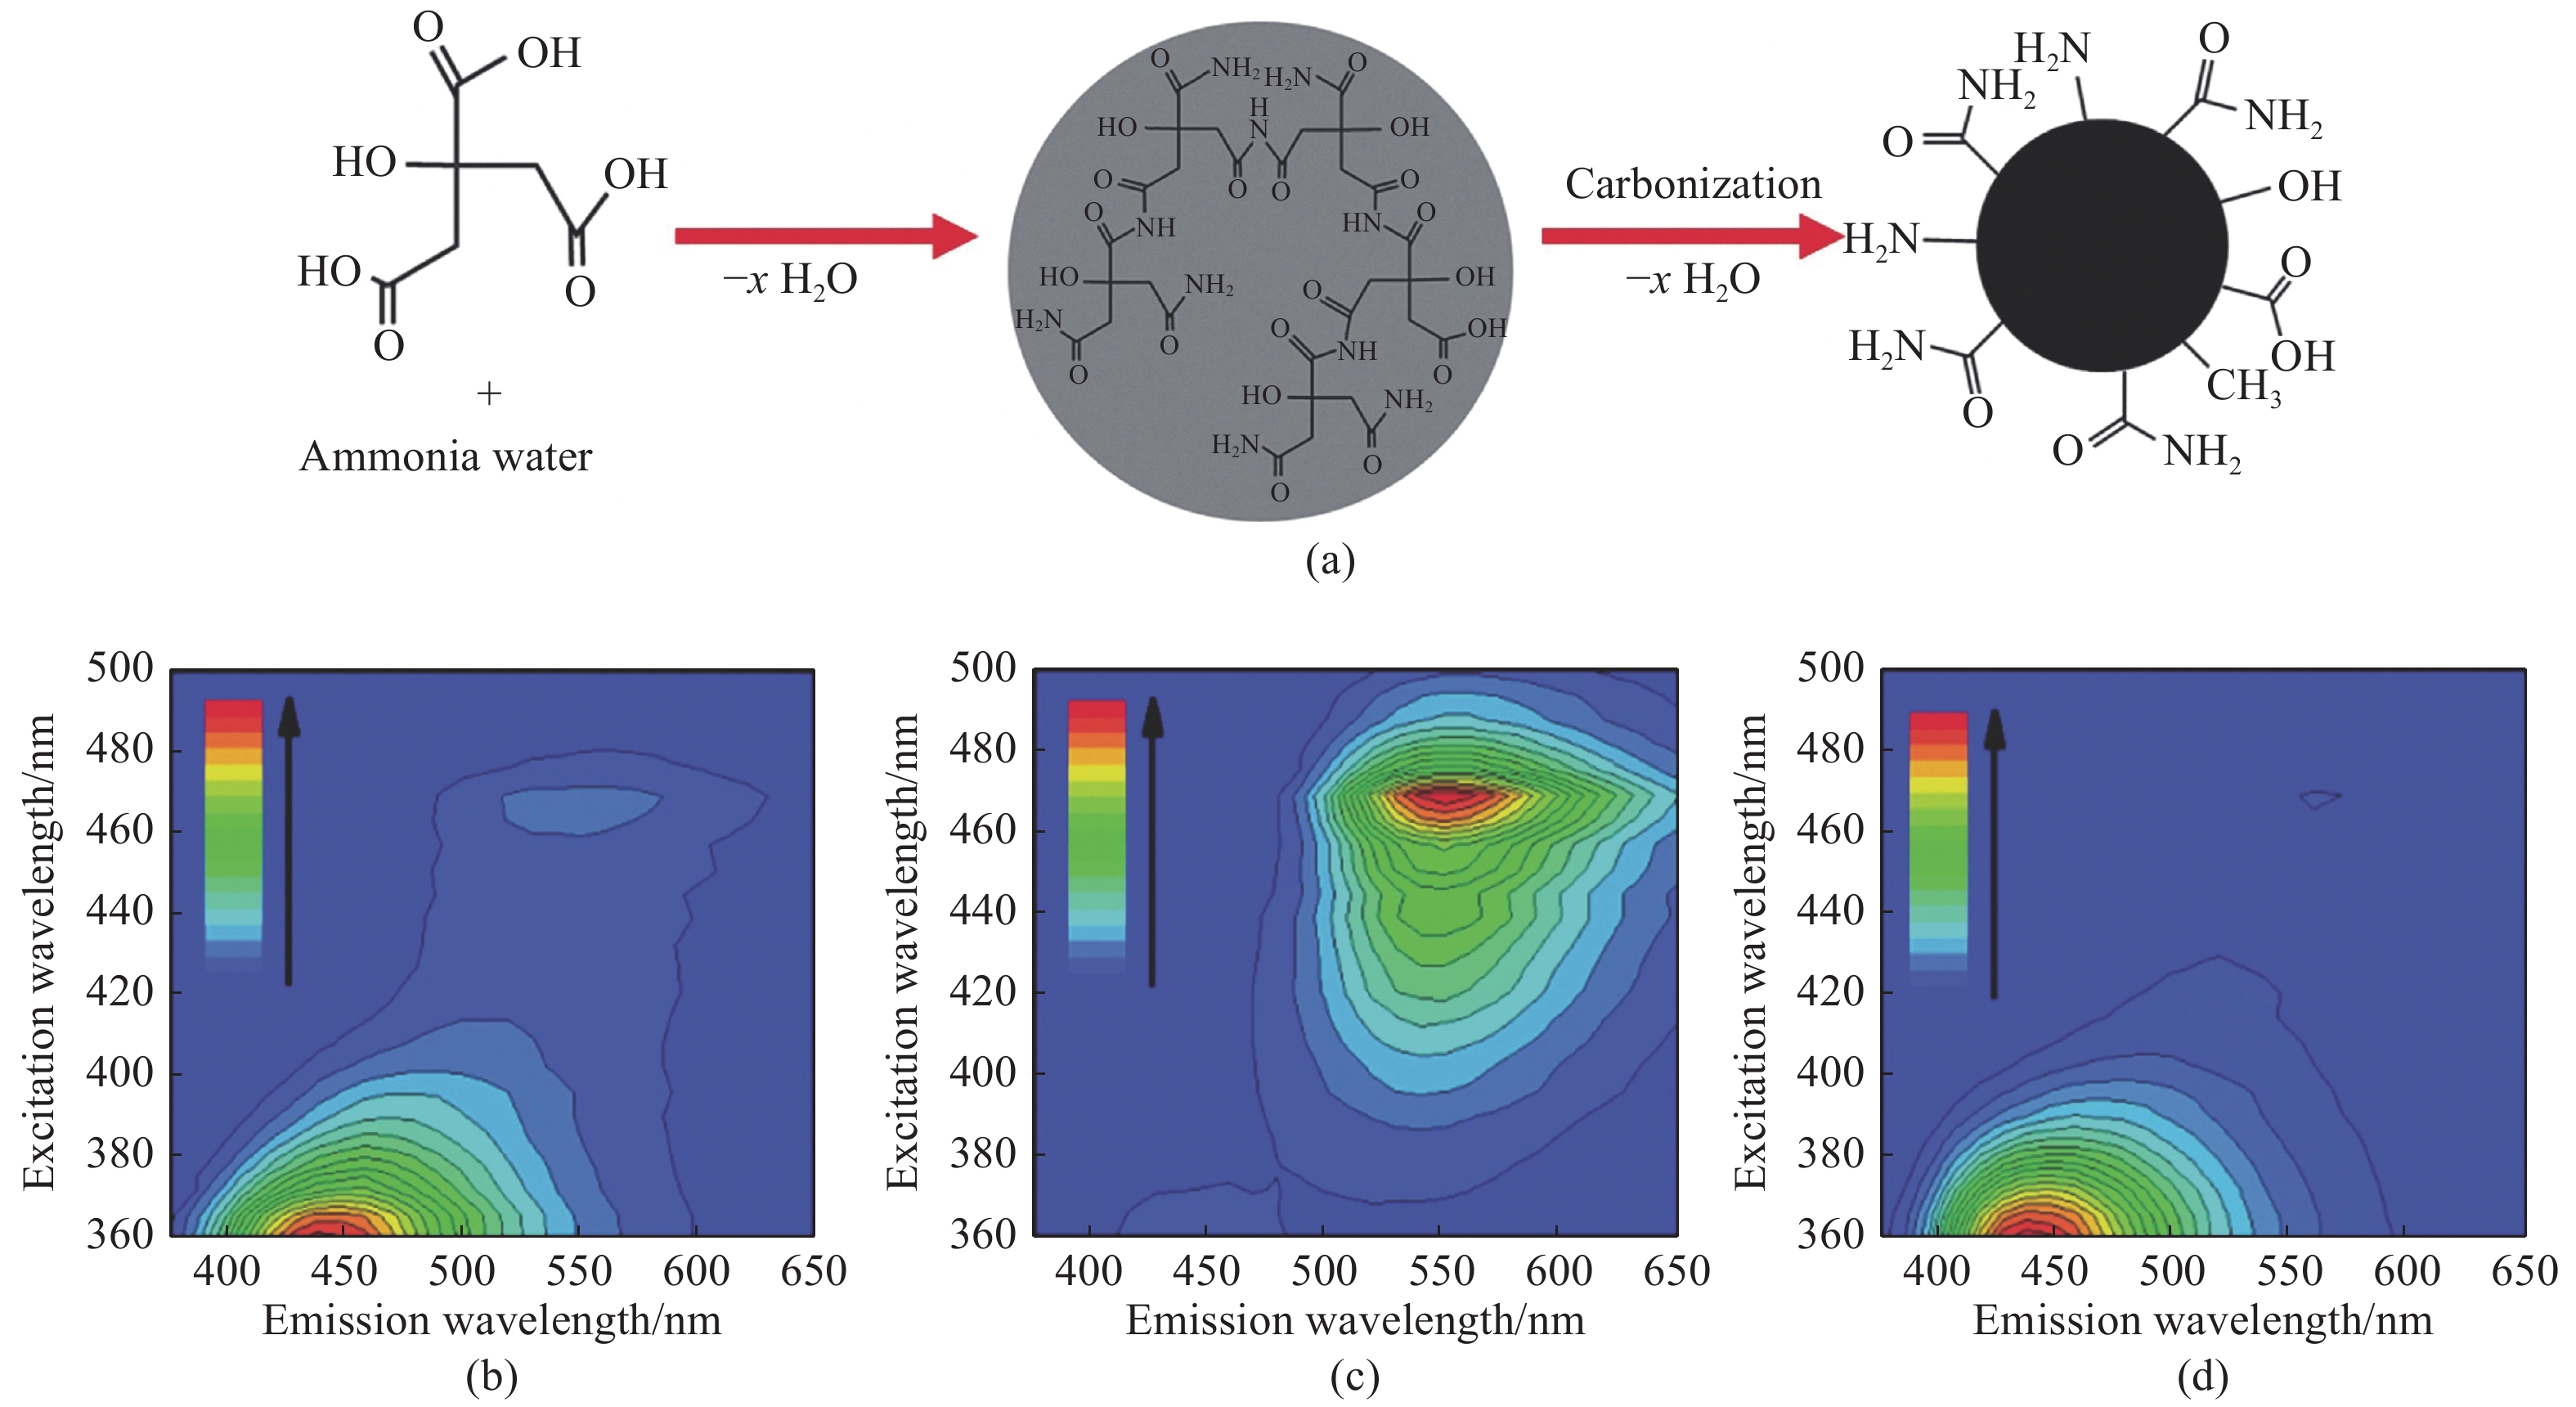
In recent years, carbon nanodot (CDs) have been widely researched due to their unique luminescent properties, good biocompatibility, low toxicity and high photostability. These characteristics invite potential applications in optoelectronic devices, visible light communication, tumor therapy, biological imaging and other fields. There are a variety of CDs according to the different starting materials and synthesis routes. In this paper, we will systematically review nitrogen-doped CDs synthesized from citric acid and urea as the main precursor materials in our group in recent years, discuss their physicochemical properties, explore the methods and principles of CDs energy band regulation, and introduce the application progress of CDs.
In recent years, carbon nanodot (CDs) have been widely researched due to their unique luminescent properties, good biocompatibility, low toxicity and high photostability. These characteristics invite potential applications in optoelectronic devices, visible light communication, tumor therapy, biological imaging and other fields. There are a variety of CDs according to the different starting materials and synthesis routes. In this paper, we will systematically review nitrogen-doped CDs synthesized from citric acid and urea as the main precursor materials in our group in recent years, discuss their physicochemical properties, explore the methods and principles of CDs energy band regulation, and introduce the application progress of CDs.
2020, 13(5): 919-935.
doi: 10.37188/CO.2020-0037
cstr: 32171.14.CO.2020-0037
Abstract:
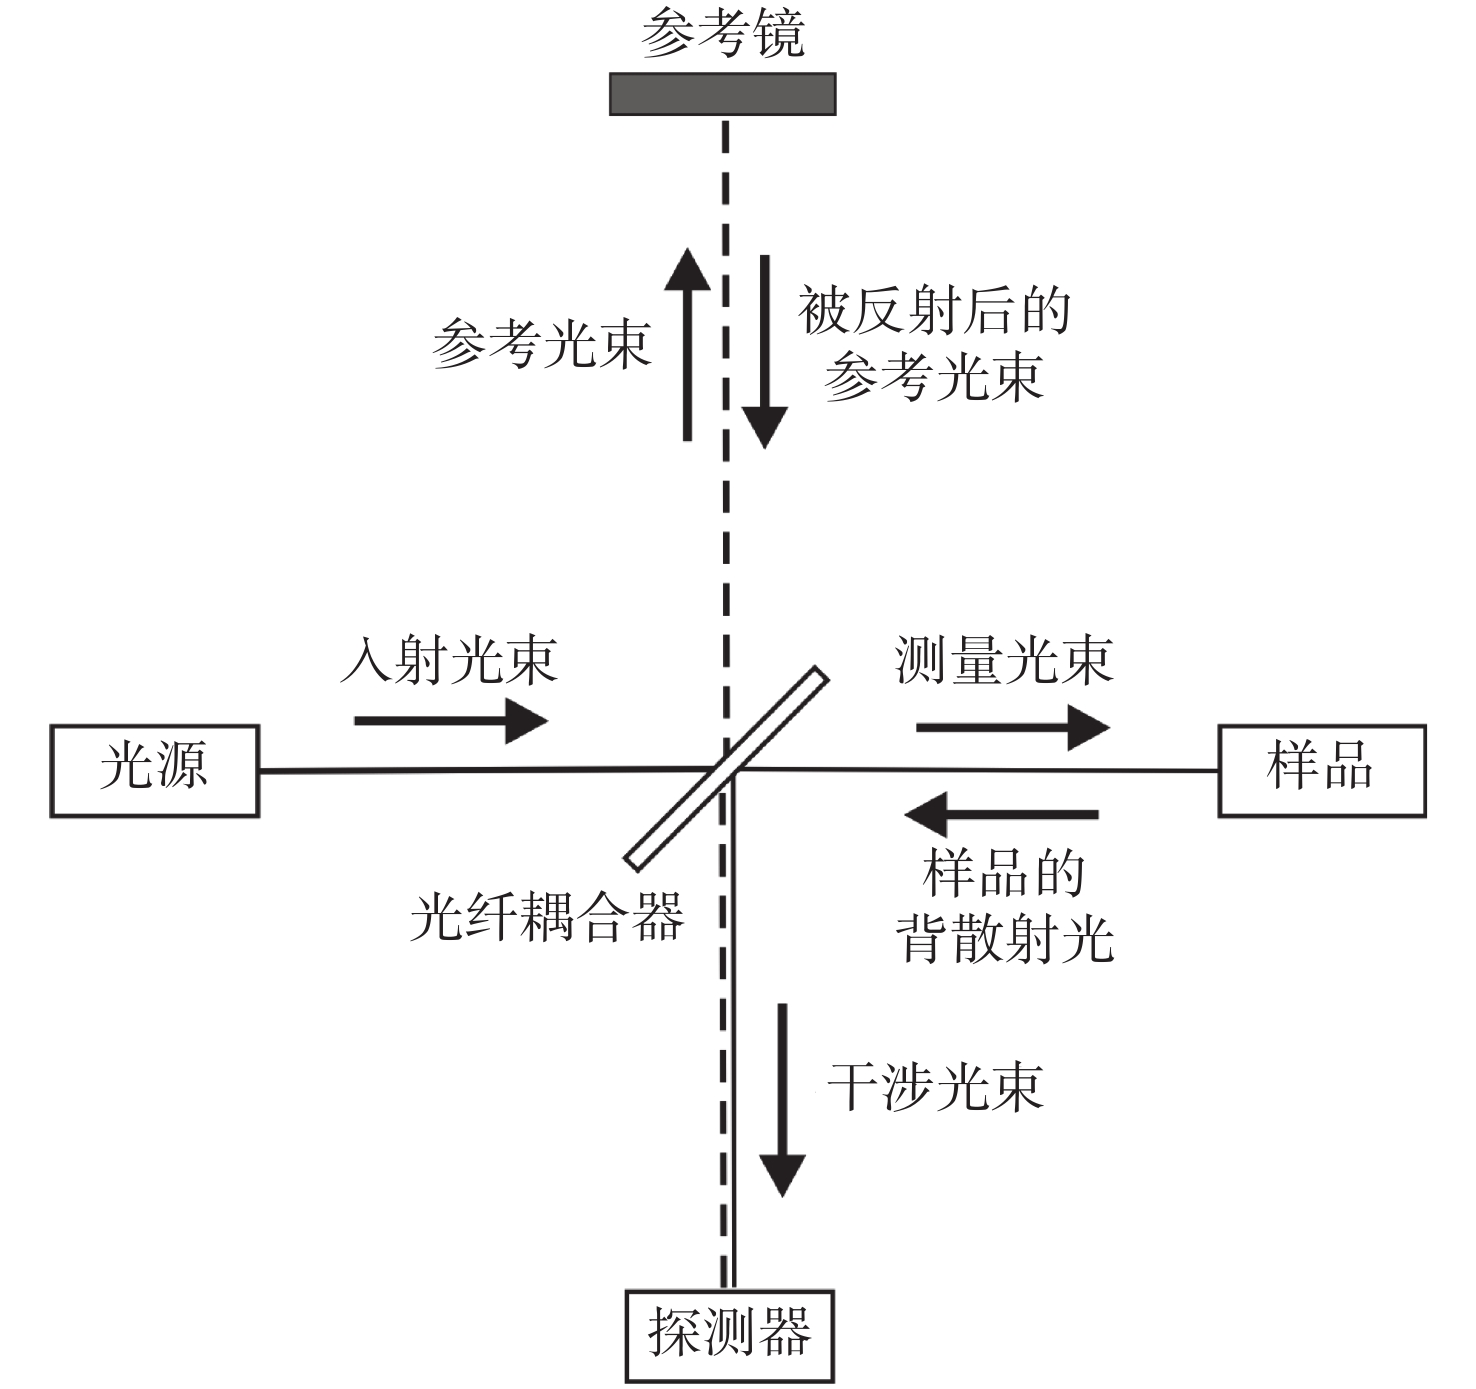
Optical Coherence Tomography (OCT) is a new imaging technique that uses interference in low coherent light by measuring the delay and magnitude of backscattered or reflected signals from the sample. OCT technology can provide real-time structural information with one-dimensional depth and two- and three-dimensional tomography at micron-scale resolution. Besides its high spatial resolution, OCT imaging is beneficial for its non-contact and non-invasive methodology. The system is also easy to operate and relatively portable. OCT technology is mainly applied in the biomedical imaging field for diagnoses, making up for the shortcomings of the low penetration depth in confocal microscopes and the low resolution in ultrasonic imaging. At present, OCT technology has been used as the clinical standard for the diagnosis of retinal diseases, and the combination of OCT technology and endoscope technology has become an important tool for the clinical diagnosis of cardiovascular and gastrointestinal diseases. It also provides references for early cancer diagnosis, surgical guidance and postoperative rehabilitation of musculoskeletal diseases. To broaden the application of OCT technology and improve its medical detection capabilities, researchers are committed to increasing the penetration depth of OCT imaging in biological tissue, improving the system's resolution and signal-to-noise ratio, and optimizing its overall performance. This review introduces the principle and classification of OCT systems, their applications and their recent progress in various biomedical fields.
Optical Coherence Tomography (OCT) is a new imaging technique that uses interference in low coherent light by measuring the delay and magnitude of backscattered or reflected signals from the sample. OCT technology can provide real-time structural information with one-dimensional depth and two- and three-dimensional tomography at micron-scale resolution. Besides its high spatial resolution, OCT imaging is beneficial for its non-contact and non-invasive methodology. The system is also easy to operate and relatively portable. OCT technology is mainly applied in the biomedical imaging field for diagnoses, making up for the shortcomings of the low penetration depth in confocal microscopes and the low resolution in ultrasonic imaging. At present, OCT technology has been used as the clinical standard for the diagnosis of retinal diseases, and the combination of OCT technology and endoscope technology has become an important tool for the clinical diagnosis of cardiovascular and gastrointestinal diseases. It also provides references for early cancer diagnosis, surgical guidance and postoperative rehabilitation of musculoskeletal diseases. To broaden the application of OCT technology and improve its medical detection capabilities, researchers are committed to increasing the penetration depth of OCT imaging in biological tissue, improving the system's resolution and signal-to-noise ratio, and optimizing its overall performance. This review introduces the principle and classification of OCT systems, their applications and their recent progress in various biomedical fields.
2020, 13(5): 936-964.
doi: 10.37188/CO.2020-0010
cstr: 32171.14.CO.2020-0010
Abstract:
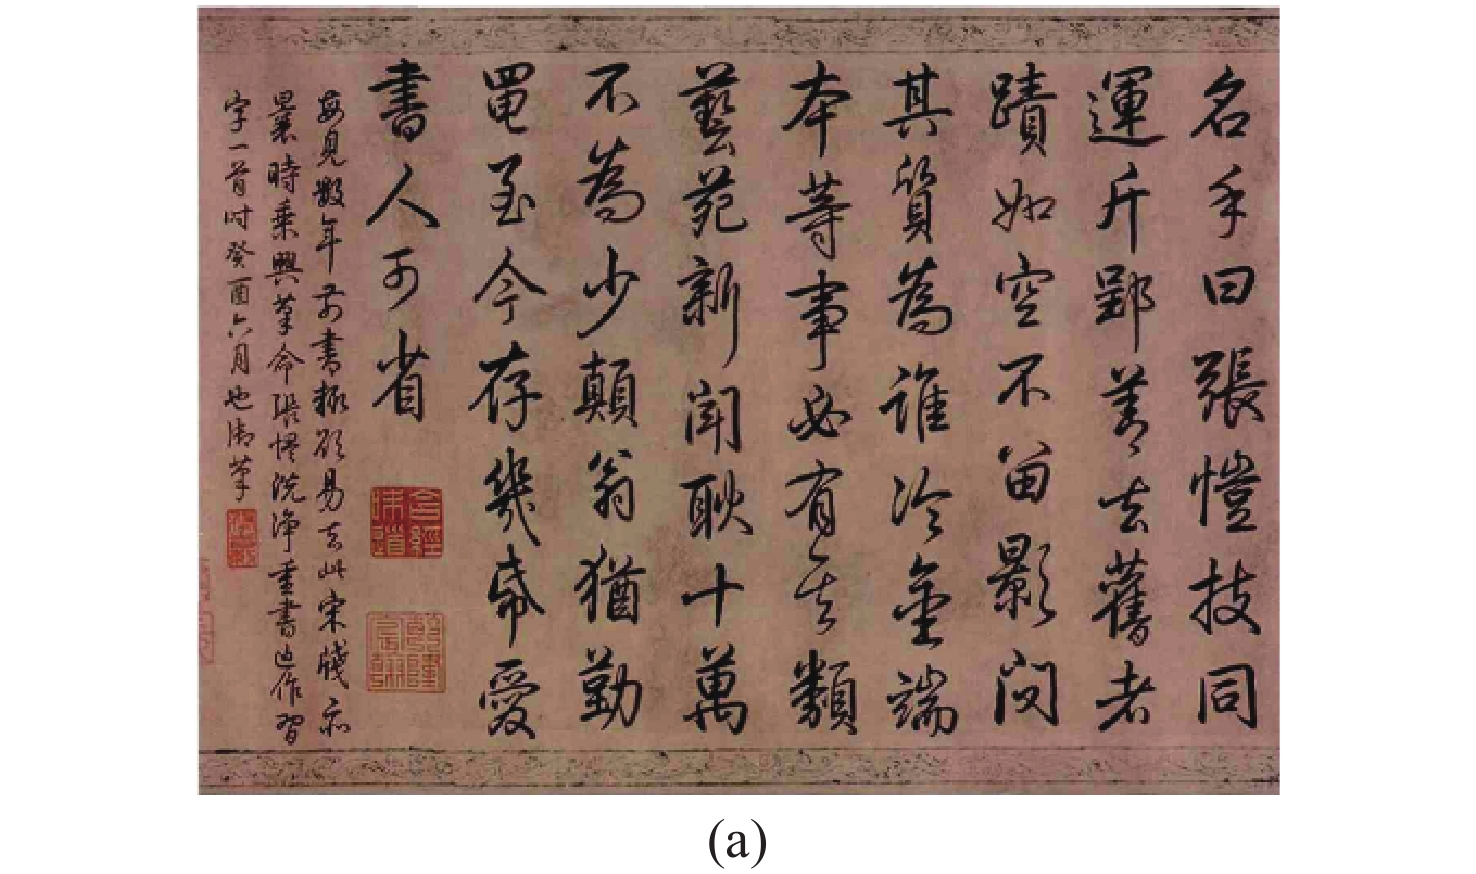
This paper comprehensively discusses all kinds of modern scientific and technological detection methods for paper raw materials, inks, inkpads, and pigments used in ancient paper cultural relics, including imaging and spectrometric technologies. Relevant imaging methods include photography, tomography and microscopic imaging methods. Photographic methods include light transmission, infrared, ultraviolet, X-ray and neutron activation photography to display macroscopic information on a sample’s surface or inside. Tomography methods include X-ray, terahertz, and optical coherence tomographic methods to display layered information beneath the sample’s surface. Microscopic imaging methods include optical, scanning electron, transmission electron and atomic force microscopic imaging methods to display the sample’s microscopic information. Spectroscopy methods with fingerprint characteristics based on the principles of wave-matter interactions include chromatography, mass spectrometry, electron paramagnetic resonance spectroscopy, nuclear magnetic resonance spectroscopy, X-ray photoelectron spectroscopy, X-ray diffraction, X-ray fluorescence spectrum, molecular fluorescence spectrum, Raman spectrum, UV-Vis-NIR-MID-THz absorption spectrum and hyperspectral methods. It shows that the comprehensive applications, complementary advantages and mutual confirmations of the above technologies are powerful means to reveal important traits of paper cultural relics, such as one’s manufacturing process, artistic features, preservation history, disease status, authenticity, method of reparation, etc.
This paper comprehensively discusses all kinds of modern scientific and technological detection methods for paper raw materials, inks, inkpads, and pigments used in ancient paper cultural relics, including imaging and spectrometric technologies. Relevant imaging methods include photography, tomography and microscopic imaging methods. Photographic methods include light transmission, infrared, ultraviolet, X-ray and neutron activation photography to display macroscopic information on a sample’s surface or inside. Tomography methods include X-ray, terahertz, and optical coherence tomographic methods to display layered information beneath the sample’s surface. Microscopic imaging methods include optical, scanning electron, transmission electron and atomic force microscopic imaging methods to display the sample’s microscopic information. Spectroscopy methods with fingerprint characteristics based on the principles of wave-matter interactions include chromatography, mass spectrometry, electron paramagnetic resonance spectroscopy, nuclear magnetic resonance spectroscopy, X-ray photoelectron spectroscopy, X-ray diffraction, X-ray fluorescence spectrum, molecular fluorescence spectrum, Raman spectrum, UV-Vis-NIR-MID-THz absorption spectrum and hyperspectral methods. It shows that the comprehensive applications, complementary advantages and mutual confirmations of the above technologies are powerful means to reveal important traits of paper cultural relics, such as one’s manufacturing process, artistic features, preservation history, disease status, authenticity, method of reparation, etc.
2020, 13(5): 965-974.
doi: 10.37188/CO.2020-0079
cstr: 32171.14.CO.2020-0079
Abstract:
An algorithm for fast calculation of the field distribution of diffraction based on two-dimension chirp Z transformation is proposed. The proposed algorithm does not increase computation and significantly improves the resolution of the diffraction distribution and obtains a more accurate beam quality β factor. After verifying the correctness of the proposed algorithm, the corresponding relationship between the RMS (Root-Mean-Square) of the beam′s wavefront aberration and β factor is simulated. The simulation results show that with the same RMS value, the effect of a spherical aberration on the β factor is the strongest among the lower order Zernike aberrations. In order to simulate the different distribution of beam spots, the β factors are calculated based on different random Zernike wavefront aberrations. The results indicate that a larger proportion of high-order Zernike aberrations in the cumulative aberrations induces a bigger β factor with an identical RMS value.
An algorithm for fast calculation of the field distribution of diffraction based on two-dimension chirp Z transformation is proposed. The proposed algorithm does not increase computation and significantly improves the resolution of the diffraction distribution and obtains a more accurate beam quality β factor. After verifying the correctness of the proposed algorithm, the corresponding relationship between the RMS (Root-Mean-Square) of the beam′s wavefront aberration and β factor is simulated. The simulation results show that with the same RMS value, the effect of a spherical aberration on the β factor is the strongest among the lower order Zernike aberrations. In order to simulate the different distribution of beam spots, the β factors are calculated based on different random Zernike wavefront aberrations. The results indicate that a larger proportion of high-order Zernike aberrations in the cumulative aberrations induces a bigger β factor with an identical RMS value.
2020, 13(5): 975-987.
doi: 10.37188/CO.2020-0083
cstr: 32171.14.CO.2020-0083
Abstract:
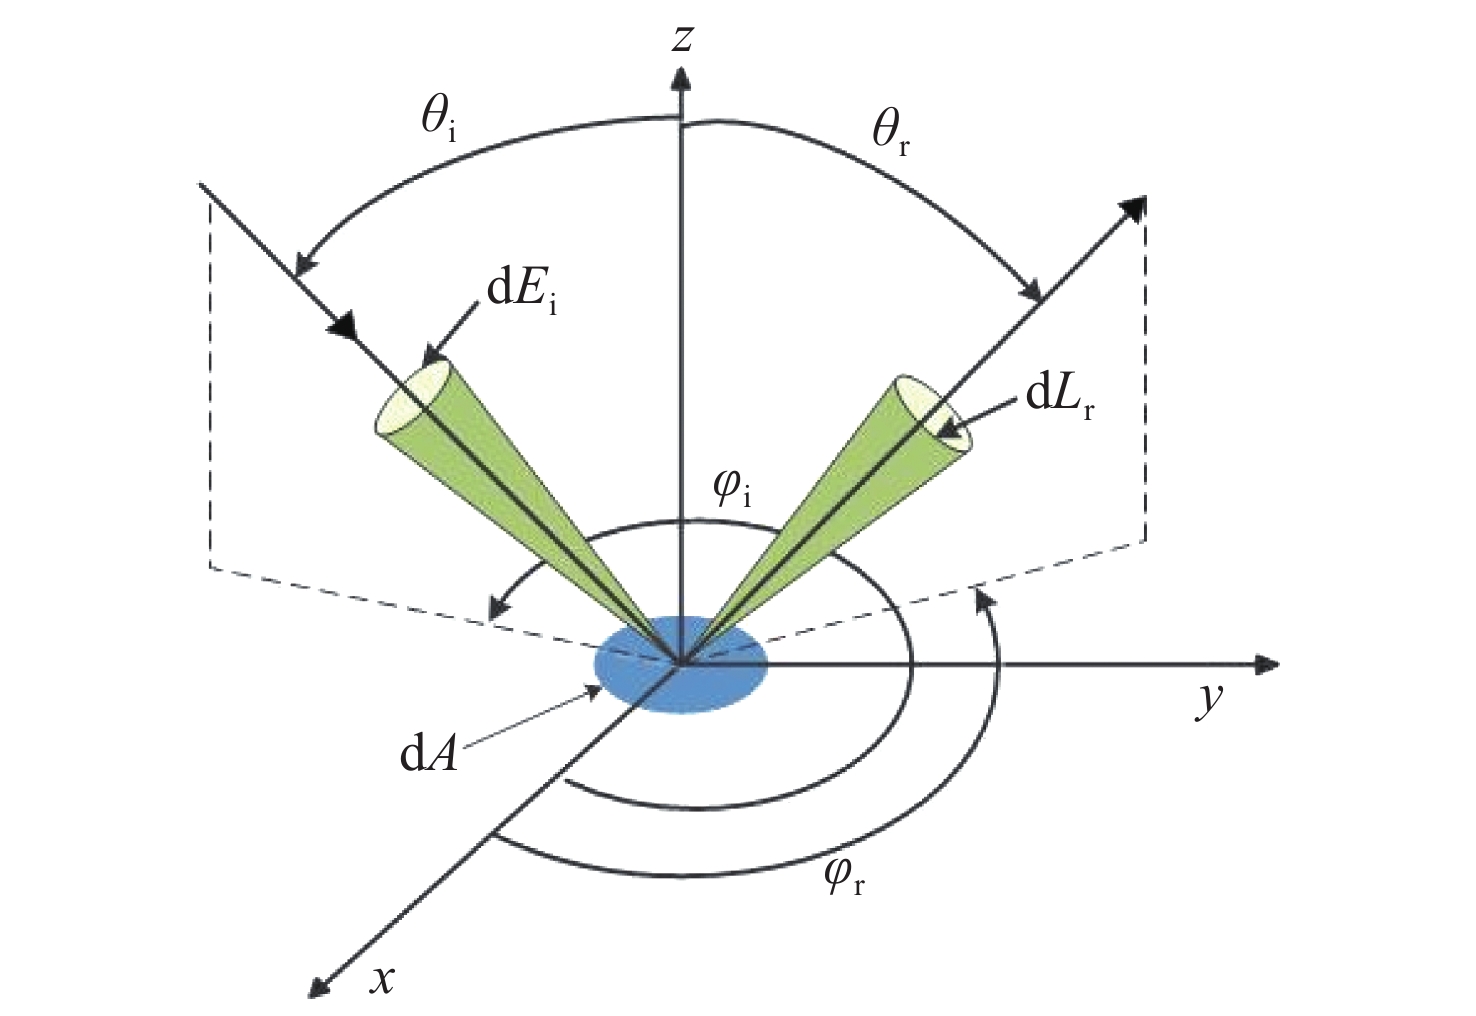
In order to distinguish between the two types of surface defects such as dust on the surface and bubble particles below the surface, and to obtain the applicable environmental range and optimal observation conditions of the method, we established and verified two polarization scattering models for surface defects based on Rayleigh scattering theory and a polarization bidirectional reflection distribution function. On this basis, the effects of the different defect environments and different observation conditions on the polarization scattering characteristics of the two surface defect particles were obtained through simulation analysis. The results show that by detecting the changing trend of the bidirectional reflection distribution function value of the p-polarized light incident on the surface with the scattering azimuth angle, we can distinguish between the two surface defects; no matter how the position of the bubble particles under the surface change, it will not affect the change of the trend. Different optical element surface materials, defect particle types, and defect particle size have certain effects on the polarization scattering models of the two surface defects, but the overall relationship remains unchanged. In order to distinguish between the two types of surface defects described in this article, the incident angle and the detection scattering angle are both 45° and an incident light with a smaller wavelength is used in an experiment.
In order to distinguish between the two types of surface defects such as dust on the surface and bubble particles below the surface, and to obtain the applicable environmental range and optimal observation conditions of the method, we established and verified two polarization scattering models for surface defects based on Rayleigh scattering theory and a polarization bidirectional reflection distribution function. On this basis, the effects of the different defect environments and different observation conditions on the polarization scattering characteristics of the two surface defect particles were obtained through simulation analysis. The results show that by detecting the changing trend of the bidirectional reflection distribution function value of the p-polarized light incident on the surface with the scattering azimuth angle, we can distinguish between the two surface defects; no matter how the position of the bubble particles under the surface change, it will not affect the change of the trend. Different optical element surface materials, defect particle types, and defect particle size have certain effects on the polarization scattering models of the two surface defects, but the overall relationship remains unchanged. In order to distinguish between the two types of surface defects described in this article, the incident angle and the detection scattering angle are both 45° and an incident light with a smaller wavelength is used in an experiment.
2020, 13(5): 988-994.
doi: 10.37188/CO.2020-0064
cstr: 32171.14.CO.2020-0064
Abstract:
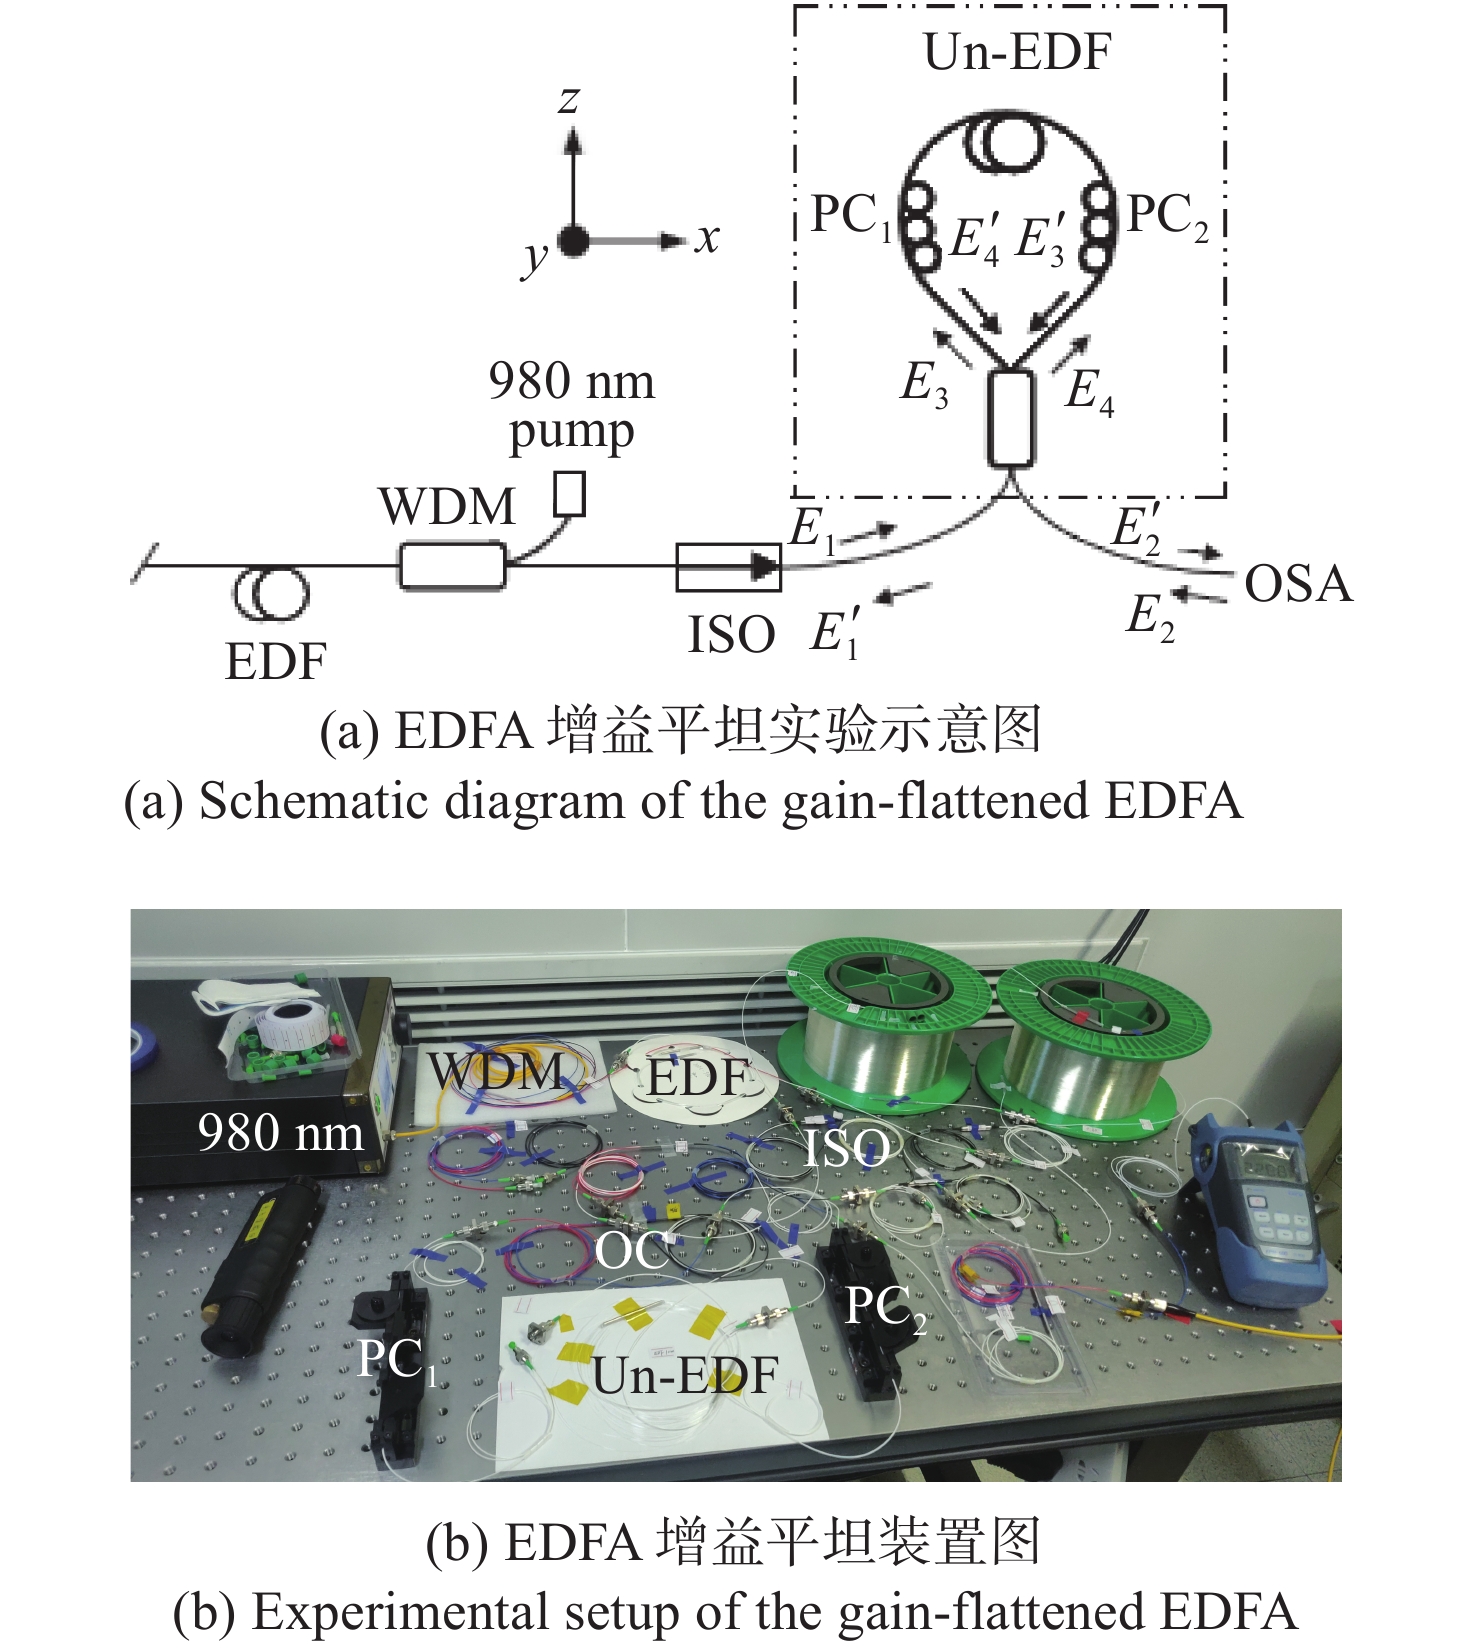
In order to achieve the simultaneous adjustment of multi-channel gain in the communications, especially in WDM, and to develop a wide range of stable light outputs in multi-wavelength fiber lasers, a research scheme of the erbium-doped fiber amplifier gain flattening characteristic at the transmission-port of a Sagnac loop with an unpumped erbium-doped fiber is proposed. The scheme is a combination of the self-resonance mode of the Sagnac loop, the absorption characteristics of unpumped erbium-doped fiber and the resonance mode caused by birefringence beat length in the loop. By adjusting the polarization controllers properly in the loop, the gain spectrum can be partially or completely flattened at the transmission port of the Sagnac loop. The results show that, on one hand, the part of the spectrum is flatted within ±0.145 dB in the wavelength range of 14 nm at the transmission port, but on the other hand, the total spectrum is flatted within ±1.225 dB over a bandwidth of 36.5 nm in the whole C-band at the transmission port. The gain spectrum flattening scheme has a simple structure and good flatness of the output spectrum. It is expected that this technology will be used in WDM systems and multi-wavelength lasers.
In order to achieve the simultaneous adjustment of multi-channel gain in the communications, especially in WDM, and to develop a wide range of stable light outputs in multi-wavelength fiber lasers, a research scheme of the erbium-doped fiber amplifier gain flattening characteristic at the transmission-port of a Sagnac loop with an unpumped erbium-doped fiber is proposed. The scheme is a combination of the self-resonance mode of the Sagnac loop, the absorption characteristics of unpumped erbium-doped fiber and the resonance mode caused by birefringence beat length in the loop. By adjusting the polarization controllers properly in the loop, the gain spectrum can be partially or completely flattened at the transmission port of the Sagnac loop. The results show that, on one hand, the part of the spectrum is flatted within ±0.145 dB in the wavelength range of 14 nm at the transmission port, but on the other hand, the total spectrum is flatted within ±1.225 dB over a bandwidth of 36.5 nm in the whole C-band at the transmission port. The gain spectrum flattening scheme has a simple structure and good flatness of the output spectrum. It is expected that this technology will be used in WDM systems and multi-wavelength lasers.
2020, 13(5): 995-1000.
doi: 10.37188/CO.2019-0195
cstr: 32171.14.CO.2019-0195
Abstract:
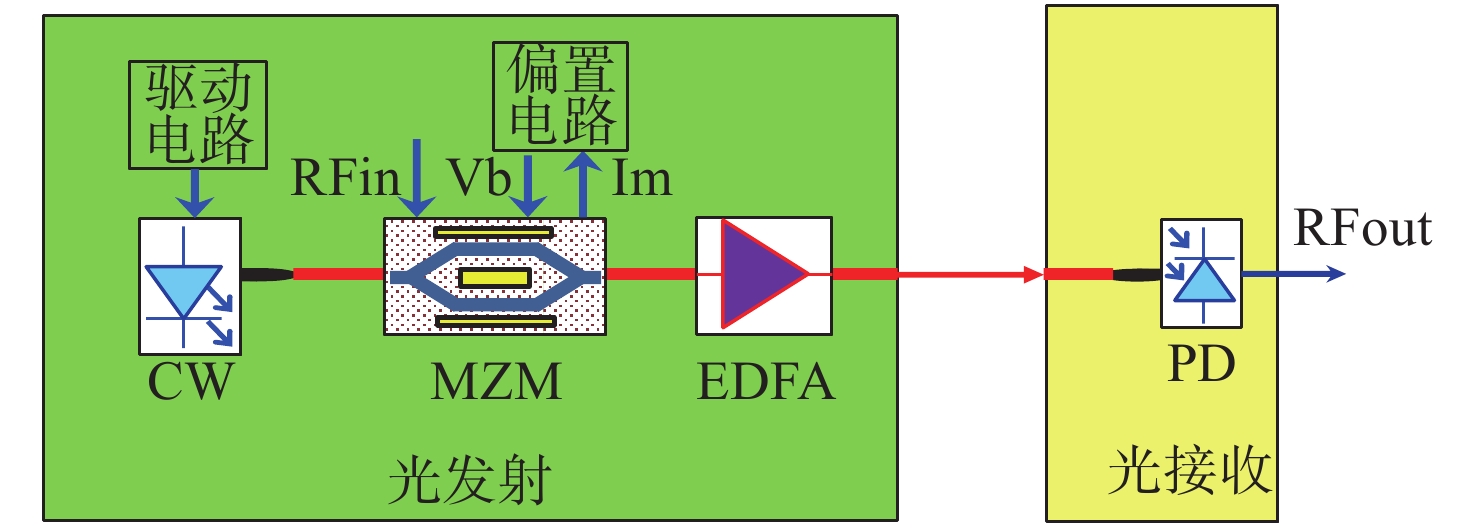
Photonics have long been viewed as an enabling technology that extends the sensing and signal processing performances of Radio Frequency (RF) remoting systems such as radar and electronic-warfare because of its inherent advantages in multi-octave operating frequencies, broad instantaneous bandwidth, low transmission loss, and good phase linearity. In order to improve the efficiency of the analog optical transmitter during electronic-to-optical conversion, an Erbium-Doped Fiber Amplifier (EDFA) combing with a low-bias modulator in an external intensity modulation direct detection link is applied. According to our analysis, the RF gain reduces linearly with modulator’s optical power output when the bias becomes close to its minimum. Thus, the gain provided by the EDFA to the optical signal was transferred to increase RF transmission efficiency. Experimental results indicated that the RF gain improved by 13.5 dB compared to that of conventional quadrature bias point transmissions. Meanwhile, a small penalty is introduced to system noise. Most importantly, this can be achieved by using off-the-shelf devices, which can drastically reduce the system’s cost. Finally, the proposed scheme can be widely used in electronic information equipment.
Photonics have long been viewed as an enabling technology that extends the sensing and signal processing performances of Radio Frequency (RF) remoting systems such as radar and electronic-warfare because of its inherent advantages in multi-octave operating frequencies, broad instantaneous bandwidth, low transmission loss, and good phase linearity. In order to improve the efficiency of the analog optical transmitter during electronic-to-optical conversion, an Erbium-Doped Fiber Amplifier (EDFA) combing with a low-bias modulator in an external intensity modulation direct detection link is applied. According to our analysis, the RF gain reduces linearly with modulator’s optical power output when the bias becomes close to its minimum. Thus, the gain provided by the EDFA to the optical signal was transferred to increase RF transmission efficiency. Experimental results indicated that the RF gain improved by 13.5 dB compared to that of conventional quadrature bias point transmissions. Meanwhile, a small penalty is introduced to system noise. Most importantly, this can be achieved by using off-the-shelf devices, which can drastically reduce the system’s cost. Finally, the proposed scheme can be widely used in electronic information equipment.
2020, 13(5): 1001-1013.
doi: 10.37188/CO.2020-0078
cstr: 32171.14.CO.2020-0078
Abstract:
In order to achieve high-speed electro-optic hybrid operation of half-adders and solve their disadvantages in speed, energy consumption and size, a silicon waveguide integrated electro-optic half-adder is designed based on an Epsilon-Near-Zero and ITO electrical-tunable film. The ITO electrical-tunable film is used as the switch for the optical path, and thus achieve the half-add function of two binary numbers. Simulation results show that the device unit can complete the optical signal logic control when the applied voltage is 0 V and 2.35 V. When the hybrid electro-optic half-adder works at a wavelength of 1550 nm, the insertion loss is 0.63 dB, the extinction ratio is 31.73 dB, the data transmission rate is 61.62 GHz, the energy consumption per bit is 13.44 fJ, and the size of the whole half-adder is less than 21.3 μm×1.5 μm×1.2 μm. The device is compact and has a low insertion loss. This provides a theoretical foundation for the design of high-speed hybrid electro-optic logic devices and half-adders.
In order to achieve high-speed electro-optic hybrid operation of half-adders and solve their disadvantages in speed, energy consumption and size, a silicon waveguide integrated electro-optic half-adder is designed based on an Epsilon-Near-Zero and ITO electrical-tunable film. The ITO electrical-tunable film is used as the switch for the optical path, and thus achieve the half-add function of two binary numbers. Simulation results show that the device unit can complete the optical signal logic control when the applied voltage is 0 V and 2.35 V. When the hybrid electro-optic half-adder works at a wavelength of 1550 nm, the insertion loss is 0.63 dB, the extinction ratio is 31.73 dB, the data transmission rate is 61.62 GHz, the energy consumption per bit is 13.44 fJ, and the size of the whole half-adder is less than 21.3 μm×1.5 μm×1.2 μm. The device is compact and has a low insertion loss. This provides a theoretical foundation for the design of high-speed hybrid electro-optic logic devices and half-adders.
2020, 13(5): 1014-1022.
doi: 10.37188/CO.2019-0251
cstr: 32171.14.CO.2019-0251
Abstract:
Most actual vibration signals measured by lidar are time-varying signals. Methods of time-frequency analysis based on Fourier transforms are effective tools for processing time-varying signals. In this paper, the properties of the Wigner-Wiley distribution, the smooth pseudo-Wigner-Wiley distribution, the spectrogram, the Bonn-Jordan distribution, and the extended modified B distribution are compared and analyzed with actual vibration signals measured by laser Doppler radar. Three kinds of vibrations are measured with a laser Doppler radar: chirps generated by a single loudspeaker, two-component chirps generated by two loudspeakers, and adult male heartbeat vibrations. Their time-frequency distribution resolution and the suppression of cross-terms are analyzed. By calculating the time-frequency concentration index, the analysis capacites of the five distributions for three vibrations are compared. Experimental results indicate that the performance of the extended modified B distribution is better than that of the other four time-frequency distributions. Therefore, the extended modified B distribution is more suitable for the detection of material resonance frequency of laser Doppler radar and the detection of heartbeat.
Most actual vibration signals measured by lidar are time-varying signals. Methods of time-frequency analysis based on Fourier transforms are effective tools for processing time-varying signals. In this paper, the properties of the Wigner-Wiley distribution, the smooth pseudo-Wigner-Wiley distribution, the spectrogram, the Bonn-Jordan distribution, and the extended modified B distribution are compared and analyzed with actual vibration signals measured by laser Doppler radar. Three kinds of vibrations are measured with a laser Doppler radar: chirps generated by a single loudspeaker, two-component chirps generated by two loudspeakers, and adult male heartbeat vibrations. Their time-frequency distribution resolution and the suppression of cross-terms are analyzed. By calculating the time-frequency concentration index, the analysis capacites of the five distributions for three vibrations are compared. Experimental results indicate that the performance of the extended modified B distribution is better than that of the other four time-frequency distributions. Therefore, the extended modified B distribution is more suitable for the detection of material resonance frequency of laser Doppler radar and the detection of heartbeat.
2020, 13(5): 1023-1031.
doi: 10.37188/CO.2020-0022
cstr: 32171.14.CO.2020-0022
Abstract:
In order to investigate the temperature response and thermal damage of a 6061 aluminum alloy after variations in spot size of continuous laser irradiation, a three-dimensional physical model under laser irradiation was established based on ANSYS finite element software. First, we used different laser parameters to carry out laser irradiation experiments, and then, based on the collected temperature and front surface scattered light intensity data, we calculated the dynamic changes in the absorptivity of the target during laser irradiation. Finally, the optimized model was used to analyze the temperature rise characteristics of the target irradiated by lasers at different spot sizes. The research results show that the absorption rate of the material increases with an increase in temperature under 1000 W/cm2 laser irradiation. Due to the localized characteristics of laser loading, lateral thermal diffusion affects the longitudinal temperature rise, and its effect becomes smaller when the spot is larger, as related with the alloy’s thermal diffusion length. For the 6061 aluminum alloy material with a thickness of 4 mm, when the spot size is greater than 10 cm, the effect of the spot’s size is negligible, and the time threshold of fusion damage on the back surface of the target remains unchanged at 2.6 s.
In order to investigate the temperature response and thermal damage of a 6061 aluminum alloy after variations in spot size of continuous laser irradiation, a three-dimensional physical model under laser irradiation was established based on ANSYS finite element software. First, we used different laser parameters to carry out laser irradiation experiments, and then, based on the collected temperature and front surface scattered light intensity data, we calculated the dynamic changes in the absorptivity of the target during laser irradiation. Finally, the optimized model was used to analyze the temperature rise characteristics of the target irradiated by lasers at different spot sizes. The research results show that the absorption rate of the material increases with an increase in temperature under 1000 W/cm2 laser irradiation. Due to the localized characteristics of laser loading, lateral thermal diffusion affects the longitudinal temperature rise, and its effect becomes smaller when the spot is larger, as related with the alloy’s thermal diffusion length. For the 6061 aluminum alloy material with a thickness of 4 mm, when the spot size is greater than 10 cm, the effect of the spot’s size is negligible, and the time threshold of fusion damage on the back surface of the target remains unchanged at 2.6 s.
Nondestructive grading test of rice seed activity using near infrared super-continuum laser spectrum
2020, 13(5): 1032-1043.
doi: 10.37188/CO.2020-0027
cstr: 32171.14.CO.2020-0027
Abstract:
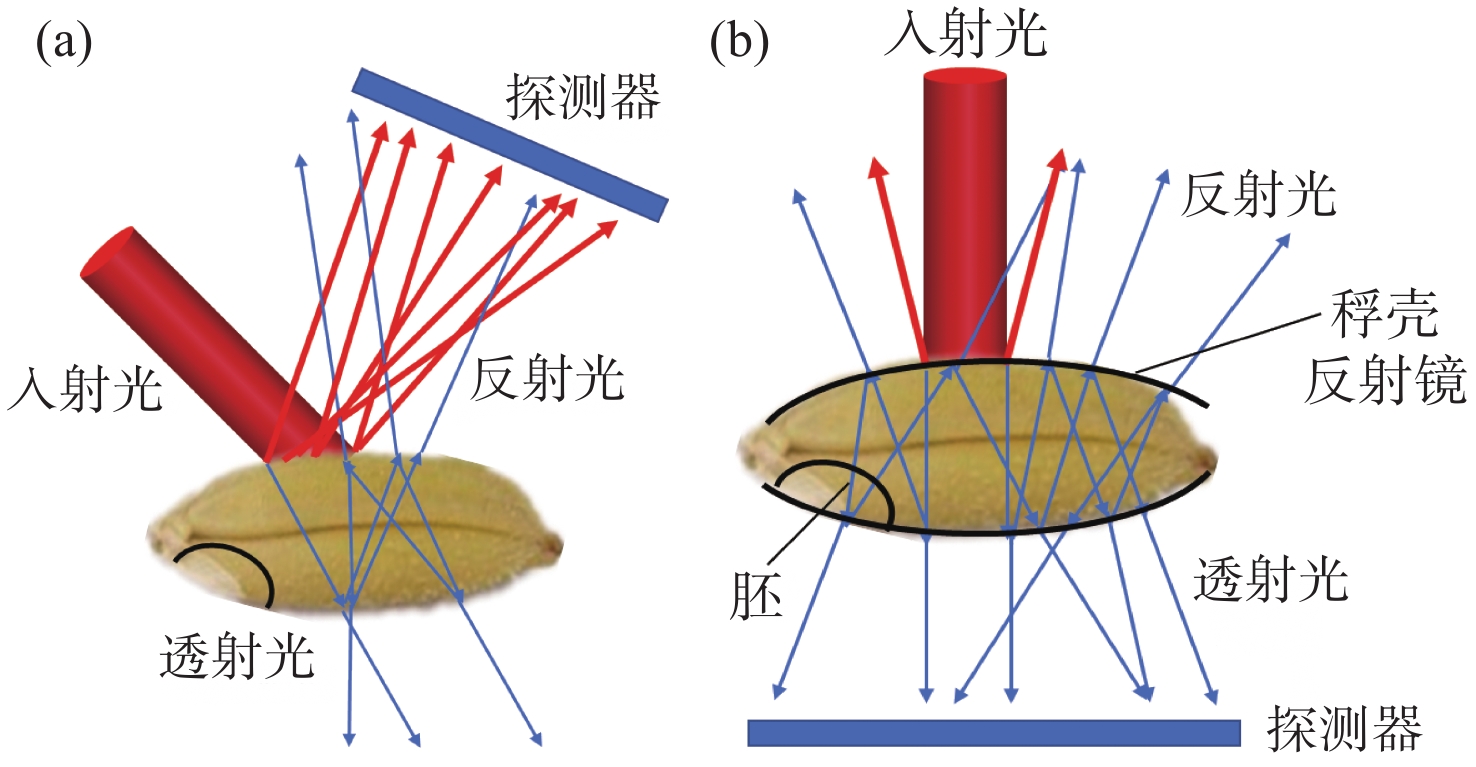
In view of the urgent need for seed selection technology in agriculture and for grading detection of the vigor of three different years of unpeeled rice seeds, we proposed a new method of detecting the vigor of rice seeds based on near-infrared super-continuous laser spectrum to overcome the significant issues in pre-existing universal brown rice detection technology. Firstly, we design a near-infrared absorption spectroscopy system with which we detect seed viability and measure the NIR spectra of three different years of unpeeled rice seeds. The results show that the activity gradient of the rice seeds is correlated with the characteristic absorption peak of their NIR absorption spectrum. Then, the spectrum of seed is optimized with a pretreatment algorithm of normalization, second derivative correction and orthogonal signal correction. Finally, a Principal Component Analysis (PCA) model is established to reduce the dimension of the spectrum and determine the optimal number of principal components. A Partial Least Squares Discriminant Analysis (PLS-DA) model is established. The analysis results show that the transmission absorption spectrum detection system designed in this paper combined with the PLS-DA discrimination model can classify rice seeds of different vigor with an accuracy of 94.44% and 95.92%. After screening, the germination rate of rice seeds can reach 97.17%. The results show that it is feasible to achieve non-destructive classification of rice seed activity using near-infrared spectroscopy with high accuracy.
In view of the urgent need for seed selection technology in agriculture and for grading detection of the vigor of three different years of unpeeled rice seeds, we proposed a new method of detecting the vigor of rice seeds based on near-infrared super-continuous laser spectrum to overcome the significant issues in pre-existing universal brown rice detection technology. Firstly, we design a near-infrared absorption spectroscopy system with which we detect seed viability and measure the NIR spectra of three different years of unpeeled rice seeds. The results show that the activity gradient of the rice seeds is correlated with the characteristic absorption peak of their NIR absorption spectrum. Then, the spectrum of seed is optimized with a pretreatment algorithm of normalization, second derivative correction and orthogonal signal correction. Finally, a Principal Component Analysis (PCA) model is established to reduce the dimension of the spectrum and determine the optimal number of principal components. A Partial Least Squares Discriminant Analysis (PLS-DA) model is established. The analysis results show that the transmission absorption spectrum detection system designed in this paper combined with the PLS-DA discrimination model can classify rice seeds of different vigor with an accuracy of 94.44% and 95.92%. After screening, the germination rate of rice seeds can reach 97.17%. The results show that it is feasible to achieve non-destructive classification of rice seed activity using near-infrared spectroscopy with high accuracy.
2020, 13(5): 1044-1054.
doi: 10.37188/CO.2019-0203
cstr: 32171.14.CO.2019-0203
Abstract:
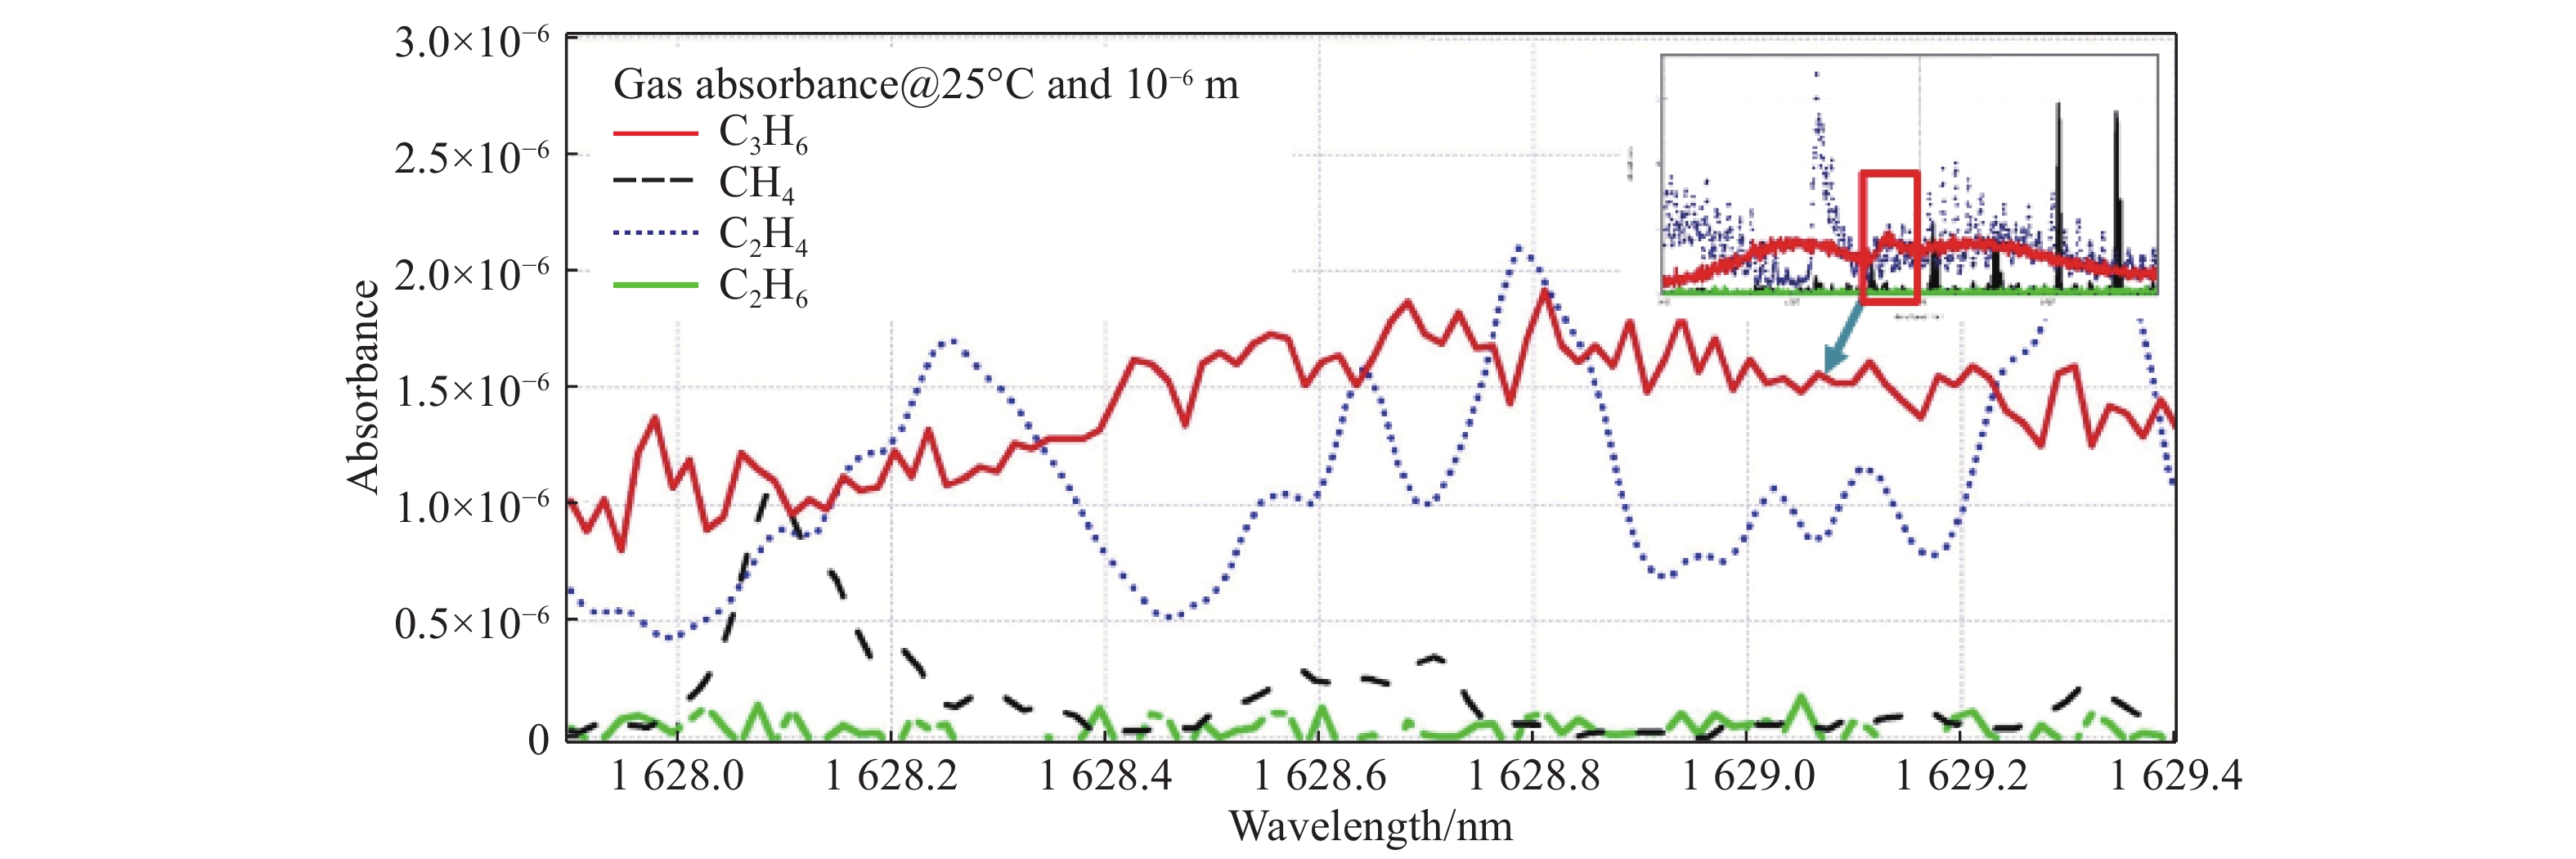
To satisfy the need for propylene measurement in the olefin production process, Tunable Diode Laser Absorption Spectroscopy (TDLAS) was studied to improve analytical performance. In this paper, a numerical simulation approach is proposed using absorbance from a spectral database to obtain the optimized design parameters, which is independent of spectral features. In the simulation, the effect of a wider linewidth laser on the absorbance profile was considered. Through the comparison of simulation results and experimental collection, the TDLAS-based propylene analysis apparatus was developed correspondingly. It has a 1 628.5 nm center wavelength broad-tuning DFB laser. A differential method was utilized in demodulated spectral acquisition to eliminate bias voltage. The multivariate linear regression model was employed to reduce the strong spectral interference from the background components in the analysis. Based on the simulated field test, the max relative error is 0.55% in the 0~1% range for the step test. For the long-term test, the standard deviation (1σ) is 9.3×10⁻⁶ for 0.2% propylene concentration. The best standard deviation is 1.33×10⁻⁶ at 221.9 s of integration time through Allen variance analysis. In the anti-interference test, the max error of 19.17×10⁻⁶ is demonstrated for 0.2% propylene concentration while methane and ethylene concentrations vary. The disadvantages of traditional methods such as the Gas Chromatogram (GC) and soft measurement methods are overcome by modulated absorption spectroscopy. The TDLAS system for heavy hydrocarbon detection with complex spectral features was demonstrated to have distinct advantages in precision, stability and interference suppression through multivariate regression modeling.
To satisfy the need for propylene measurement in the olefin production process, Tunable Diode Laser Absorption Spectroscopy (TDLAS) was studied to improve analytical performance. In this paper, a numerical simulation approach is proposed using absorbance from a spectral database to obtain the optimized design parameters, which is independent of spectral features. In the simulation, the effect of a wider linewidth laser on the absorbance profile was considered. Through the comparison of simulation results and experimental collection, the TDLAS-based propylene analysis apparatus was developed correspondingly. It has a 1 628.5 nm center wavelength broad-tuning DFB laser. A differential method was utilized in demodulated spectral acquisition to eliminate bias voltage. The multivariate linear regression model was employed to reduce the strong spectral interference from the background components in the analysis. Based on the simulated field test, the max relative error is 0.55% in the 0~1% range for the step test. For the long-term test, the standard deviation (1σ) is 9.3×10⁻⁶ for 0.2% propylene concentration. The best standard deviation is 1.33×10⁻⁶ at 221.9 s of integration time through Allen variance analysis. In the anti-interference test, the max error of 19.17×10⁻⁶ is demonstrated for 0.2% propylene concentration while methane and ethylene concentrations vary. The disadvantages of traditional methods such as the Gas Chromatogram (GC) and soft measurement methods are overcome by modulated absorption spectroscopy. The TDLAS system for heavy hydrocarbon detection with complex spectral features was demonstrated to have distinct advantages in precision, stability and interference suppression through multivariate regression modeling.
2020, 13(5): 1055-1064.
doi: 10.37188/CO.2020-0034
cstr: 32171.14.CO.2020-0034
Abstract:
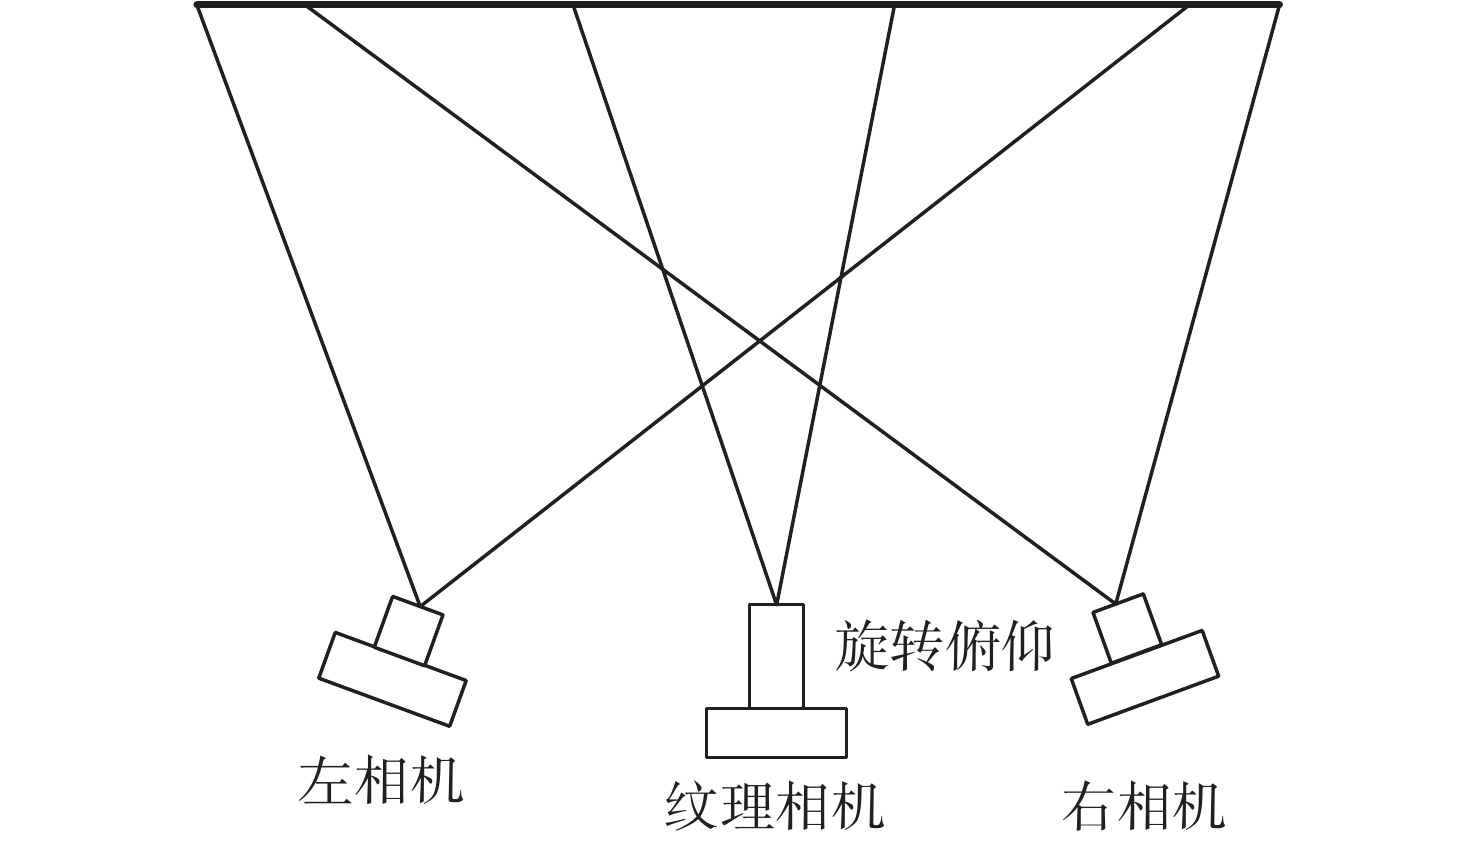
Aiming at the fusion problem of binocular stereo vision reconstruction point cloud models and high-resolution texture images, a new texture mapping method is proposed. Adding a telephoto texture camera to the binocular stereo vision system to capture high-resolution texture images, the relationship between a texture image and a 3D point cloud model is obtained by matching the two-dimensional features of the high-resolution texture image and the binocular image. The binocular image is used as a bridge, thereby achieving the high-resolution mapping of high-rate texture images on 3D point cloud models. In view of the data redundancy of the overlapping parts of the multi-view texture images during mapping, a method of partitioning the guidance point cloud data is proposed, which effectively solves the problem. Through experimental verification, the proposed method can conveniently and accurately map multi-view texture images to binocular 3D point cloud models. Under experimental conditions, the texture of the 3D model can distinguish line pairs with an original line width of 0.157 mm, which is double the texture resolution of the 3D model directly generated by the binocular system, This verifies the effectiveness of the proposed multi-view high-resolution texture mapping method.
Aiming at the fusion problem of binocular stereo vision reconstruction point cloud models and high-resolution texture images, a new texture mapping method is proposed. Adding a telephoto texture camera to the binocular stereo vision system to capture high-resolution texture images, the relationship between a texture image and a 3D point cloud model is obtained by matching the two-dimensional features of the high-resolution texture image and the binocular image. The binocular image is used as a bridge, thereby achieving the high-resolution mapping of high-rate texture images on 3D point cloud models. In view of the data redundancy of the overlapping parts of the multi-view texture images during mapping, a method of partitioning the guidance point cloud data is proposed, which effectively solves the problem. Through experimental verification, the proposed method can conveniently and accurately map multi-view texture images to binocular 3D point cloud models. Under experimental conditions, the texture of the 3D model can distinguish line pairs with an original line width of 0.157 mm, which is double the texture resolution of the 3D model directly generated by the binocular system, This verifies the effectiveness of the proposed multi-view high-resolution texture mapping method.
2020, 13(5): 1065-1074.
doi: 10.37188/CO.2020-0003
cstr: 32171.14.CO.2020-0003
Abstract:
In order to achieve fast three-dimensional localization of high-density fluorescent molecular images, a three-dimensional compressed sensing model was established and studied using the CVX method, the Orthogonal Matching Pursuit(OMP) algorithm and a homotopy algorithm. The models’ measurement matrix was then designed. Firstly, the system’s theory and design were both developed using the three-dimensional point-spread function imaging theory of fluorescence microscopy. Then, the process of fluorescence microscopic imaging was simulated, through which the images generated in the established compressed sensing model were analyzed using the CVX method, OMP algorithm and homotopy algorithm. The recall rate, localization accuracy and reconstruction time were compared. Finally, the simulated biological samples and the collected cells in the laboratory were analyzed using the homotopy algorithm, and thus three-dimensional super-resolution imaging was achieved. It can be seen from the comparative results that the homotopy algorithm is two orders of magnitude faster than the CVX method when the reconstruction density and localization accuracy have little deviation. The localization accuracy of the homotopy algorithm is twice higher than that of the OMP algorithm. The homotopy algorithm is meaningful for 3D super-resolution fluorescence microscopy imaging, which can save computing time and achieve real-time imaging.
In order to achieve fast three-dimensional localization of high-density fluorescent molecular images, a three-dimensional compressed sensing model was established and studied using the CVX method, the Orthogonal Matching Pursuit(OMP) algorithm and a homotopy algorithm. The models’ measurement matrix was then designed. Firstly, the system’s theory and design were both developed using the three-dimensional point-spread function imaging theory of fluorescence microscopy. Then, the process of fluorescence microscopic imaging was simulated, through which the images generated in the established compressed sensing model were analyzed using the CVX method, OMP algorithm and homotopy algorithm. The recall rate, localization accuracy and reconstruction time were compared. Finally, the simulated biological samples and the collected cells in the laboratory were analyzed using the homotopy algorithm, and thus three-dimensional super-resolution imaging was achieved. It can be seen from the comparative results that the homotopy algorithm is two orders of magnitude faster than the CVX method when the reconstruction density and localization accuracy have little deviation. The localization accuracy of the homotopy algorithm is twice higher than that of the OMP algorithm. The homotopy algorithm is meaningful for 3D super-resolution fluorescence microscopy imaging, which can save computing time and achieve real-time imaging.
2020, 13(5): 1075-1084.
doi: 10.37188/CO.2020-0025
cstr: 32171.14.CO.2020-0025
Abstract:
To address the weakness and discontinuity of the edges and the uneven distribution of gray in ultrasonic images, an improved edge extraction algorithm based on a multi-parameter Gabor filter and multiscale local level set method is proposed. With the grayscale inhomogeneity of ultrasound images being regarded as texture in different directions, the directionalities of the Gabor wavelet are adopted to filter at different angles. An intermediate image is obtained to isolate the difference between each region and the background, which will allow the retention of the original image by maximizing it with a fusion method. The Gabor filter kernel with multi-center frequency meets the complex frequency distribution characteristics of ultrasound images, and the mean fusion method is used to maximize the information in the image while reducing noise influence. For the edge of the ultrasound image is weak and the grayscale is uneven, the local intensity clustering level set method is improved. A Gaussian convolution kernel template is applied with different variance sizes to fit the grayscale changes in different parts of the image. Testing the ultrasound images of a stomach show that correlation coefficient and sensitivity coefficient reaches 0.856 and 0.910, respectively, which is a 20.7% and 5% improvement over the traditional LIC algorithm, respectively. This method can satisfy the system requirements where non-contact, online, real-time, higher precision and rapid speed strong anti-jamming and stabilization are needed.
To address the weakness and discontinuity of the edges and the uneven distribution of gray in ultrasonic images, an improved edge extraction algorithm based on a multi-parameter Gabor filter and multiscale local level set method is proposed. With the grayscale inhomogeneity of ultrasound images being regarded as texture in different directions, the directionalities of the Gabor wavelet are adopted to filter at different angles. An intermediate image is obtained to isolate the difference between each region and the background, which will allow the retention of the original image by maximizing it with a fusion method. The Gabor filter kernel with multi-center frequency meets the complex frequency distribution characteristics of ultrasound images, and the mean fusion method is used to maximize the information in the image while reducing noise influence. For the edge of the ultrasound image is weak and the grayscale is uneven, the local intensity clustering level set method is improved. A Gaussian convolution kernel template is applied with different variance sizes to fit the grayscale changes in different parts of the image. Testing the ultrasound images of a stomach show that correlation coefficient and sensitivity coefficient reaches 0.856 and 0.910, respectively, which is a 20.7% and 5% improvement over the traditional LIC algorithm, respectively. This method can satisfy the system requirements where non-contact, online, real-time, higher precision and rapid speed strong anti-jamming and stabilization are needed.
2020, 13(5): 1085-1093.
doi: 10.37188/CO.2019-0221
cstr: 32171.14.CO.2019-0221
Abstract:
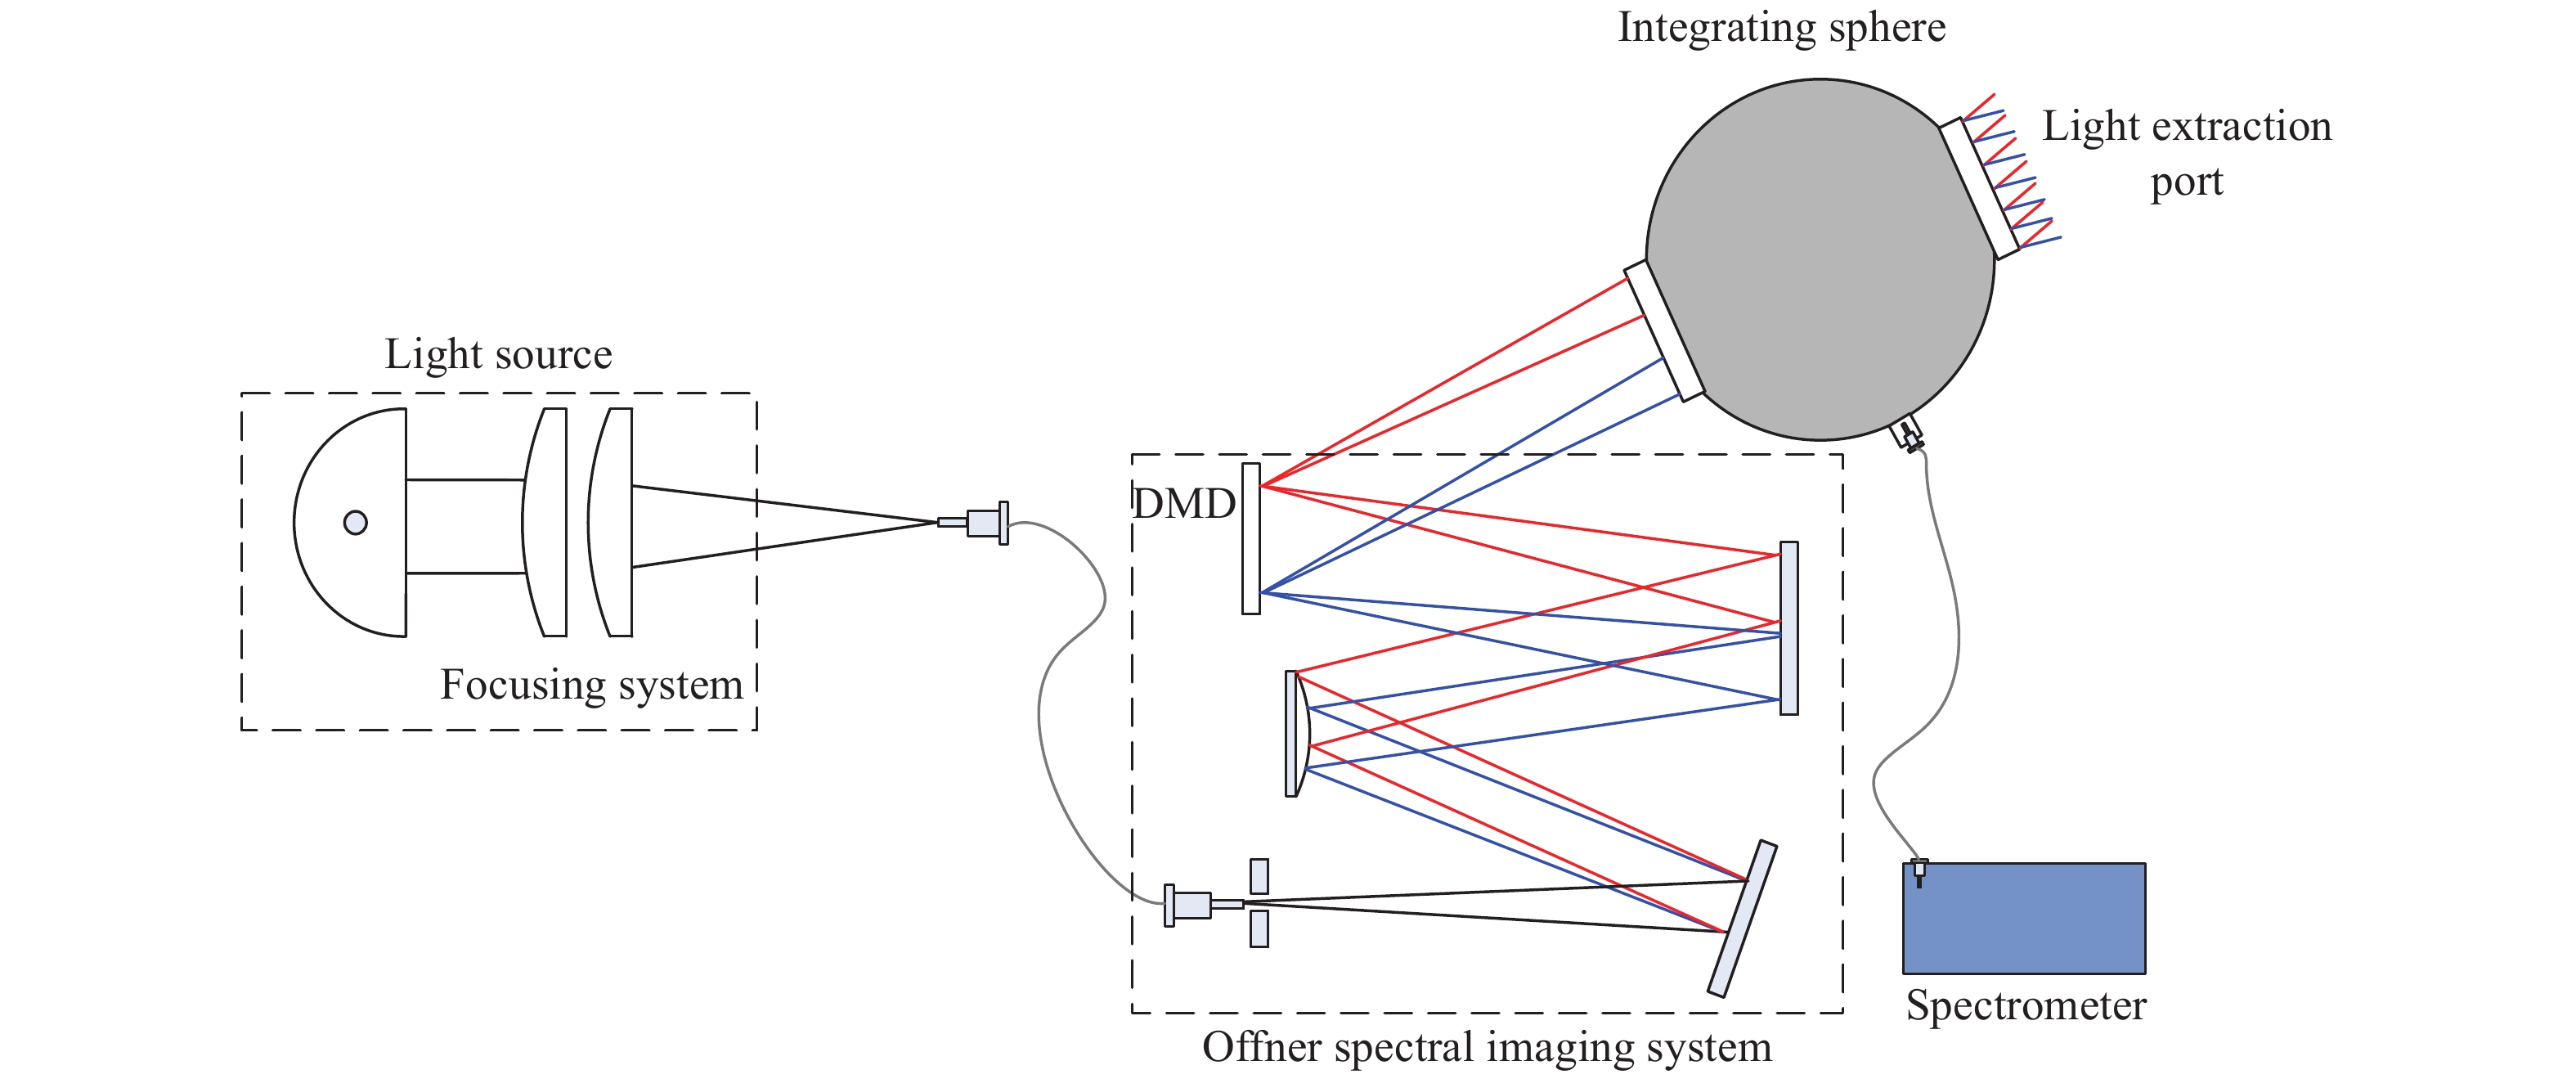
In order to satisfy the spectral radiance calibration of remote sensing instruments in different spectral distribution, reduce the influence of spectral radiance calibration light sources on the calibration coefficients of space optical remote sensing instruments, and solve technical problems of low spectral simulation accuracy and small spectral dynamic adjustment range, a design method for Offner type convex grating radiation calibration systems with a wide dynamic range based on spectral superposition and the principles of multi-spectral synthesis was presented, and its anastigmatic conditions were derived. The Offner spectral imaging optical system was designed with a cylindrical mirror with an accurate subdivision of broad spectral beams. Then, the mapping relationship between the array surface of the Digital Micro-mirror Device (DMD) and its spatial spectral radiation distribution was designed. The large dynamic range simulation of spectral distribution with the spatial light modulation characteristics of the DMD was achieved. Experiment results show that the interval of the spectral peak has an output by the adjacent unit array micro-mirror is greater than 0.5 nm, the spectral simulation accuracy of three typical color temperatures is 5.2% at T=3000 K, 4.1% at T=5000 K, and 3.2% at T=7000 K. The spectral simulation accuracy of the radiation calibration source was significantly improved, and the influence of spectral mismatch on the calibration coefficients of space optical remote sensing instruments was effectively diminished.
In order to satisfy the spectral radiance calibration of remote sensing instruments in different spectral distribution, reduce the influence of spectral radiance calibration light sources on the calibration coefficients of space optical remote sensing instruments, and solve technical problems of low spectral simulation accuracy and small spectral dynamic adjustment range, a design method for Offner type convex grating radiation calibration systems with a wide dynamic range based on spectral superposition and the principles of multi-spectral synthesis was presented, and its anastigmatic conditions were derived. The Offner spectral imaging optical system was designed with a cylindrical mirror with an accurate subdivision of broad spectral beams. Then, the mapping relationship between the array surface of the Digital Micro-mirror Device (DMD) and its spatial spectral radiation distribution was designed. The large dynamic range simulation of spectral distribution with the spatial light modulation characteristics of the DMD was achieved. Experiment results show that the interval of the spectral peak has an output by the adjacent unit array micro-mirror is greater than 0.5 nm, the spectral simulation accuracy of three typical color temperatures is 5.2% at T=3000 K, 4.1% at T=5000 K, and 3.2% at T=7000 K. The spectral simulation accuracy of the radiation calibration source was significantly improved, and the influence of spectral mismatch on the calibration coefficients of space optical remote sensing instruments was effectively diminished.
2020, 13(5): 1094-1102.
doi: 10.37188/CO.2019-0252
cstr: 32171.14.CO.2019-0252
Abstract:
The accurate flat-field calibration of large-diameter space survey telescopes is an important prerequisite for achieving some established scientific goals. At present, it is common practice to provide a uniform flat-field reference through a flat-field screen or a large-diameter integrating sphere, which is used to check the consistency of an image’s plane response. To address issues with the uniformity of flat-field screen illumination and the difficulty of preparing large-size integrating spheres, a flat-field calibration method based on sub-aperture scanning is proposed in this paper, which improves the uniformity of the flat-field reference and the uncertain calibration caused by stray light. First, we complete a sub-aperture flat-field calibration theory analysis, establish a sub-aperture flat-field calibration mathematical model, plan the sub-aperture scanning route and scan aperture size, and perform the initial design of the parameters of the collimation system for calibration. Secondly, we complete the image surface illumination simulation verification experiment. Finally, we set up an experiment to scan the planned sub-apertures, build full-aperture illuminance data, and verify the feasibility of the above-mentioned large-aperture space survey telescope sub-aperture stitching flat-field calibration scheme. The experimental results show that the full-aperture illuminance information can be restored using the full-aperture stitching method to scan the image surface energy of the system and by using the sub-aperture stitching method to compare and contrast the full-aperture image surface illuminance. The superimposed gray value in our experiment was 233.350 and the error was 1%. It is therefore verified that the sub-aperture stitching method can be used for flat-field calibration of large-diameter sky survey telescopes, and has practical value in real-world applications.
The accurate flat-field calibration of large-diameter space survey telescopes is an important prerequisite for achieving some established scientific goals. At present, it is common practice to provide a uniform flat-field reference through a flat-field screen or a large-diameter integrating sphere, which is used to check the consistency of an image’s plane response. To address issues with the uniformity of flat-field screen illumination and the difficulty of preparing large-size integrating spheres, a flat-field calibration method based on sub-aperture scanning is proposed in this paper, which improves the uniformity of the flat-field reference and the uncertain calibration caused by stray light. First, we complete a sub-aperture flat-field calibration theory analysis, establish a sub-aperture flat-field calibration mathematical model, plan the sub-aperture scanning route and scan aperture size, and perform the initial design of the parameters of the collimation system for calibration. Secondly, we complete the image surface illumination simulation verification experiment. Finally, we set up an experiment to scan the planned sub-apertures, build full-aperture illuminance data, and verify the feasibility of the above-mentioned large-aperture space survey telescope sub-aperture stitching flat-field calibration scheme. The experimental results show that the full-aperture illuminance information can be restored using the full-aperture stitching method to scan the image surface energy of the system and by using the sub-aperture stitching method to compare and contrast the full-aperture image surface illuminance. The superimposed gray value in our experiment was 233.350 and the error was 1%. It is therefore verified that the sub-aperture stitching method can be used for flat-field calibration of large-diameter sky survey telescopes, and has practical value in real-world applications.
2020, 13(5): 1103-1114.
doi: 10.37188/CO.2020-0029
cstr: 32171.14.CO.2020-0029
Abstract:
In order to meet the demand of large-area surface roughness measurement, a non-contact differential measurement system based on chromatic confocal sensors is presented in this paper. In the proposed system, two chromatic sensors and an optical flat, forming a differential measurement structure, are coupled with the motion system with a ball-to-socket connection. Using this differential configuration, the straightness error of the motion system is compensated and the measurement accuracy can be effectively improved. Based on this system, the methodology of surface roughness measurement, error compensation and measurement performance evaluation is established. In order to verify the measurement performance of the proposed system, standard step heights and roughness comparators are measured. For the step height measurement, the experimental results show that in the travel range of 60 mm, the standard deviation of the proposed system in six repeated measurements is 0.16 μm and the relative standard deviation RSD is 0.054%. From the results, it can be concluded that the straightness error of the motion system has been effectively overcome. When measuring the roughness comparators, the measurement errors of Ra and Rq are 0.032 μm and 0.073 μm, respectively. Therefore, the roughness measurement capability of the proposed system meets the requirements of most engineering applications.
In order to meet the demand of large-area surface roughness measurement, a non-contact differential measurement system based on chromatic confocal sensors is presented in this paper. In the proposed system, two chromatic sensors and an optical flat, forming a differential measurement structure, are coupled with the motion system with a ball-to-socket connection. Using this differential configuration, the straightness error of the motion system is compensated and the measurement accuracy can be effectively improved. Based on this system, the methodology of surface roughness measurement, error compensation and measurement performance evaluation is established. In order to verify the measurement performance of the proposed system, standard step heights and roughness comparators are measured. For the step height measurement, the experimental results show that in the travel range of 60 mm, the standard deviation of the proposed system in six repeated measurements is 0.16 μm and the relative standard deviation RSD is 0.054%. From the results, it can be concluded that the straightness error of the motion system has been effectively overcome. When measuring the roughness comparators, the measurement errors of Ra and Rq are 0.032 μm and 0.073 μm, respectively. Therefore, the roughness measurement capability of the proposed system meets the requirements of most engineering applications.
2020, 13(5): 1115-1123.
doi: 10.37188/CO.2019-0256
cstr: 32171.14.CO.2019-0256
Abstract:
The spectral polarized BRDF of a brass surface in the near-infrared region was measured using the absolute measurement method with a home-made device. The temperature range was 20~800 ℃, and the influence of temperature on the BRDF was analyzed. The results indicate that temperature has an obvious influence on the BRDF of brass. With an increase in temperature, the BRDF was almost constant at first, then increased before finally decreasing. Scanning electron microscope testing, roughness measurement and X-ray diffraction analysis of the brass surface at different temperatures were performed. The test results indicate that the influence of temperature on BRDF can be attributed to variation in surface morphology and chemical composition.
The spectral polarized BRDF of a brass surface in the near-infrared region was measured using the absolute measurement method with a home-made device. The temperature range was 20~800 ℃, and the influence of temperature on the BRDF was analyzed. The results indicate that temperature has an obvious influence on the BRDF of brass. With an increase in temperature, the BRDF was almost constant at first, then increased before finally decreasing. Scanning electron microscope testing, roughness measurement and X-ray diffraction analysis of the brass surface at different temperatures were performed. The test results indicate that the influence of temperature on BRDF can be attributed to variation in surface morphology and chemical composition.
2020, 13(5): 1124-1137.
doi: 10.37188/CO.2020-0109
cstr: 32171.14.CO.2020-0109
Abstract:
During flight, changes in environmental parameters affect the accuracy of non-uniformity correction of airborne infrared point-target detection systems to some extent. Therefore, it is necessary to perform on-board scene-based non-uniformity correction. In this paper, we propose an algorithm based on inter-frame registration to achieve on-board non-uniformity correction. It first preprocesses the images to filter out dead pixels, then calculates a cross-power spectrum with two adjacent frames and determines their registration displacement according to a correlation function that is calculated from the cross-power spectrum. After registering an image, corrective parameters are updated by minimizing the error through a function. The corrective parameters are finally obtained after the above calculations are performed. In an experimental comparison, we simulate a set of non-uniform scene image sequences as the experimental image sequence. This experiment first identified the influence of changes between frames (including displacement, rotation and scaling) on the accuracy of non-uniformity correction. It then used two representative algorithms and the proposed algorithm to process the image series, and compared the performance of the algorithms from the perspective of image quality and convergence speed. The results show that the proposed algorithm has better non-uniformity corrective performance compared with the two other methods. The PSNR increased by over 20 dB, and the SSIM exceeded 0.99. The proposed algorithm has higher complexity, but its convergence speed is much faster, and it is easy to be implemented on hardware platforms, which gives the algorithm possible applications in engineering.
During flight, changes in environmental parameters affect the accuracy of non-uniformity correction of airborne infrared point-target detection systems to some extent. Therefore, it is necessary to perform on-board scene-based non-uniformity correction. In this paper, we propose an algorithm based on inter-frame registration to achieve on-board non-uniformity correction. It first preprocesses the images to filter out dead pixels, then calculates a cross-power spectrum with two adjacent frames and determines their registration displacement according to a correlation function that is calculated from the cross-power spectrum. After registering an image, corrective parameters are updated by minimizing the error through a function. The corrective parameters are finally obtained after the above calculations are performed. In an experimental comparison, we simulate a set of non-uniform scene image sequences as the experimental image sequence. This experiment first identified the influence of changes between frames (including displacement, rotation and scaling) on the accuracy of non-uniformity correction. It then used two representative algorithms and the proposed algorithm to process the image series, and compared the performance of the algorithms from the perspective of image quality and convergence speed. The results show that the proposed algorithm has better non-uniformity corrective performance compared with the two other methods. The PSNR increased by over 20 dB, and the SSIM exceeded 0.99. The proposed algorithm has higher complexity, but its convergence speed is much faster, and it is easy to be implemented on hardware platforms, which gives the algorithm possible applications in engineering.
2020, 13(5): 1138-1146.
doi: 10.37188/CO.2020-0073
cstr: 32171.14.CO.2020-0073
Abstract:
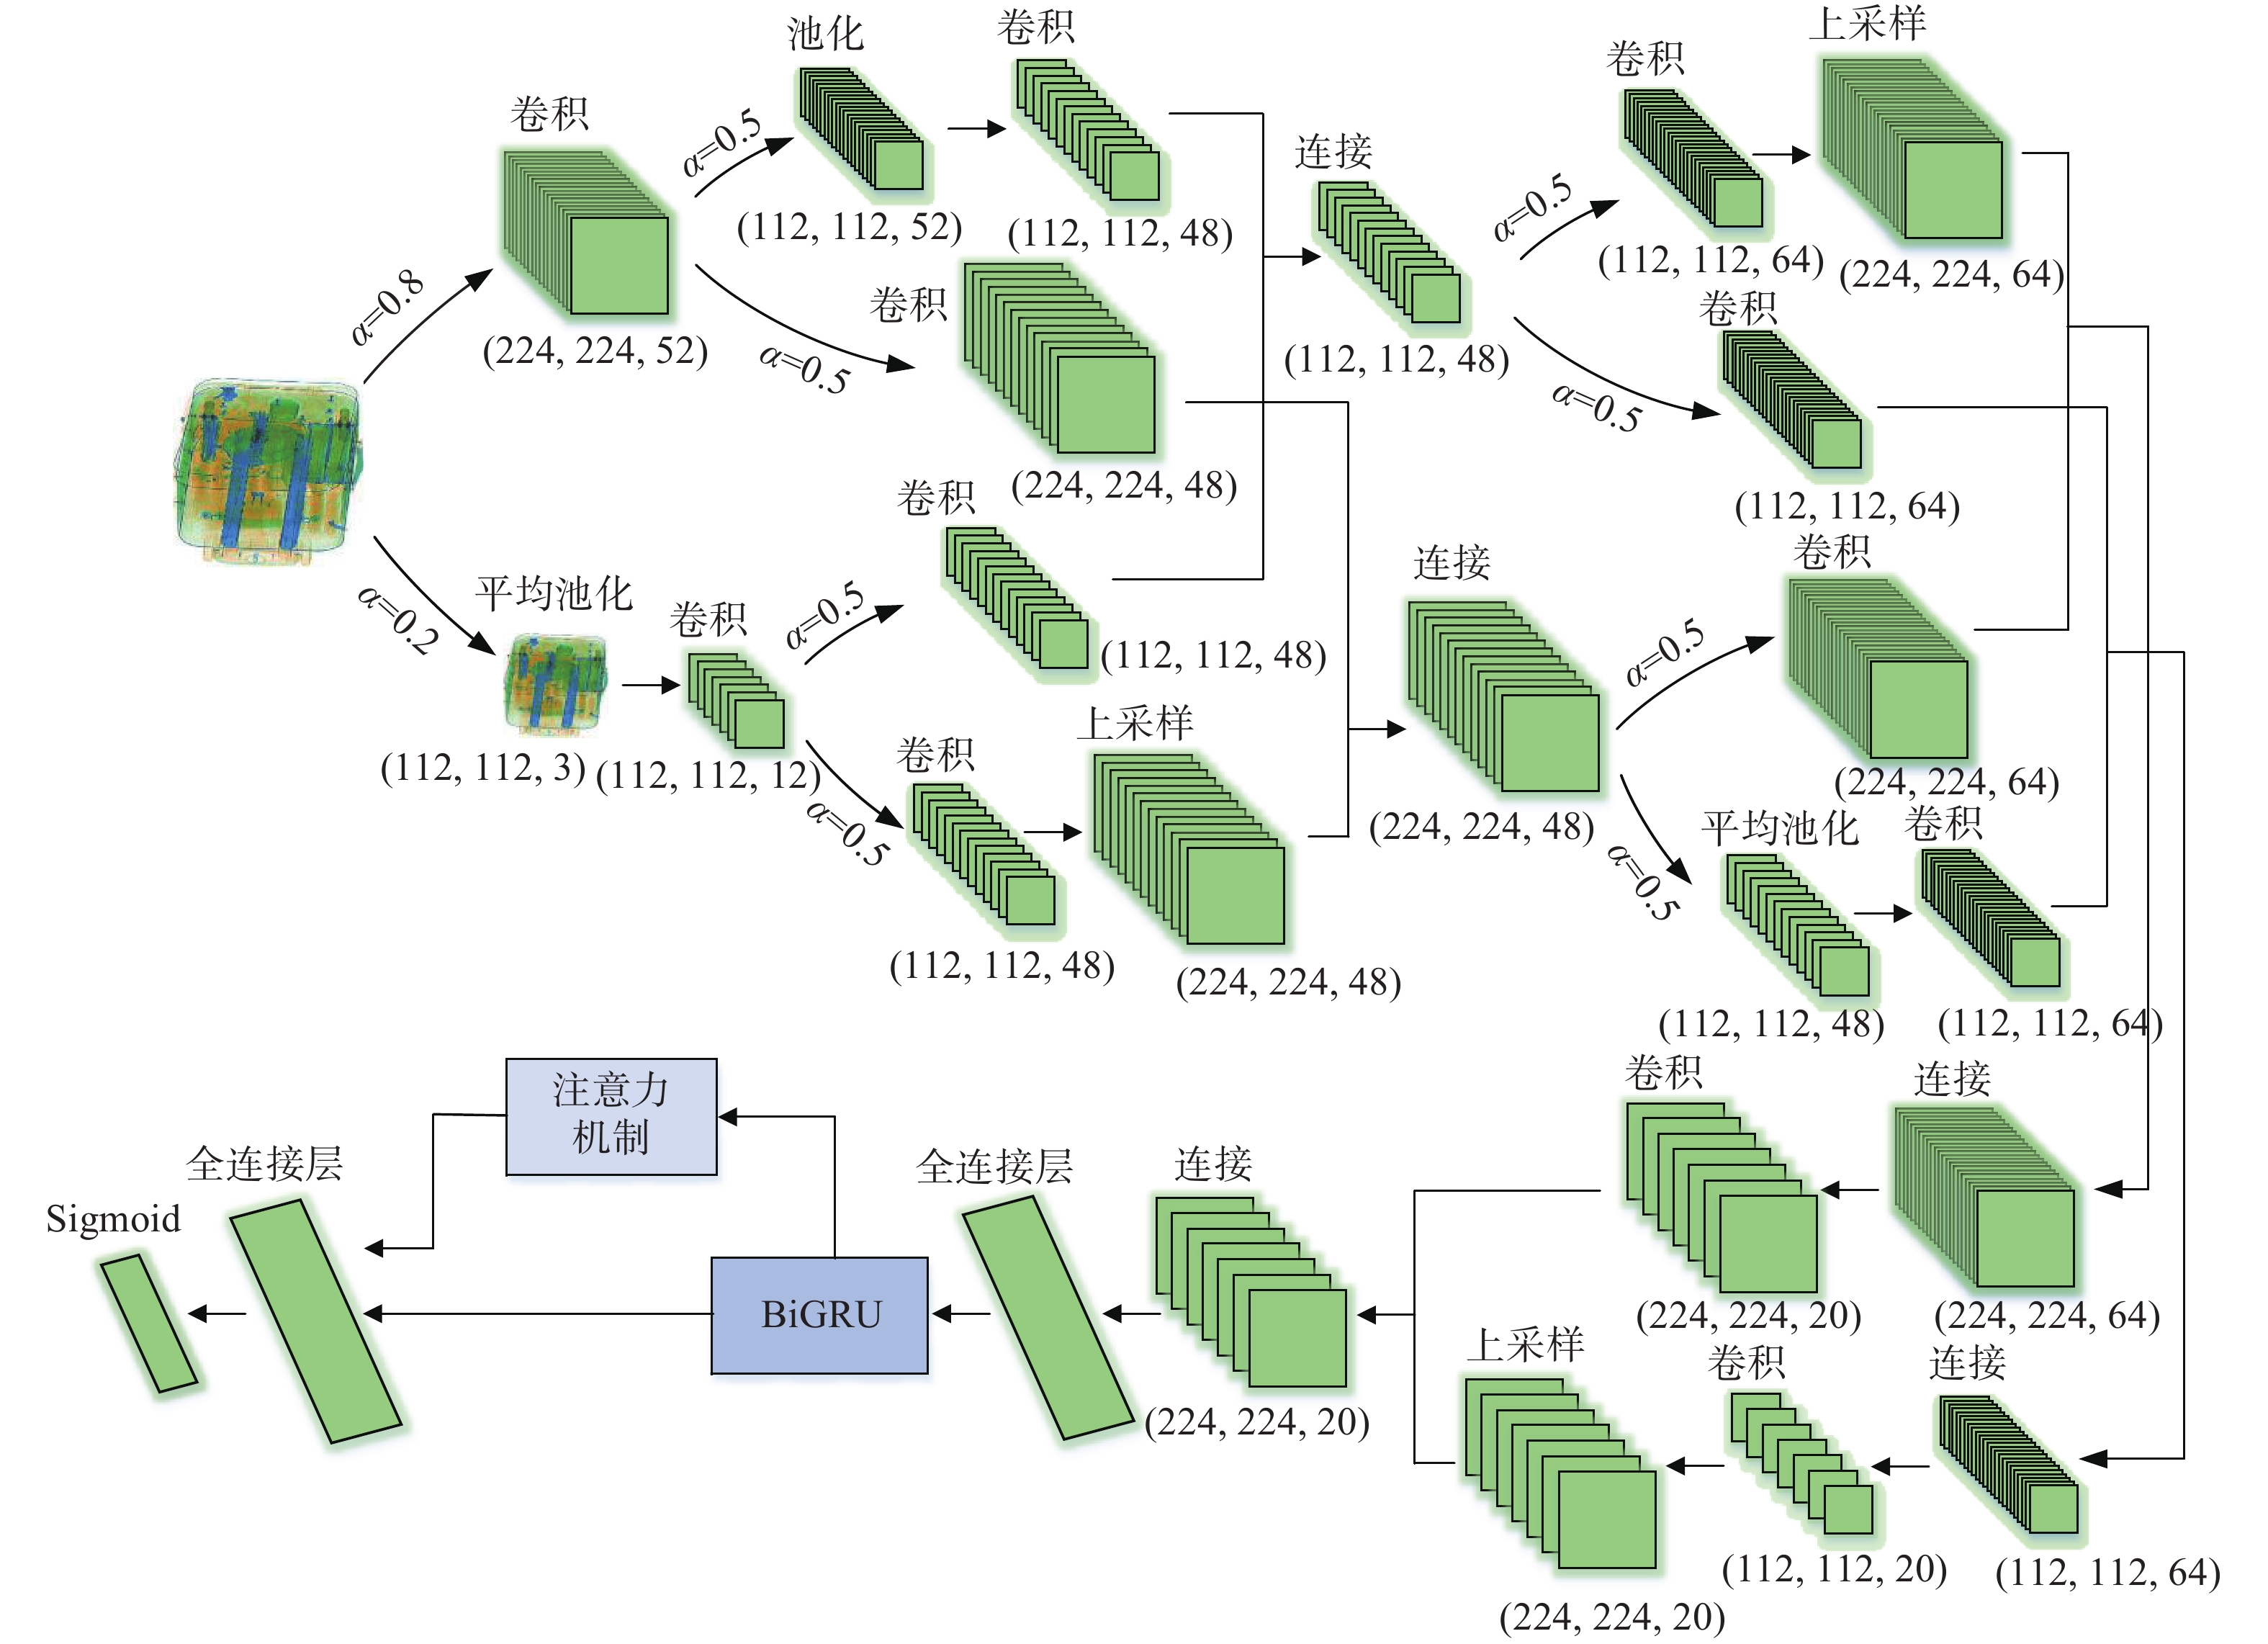
Due to the disadvantages of low accuracy and slow speed in the active vision security inspection method, it is not suitable for real-time security inspection. Aiming at this problem, we propose an x-ray inspection image classification algorithm combining octave convolution (OctConv) with attention-based bidirectional Gate Recurrent Unit (GRU). Firstly, OctConv is introduced to replace the traditional convolution operation to divide the input feature vector into high and low frequency, and reduce the resolution of low frequency features, effectively extracting the features of security image and reducing the spatial redundancy. Then, the feature weight can be adjusted by dynamic learning through attention-based bidirectional GRU to improve the classification accuracy of threat objects. Finally, a lot of experimental results on SIXRay dataset show that the classification accuracy, AUC value and PRE of 8000 test samples are 98.73%, 91.39% and 85.44%, respectively, with a time of 36.80 seconds. Compared with the current mainstream model, the proposed algorithm can improve the performance and speed of threat objects recognition in X-ray security images.
Due to the disadvantages of low accuracy and slow speed in the active vision security inspection method, it is not suitable for real-time security inspection. Aiming at this problem, we propose an x-ray inspection image classification algorithm combining octave convolution (OctConv) with attention-based bidirectional Gate Recurrent Unit (GRU). Firstly, OctConv is introduced to replace the traditional convolution operation to divide the input feature vector into high and low frequency, and reduce the resolution of low frequency features, effectively extracting the features of security image and reducing the spatial redundancy. Then, the feature weight can be adjusted by dynamic learning through attention-based bidirectional GRU to improve the classification accuracy of threat objects. Finally, a lot of experimental results on SIXRay dataset show that the classification accuracy, AUC value and PRE of 8000 test samples are 98.73%, 91.39% and 85.44%, respectively, with a time of 36.80 seconds. Compared with the current mainstream model, the proposed algorithm can improve the performance and speed of threat objects recognition in X-ray security images.
2020, 13(5): 1147-1157.
doi: 10.37188/CO.2020-0072
cstr: 32171.14.CO.2020-0072
Abstract:
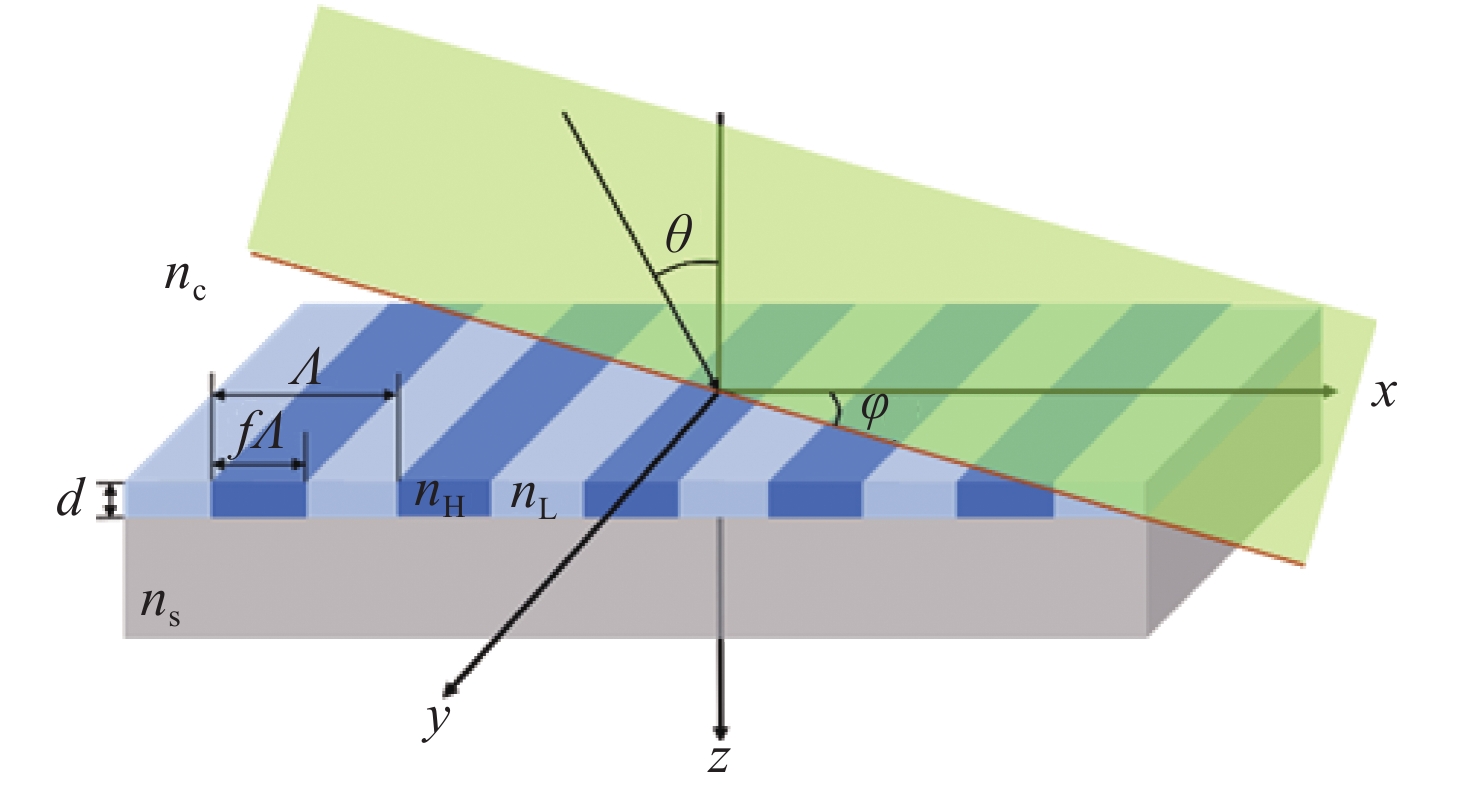
At present, narrow-band filter based on resonant waveguide grating structure applied to biosensors can only achieve a single filter mode of reflection or transmission. In order to expand the variety of samples and improve the accuracy of the samples testing, a resonant waveguide grating filter with both reflection and transmission modes was designed based on the guided mode resonance effect. Firstly, based on the classical one-dimensional resonant waveguide grating structure, a filter with convertible reflection-transmission mode at the same wavelength (632.8 nm) was designed by adjusting the incident conditions. In both modes, excellent filtering performance was presented, spectral efficiency was higher than 98%, and Q factor was greater than 1000. Then, the resonance mechanism for that the same device can realize two filtering modes was analyzed. The results showed that the reflection and transmission narrow-band filtering modes could be converted at the designed wavelength with the same resonant waveguide grating structure under different incident conditions.
At present, narrow-band filter based on resonant waveguide grating structure applied to biosensors can only achieve a single filter mode of reflection or transmission. In order to expand the variety of samples and improve the accuracy of the samples testing, a resonant waveguide grating filter with both reflection and transmission modes was designed based on the guided mode resonance effect. Firstly, based on the classical one-dimensional resonant waveguide grating structure, a filter with convertible reflection-transmission mode at the same wavelength (632.8 nm) was designed by adjusting the incident conditions. In both modes, excellent filtering performance was presented, spectral efficiency was higher than 98%, and Q factor was greater than 1000. Then, the resonance mechanism for that the same device can realize two filtering modes was analyzed. The results showed that the reflection and transmission narrow-band filtering modes could be converted at the designed wavelength with the same resonant waveguide grating structure under different incident conditions.
2020, 13(5): 1158-1170.
doi: 10.37188/CO.2020-0020
cstr: 32171.14.CO.2020-0020
Abstract:
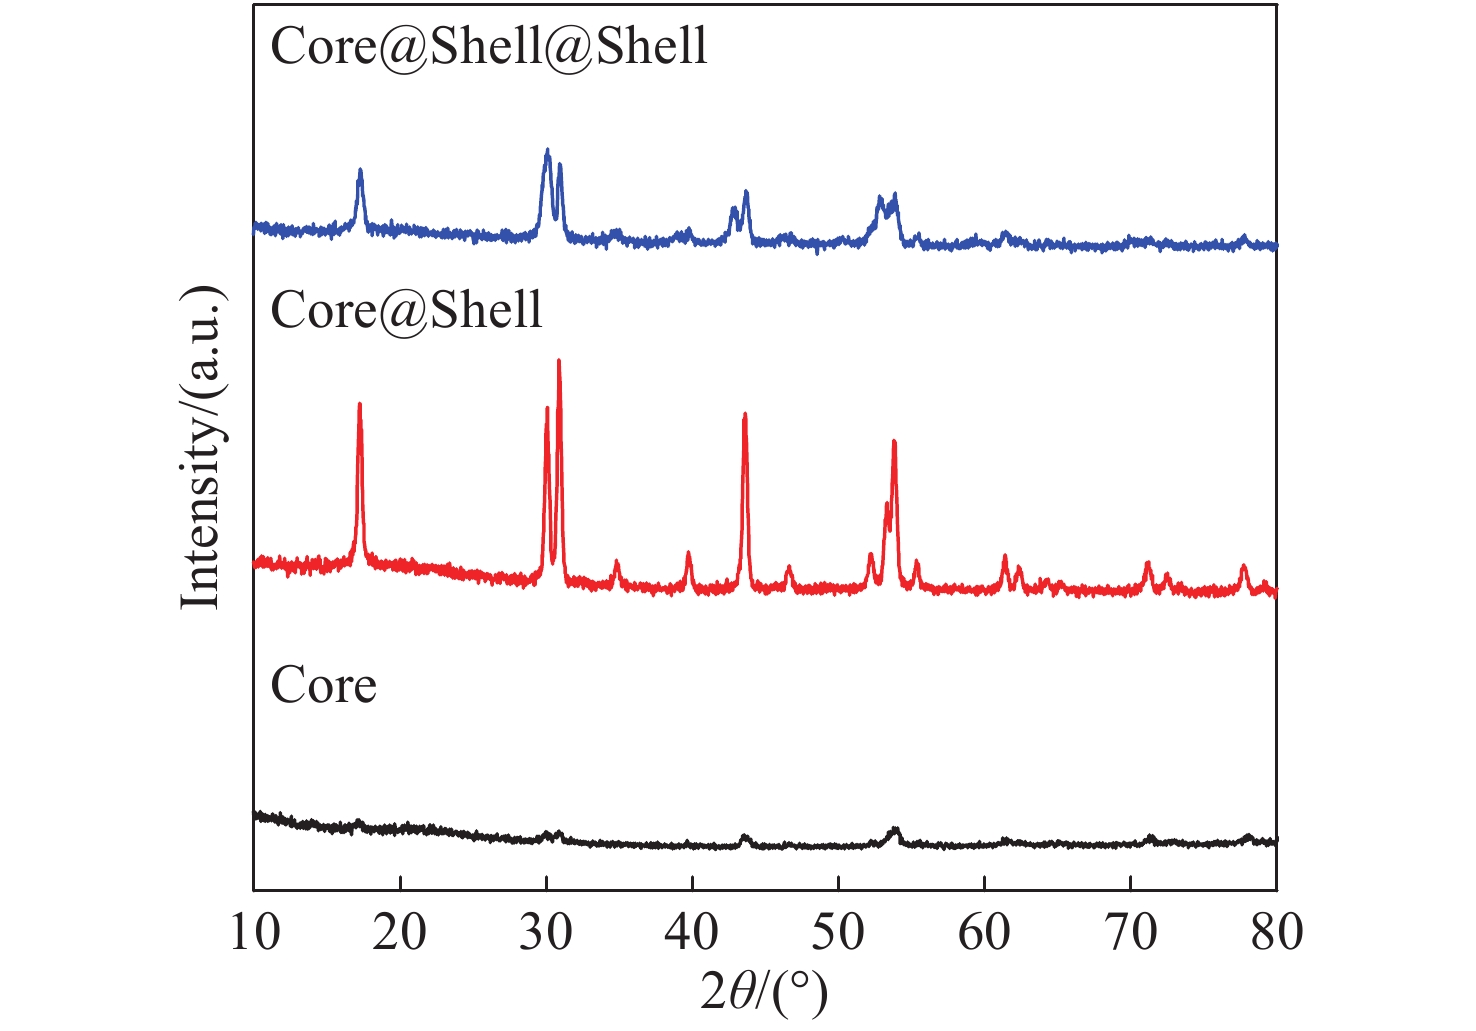
Upconversion luminescence nanomaterials have attracted widespread attention owing to their special optical properties, while most of them emit single color luminescence. In order to achieve multicolor orthogonal upconversion luminescence and avoid the synthesis complexity and interference between multiple dopant ions, herein, we reported a novel orthogonal emissive upconversion nanoparticle, NaErF4:Yb(19.5%)/Tm(0.5%)@NaYF4:Yb(10%)@NaNdF4:Yb(10%), through thermal decomposition strategy step by step. This novel nanoparticle can give out green luminescence and red luminescence by the energy level transition of Er3+ from 2H11/2,4S3/2→4I15/2 and 4F9/2→4I15/2 under the excitation light of 980 nm and 808 nm, respectively. The particles demonstrated uniform size, stable structure and excellent dispersibility. Under the excitation of 980 nm, the emission intensity at 650 nm of red luminescence was approximately 9.46 times more than the emission intensity at 540 nm. Under the excitation of 808 nm, the emission intensity at 540 nm of green luminescence was about 5.39 times more than the emission intensity at 650 nm.
Upconversion luminescence nanomaterials have attracted widespread attention owing to their special optical properties, while most of them emit single color luminescence. In order to achieve multicolor orthogonal upconversion luminescence and avoid the synthesis complexity and interference between multiple dopant ions, herein, we reported a novel orthogonal emissive upconversion nanoparticle, NaErF4:Yb(19.5%)/Tm(0.5%)@NaYF4:Yb(10%)@NaNdF4:Yb(10%), through thermal decomposition strategy step by step. This novel nanoparticle can give out green luminescence and red luminescence by the energy level transition of Er3+ from 2H11/2,4S3/2→4I15/2 and 4F9/2→4I15/2 under the excitation light of 980 nm and 808 nm, respectively. The particles demonstrated uniform size, stable structure and excellent dispersibility. Under the excitation of 980 nm, the emission intensity at 650 nm of red luminescence was approximately 9.46 times more than the emission intensity at 540 nm. Under the excitation of 808 nm, the emission intensity at 540 nm of green luminescence was about 5.39 times more than the emission intensity at 650 nm.


 Abstract
 FullText HTML
 PDF 2407KB